GYS1
[ENSRNOP00000028271]
Main page
| | | Plot |
Mito |
Lyso |
|
Perox |
ER |
Golgi |
PM |
Cytosol |
Nucleus |
|
| Expt A |
 3
3
peptides |
5
spectra |
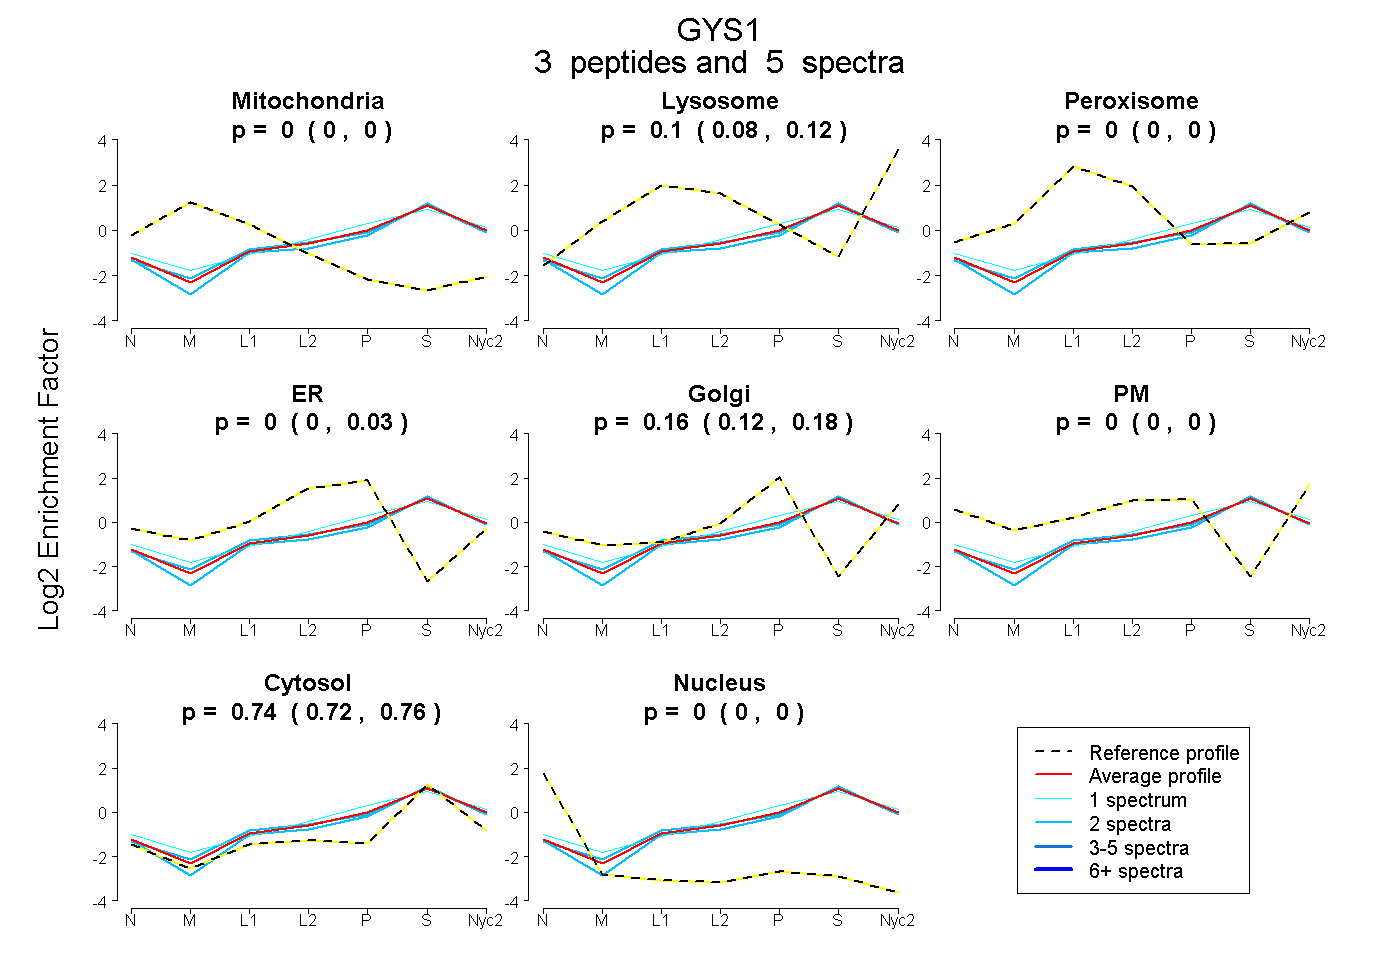 |
0.000
0.000 | 0.000 |
0.100
0.079 | 0.116 |
|
0.000
0.000 | 0.000 |
0.000
0.000 | 0.030 |
0.160
0.117 | 0.179 |
0.000
0.000 | 0.000 |
0.740
0.721 | 0.757 |
0.000
0.000 | 0.000 |
|
| | | Plot |
Mito |
|
Lyso or Perox |
|
ER |
Golgi |
PM |
Cytosol |
Nucleus |
|
| Expt B |
3
peptides |
4
spectra |
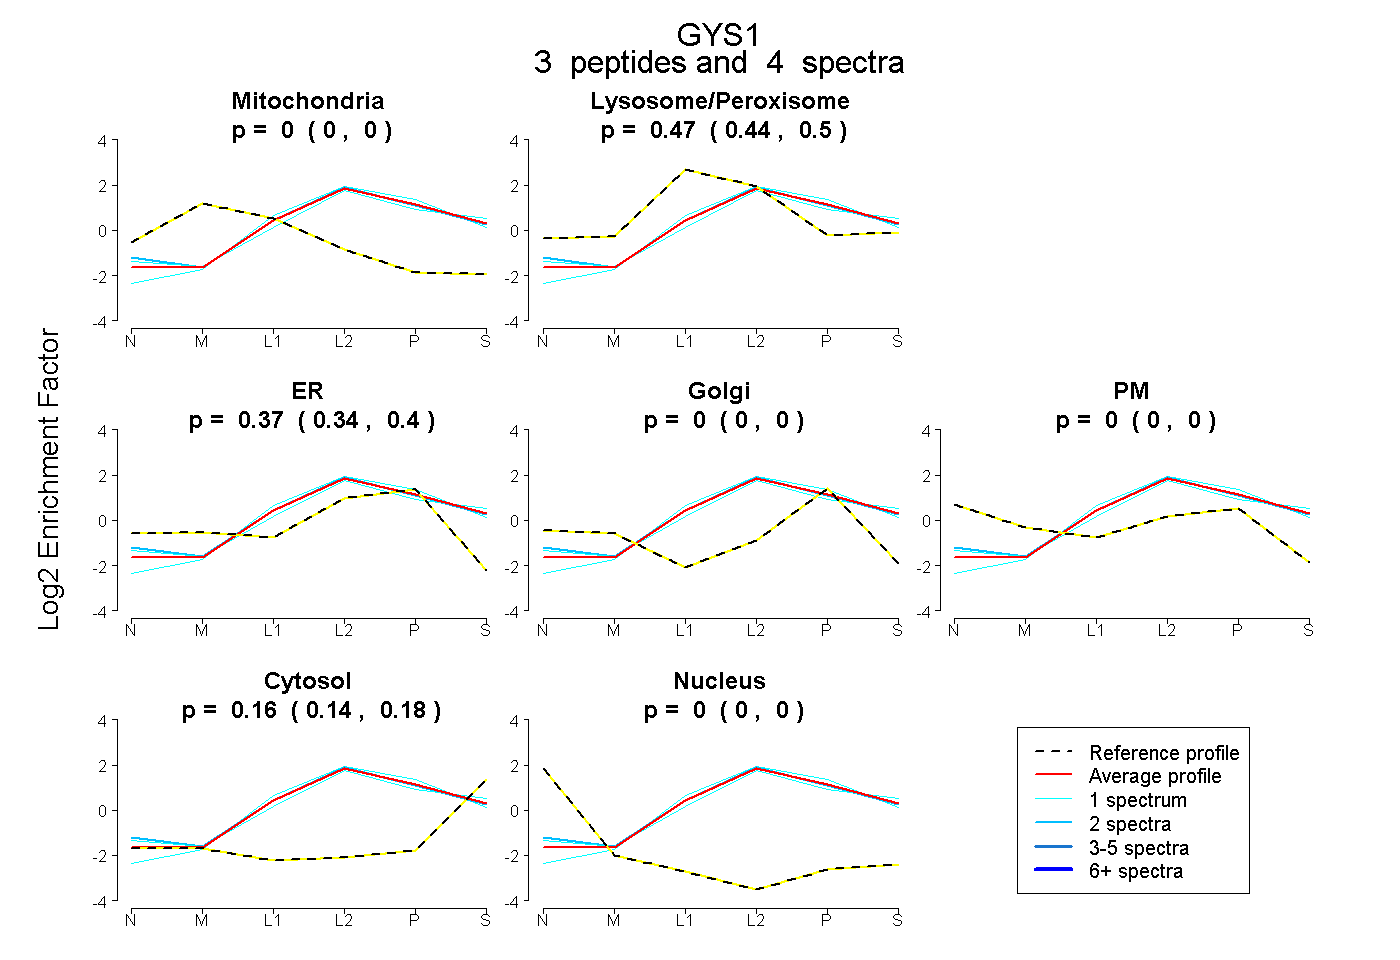 |
0.000
0.000 | 0.000 |
|
0.472
0.439 | 0.496 |
|
0.368
0.336 | 0.395 |
0.000
0.000 | 0.000 |
0.000
0.000 | 0.000 |
0.160
0.139 | 0.178 |
0.000
0.000 | 0.000 |
|
| 2 spectra, LNYLLR |
0.000 |
|
0.480 |
|
0.378 |
0.000 |
0.000 |
0.142 |
0.000 |
|
| 1 spectrum, AIFATQR |
0.000 |
|
0.477 |
|
0.393 |
0.000 |
0.000 |
0.130 |
0.000 |
|
| 1 spectrum, TLYFFIAGR |
0.000 |
|
0.455 |
|
0.334 |
0.000 |
0.000 |
0.211 |
0.000 |
|
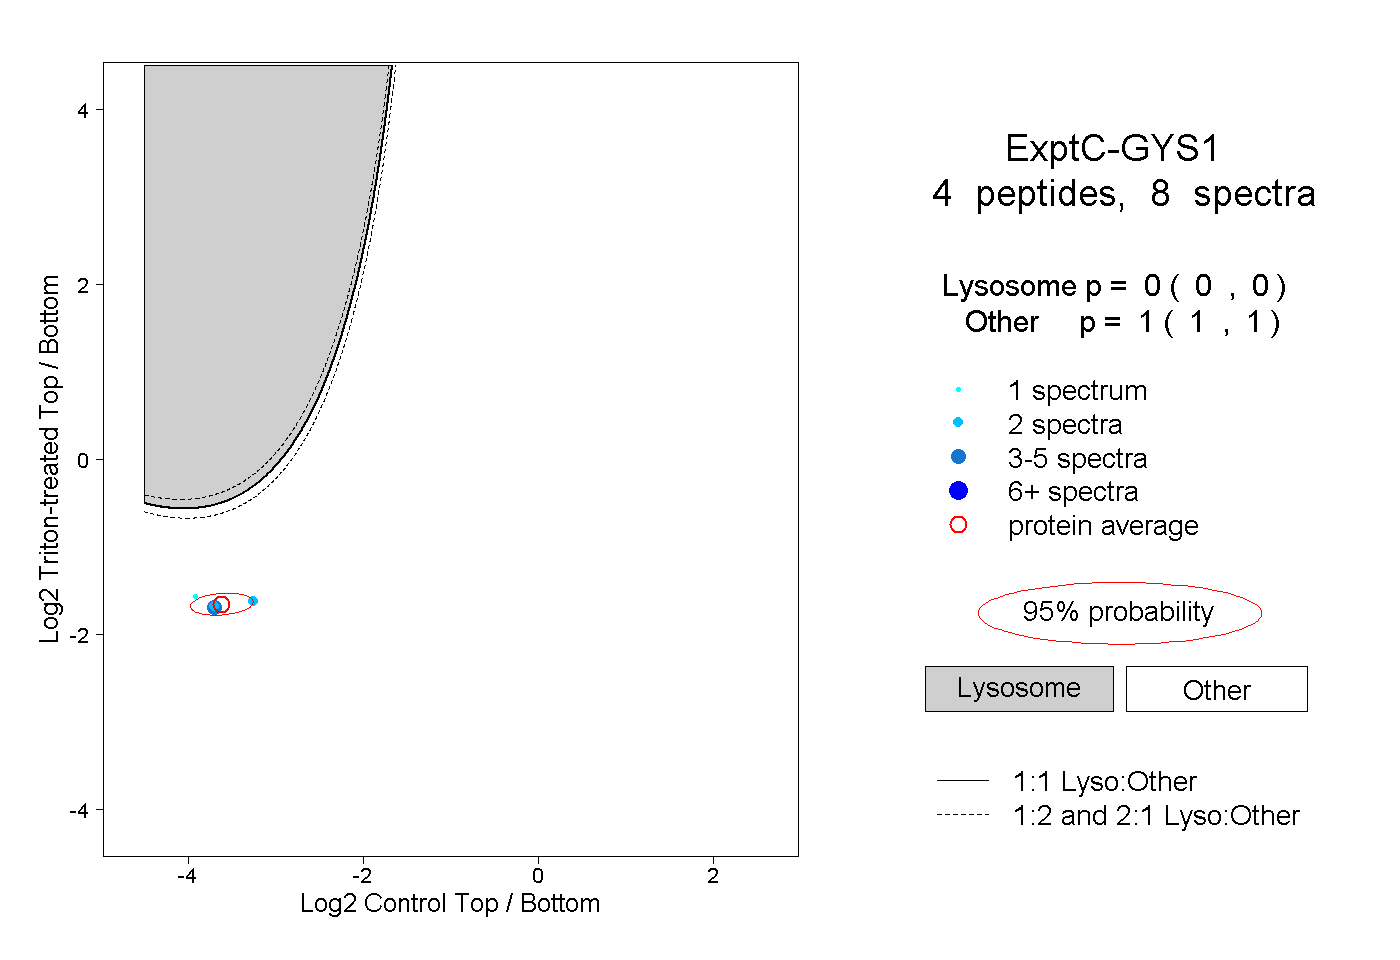
| | | Plot |
|
Lyso |
|
|
|
|
|
|
|
Other |
| Expt C |
4
peptides |
8
spectra |
 |
|
0.000
0.000 | 0.000 |
|
|
|
|
|
|
|
1.000
1.000 | 1.000 |