 3
3peptides
spectra
0.000 | 0.000
0.079 | 0.116
0.000 | 0.000
0.000 | 0.030
0.117 | 0.179
0.000 | 0.000
0.721 | 0.757
0.000 | 0.000
| Plot | Mito | Lyso | Perox | ER | Golgi | PM | Cytosol | Nucleus | |||||
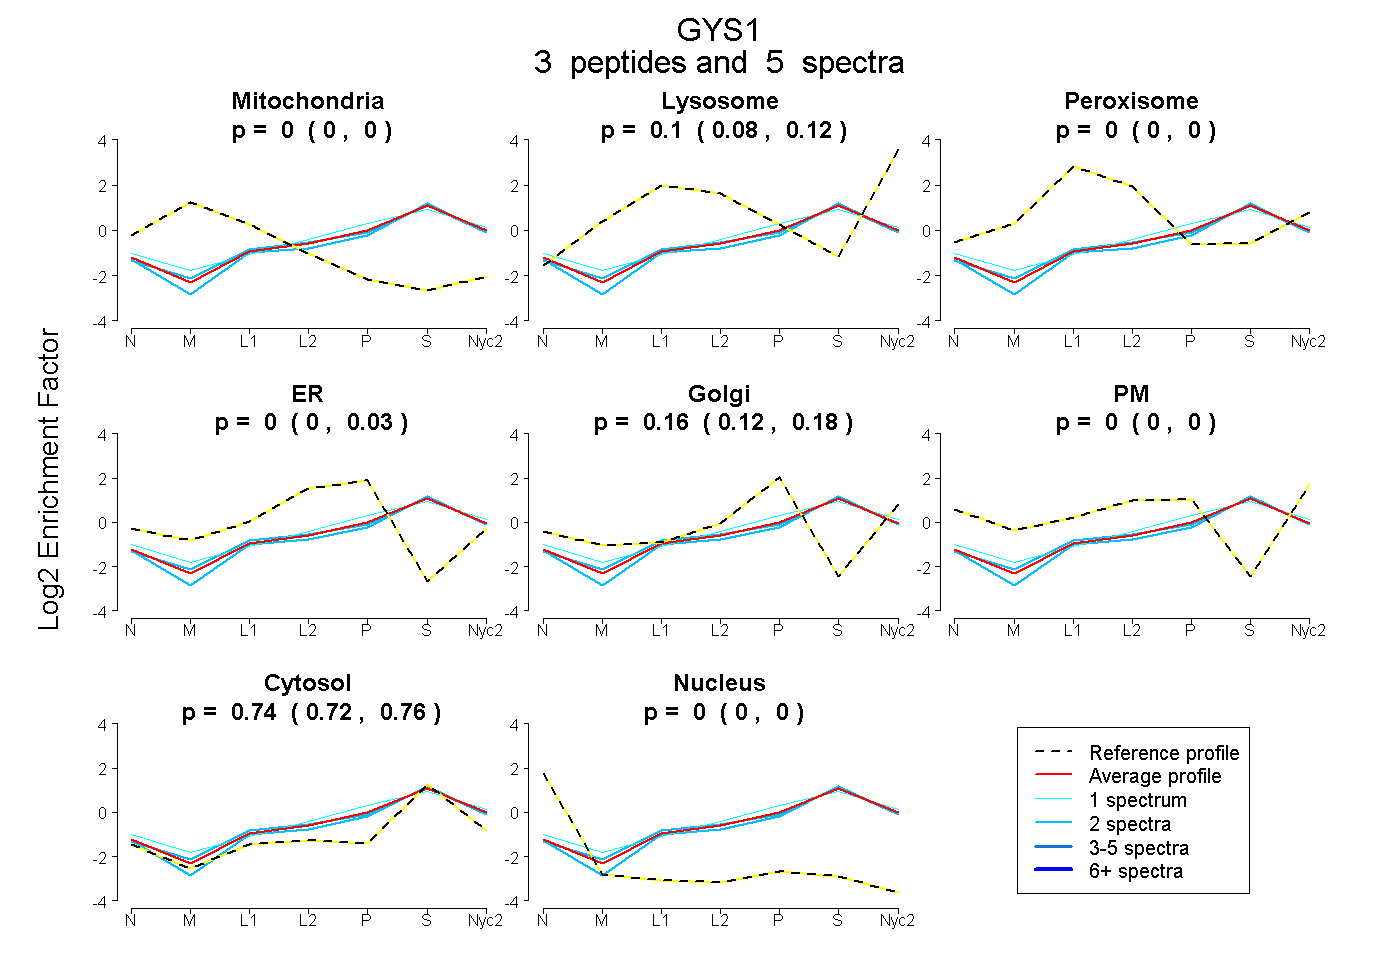
| Expt A |
3 peptides |
5 spectra |
|
0.000 0.000 | 0.000 |
0.100 0.079 | 0.116 |
0.000 0.000 | 0.000 |
0.000 0.000 | 0.030 |
0.160 0.117 | 0.179 |
0.000 0.000 | 0.000 |
0.740 0.721 | 0.757 |
0.000 0.000 | 0.000 |
| 1 spectrum, LSDLLDWK | 0.000 | 0.107 | 0.000 | 0.000 | 0.239 | 0.000 | 0.653 | 0.000 | ||
| 2 spectra, LNYLLR | 0.000 | 0.128 | 0.000 | 0.044 | 0.079 | 0.000 | 0.749 | 0.000 | ||
| 2 spectra, AIFATQR | 0.000 | 0.062 | 0.000 | 0.000 | 0.126 | 0.000 | 0.812 | 0.000 |
| Plot | Mito | Lyso or Perox | ER | Golgi | PM | Cytosol | Nucleus | ||||||
| Expt B |
3 peptides |
4 spectra |
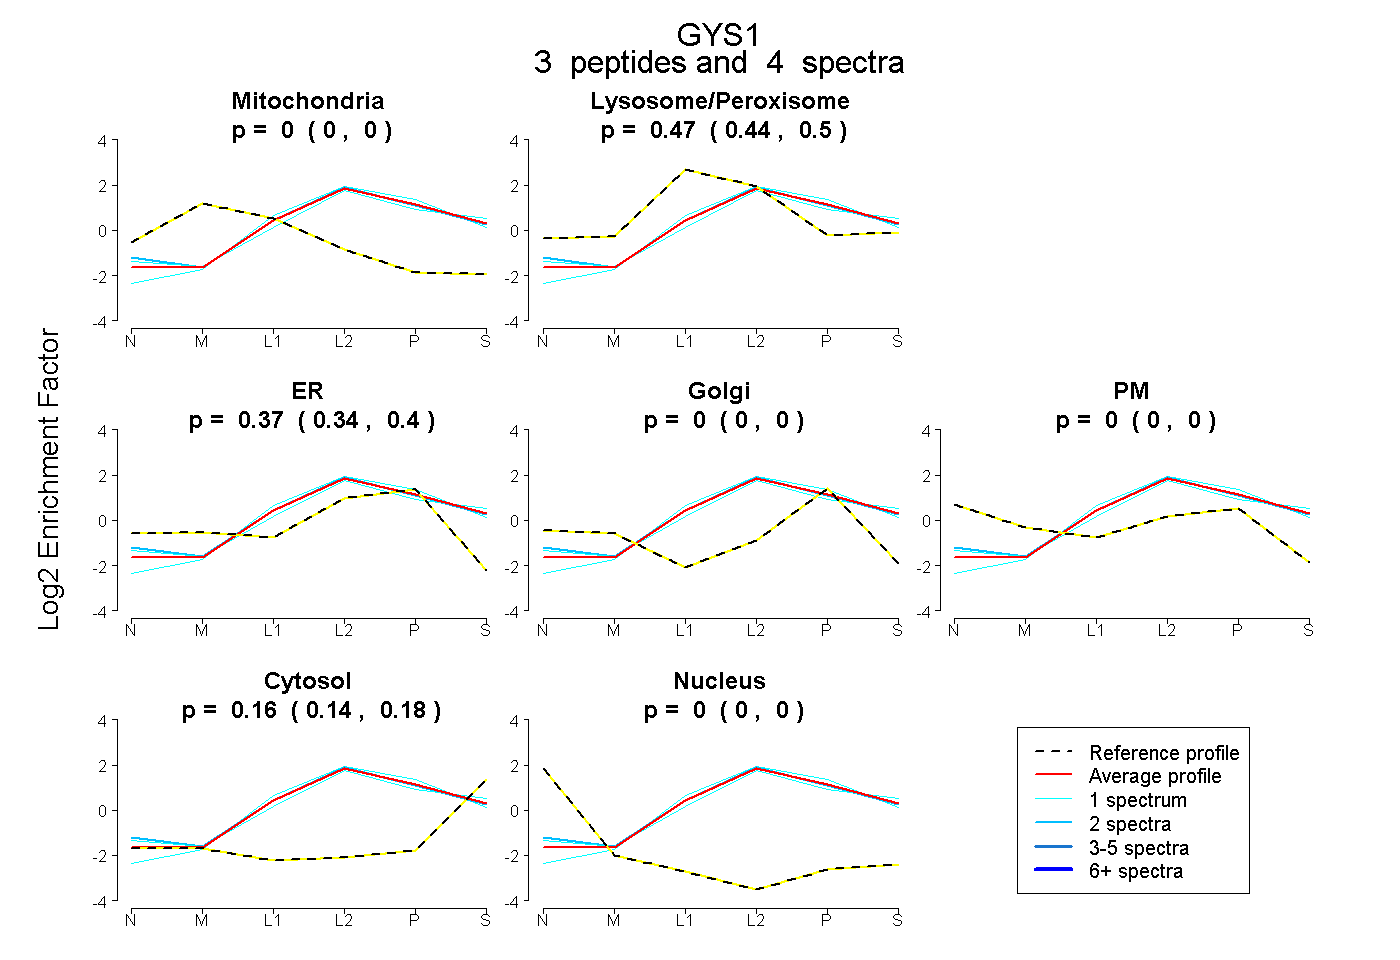 |
0.000 0.000 | 0.000 |
0.472 0.439 | 0.496 |
0.368 0.336 | 0.395 |
0.000 0.000 | 0.000 |
0.000 0.000 | 0.000 |
0.160 0.139 | 0.178 |
0.000 0.000 | 0.000 |
|||
| Plot | Lyso | Other | |||||||||||
| Expt C |
4 peptides |
8 spectra |
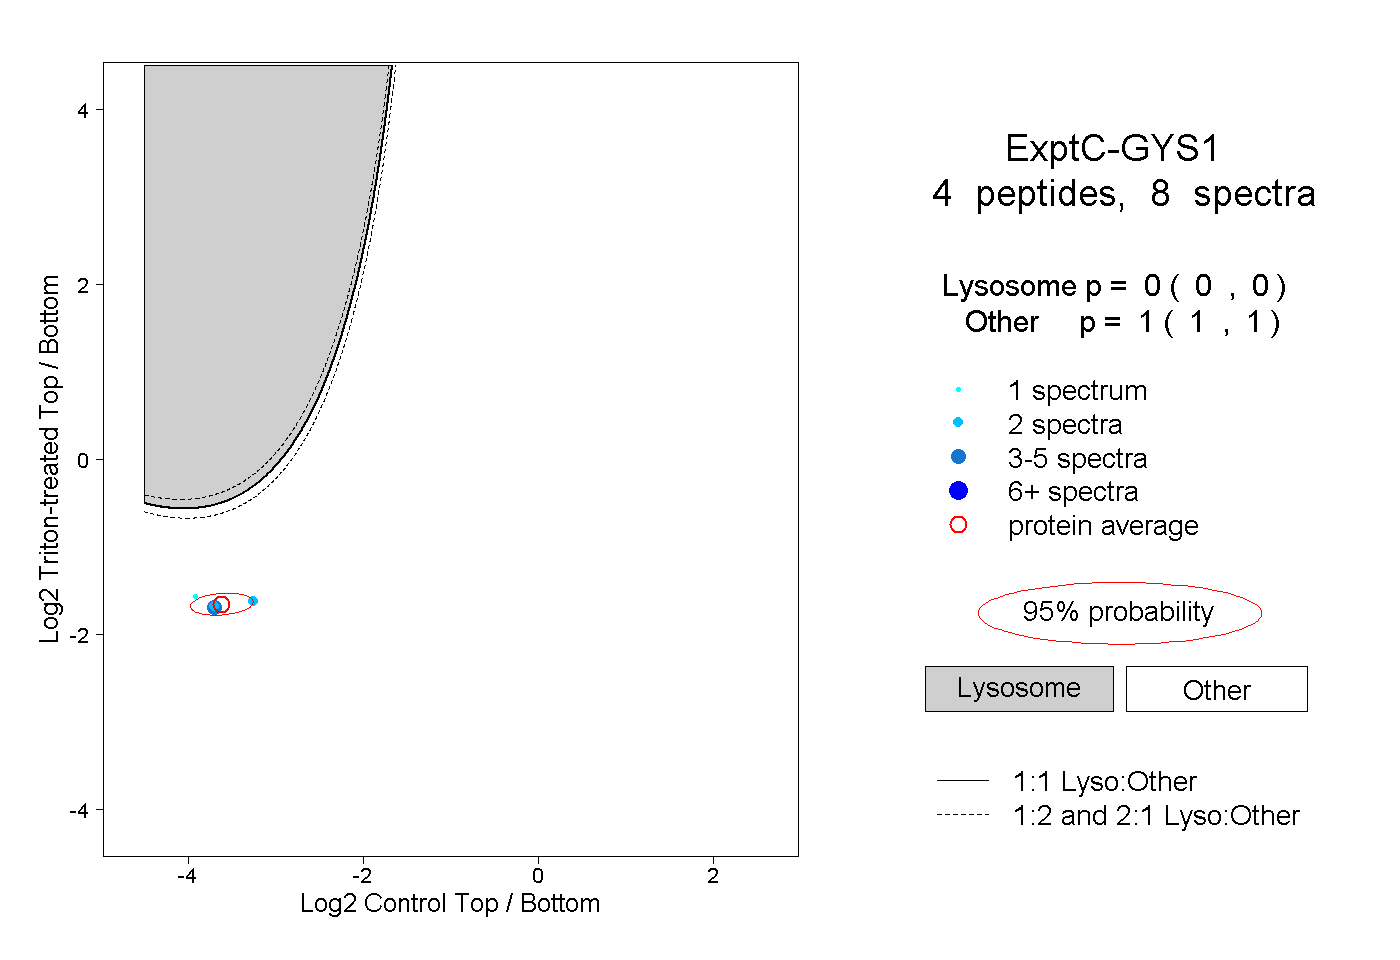 |
0.000 0.000 | 0.000 |
1.000 1.000 | 1.000 |