 5
5peptides
spectra
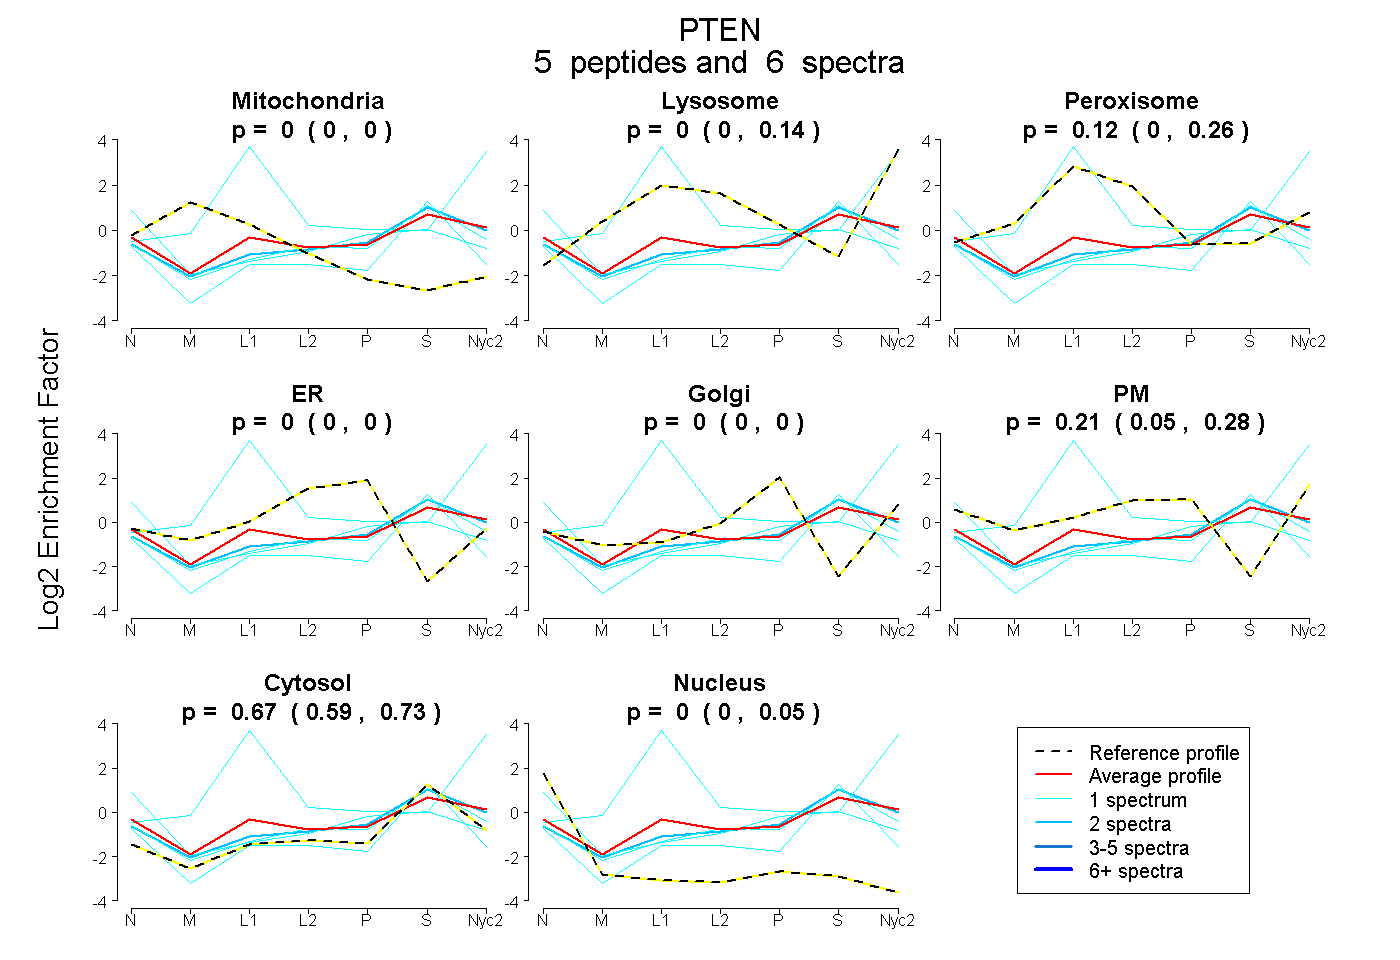
0.000 | 0.000
0.000 | 0.143
0.000 | 0.263
0.000 | 0.000
0.000 | 0.000
0.048 | 0.276
0.586 | 0.726
0.000 | 0.046
1peptide
spectrum
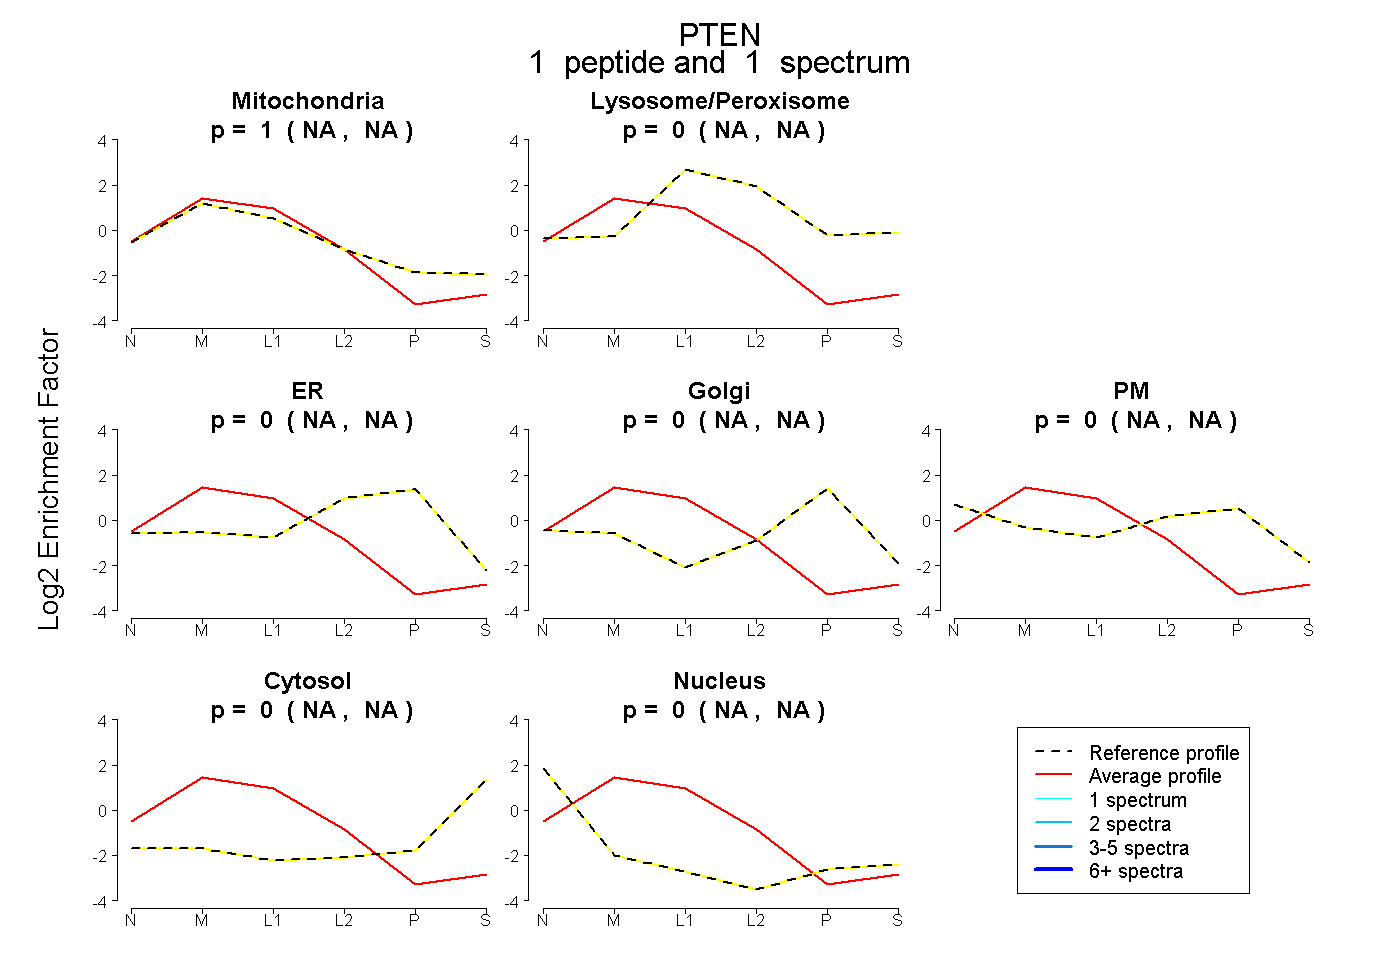
NA | NA
NA | NA
NA | NA
NA | NA
NA | NA
NA | NA
NA | NA
8peptides
spectra
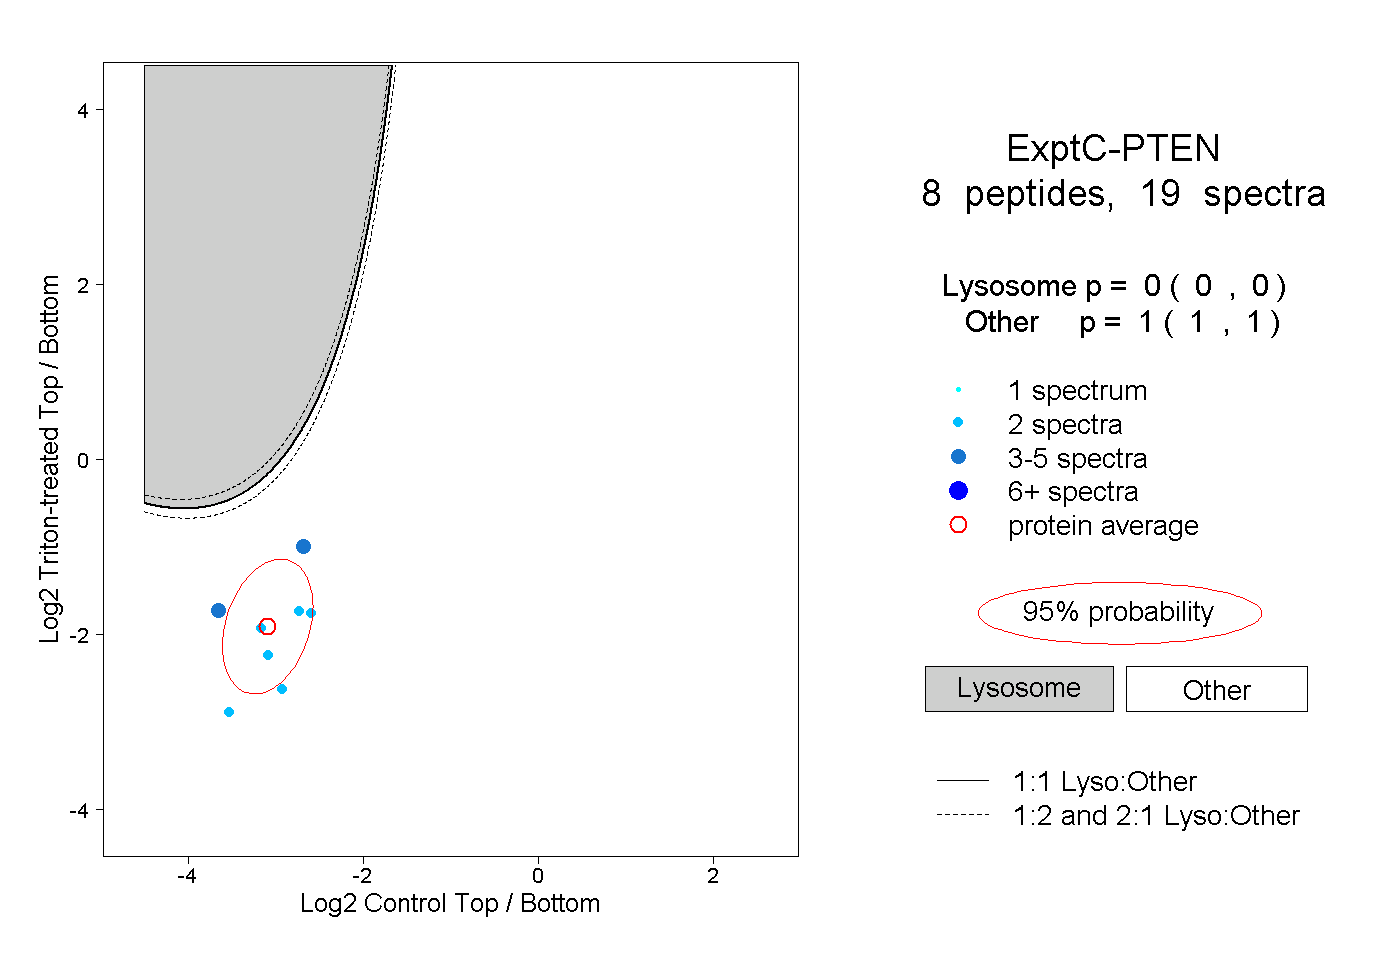
0.000 | 0.000
1.000 | 1.000
2peptides
spectra
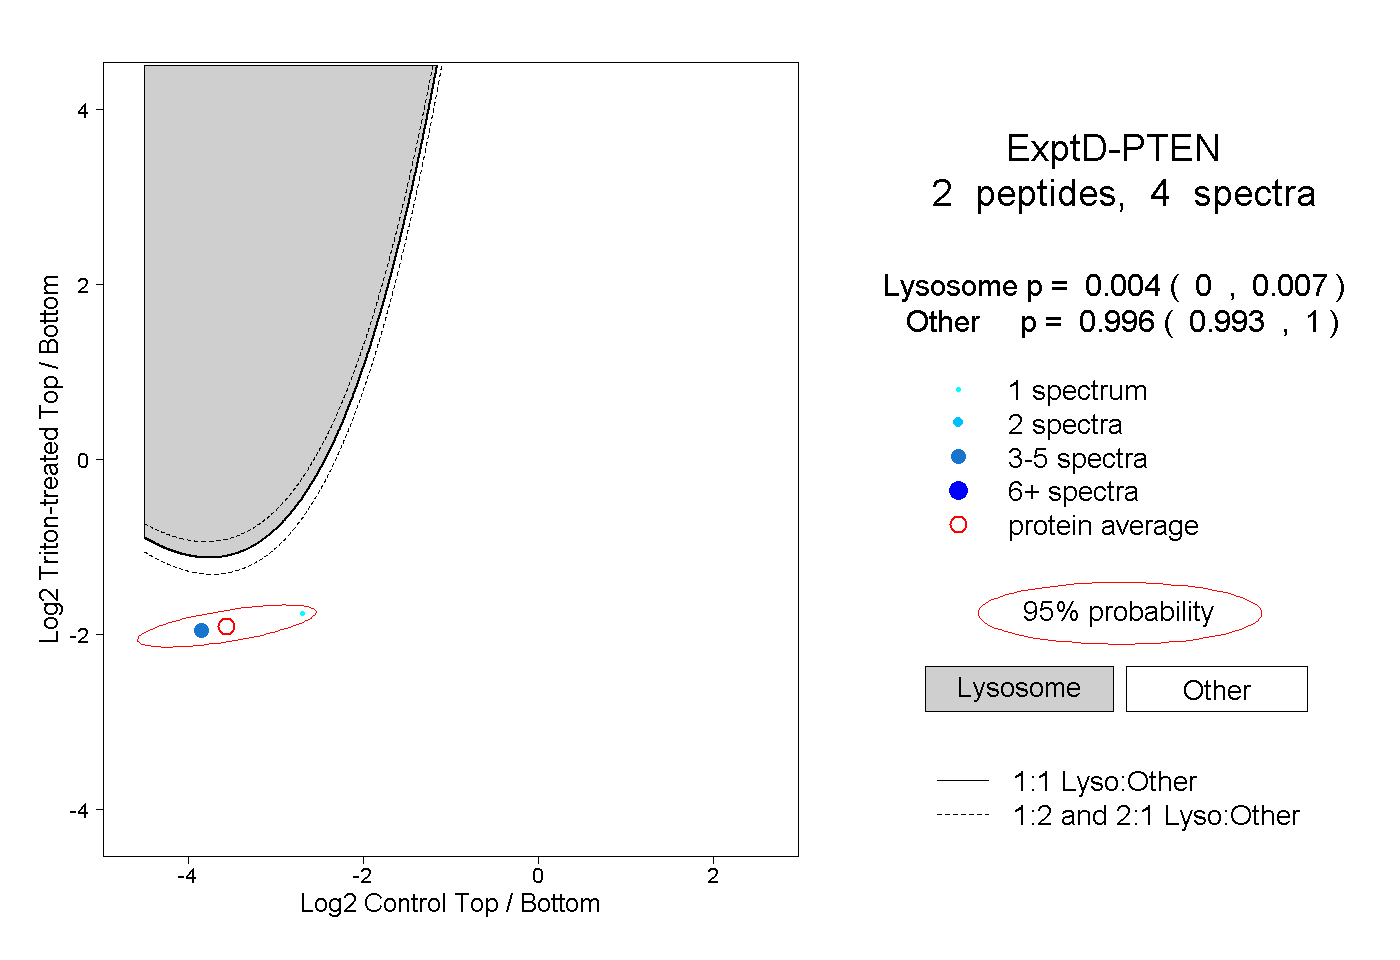
0.000 | 0.007
0.993 | 1.000