PTEN
[ENSRNOP00000028143]
Main page
| | | Plot |
Mito |
Lyso |
|
Perox |
ER |
Golgi |
PM |
Cytosol |
Nucleus |
|
| Expt A |
 5
5
peptides |
6
spectra |
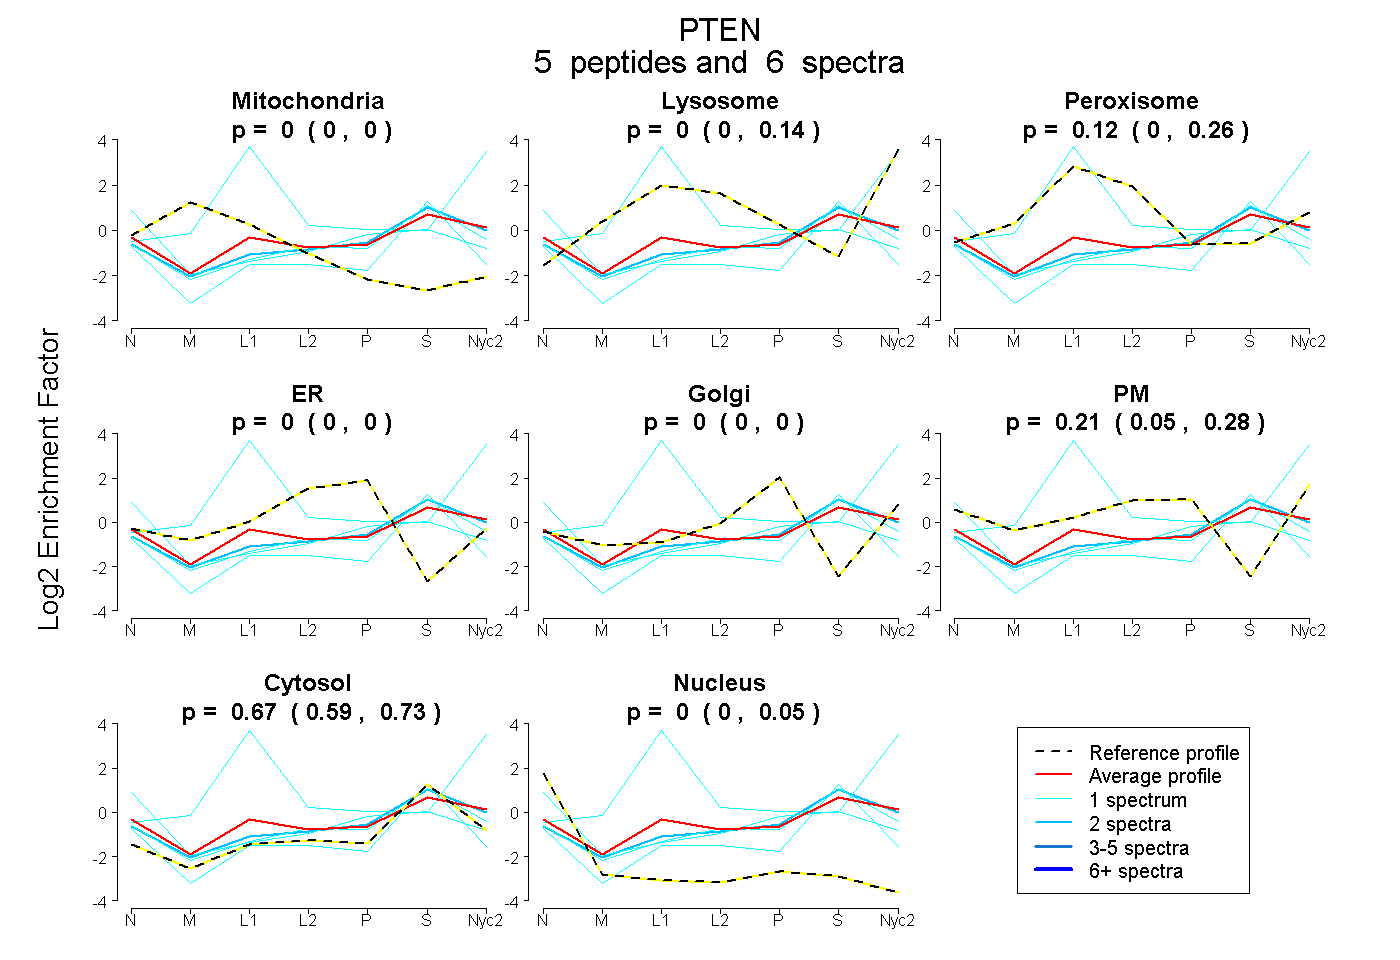 |
0.000
0.000 | 0.000 |
0.000
0.000 | 0.143 |
|
0.117
0.000 | 0.263 |
0.000
0.000 | 0.000 |
0.000
0.000 | 0.000 |
0.210
0.048 | 0.276 |
0.673
0.586 | 0.726 |
0.000
0.000 | 0.046 |
|
| | | Plot |
Mito |
|
Lyso or Perox |
|
ER |
Golgi |
PM |
Cytosol |
Nucleus |
|
| Expt B |
1
peptide |
1
spectrum |
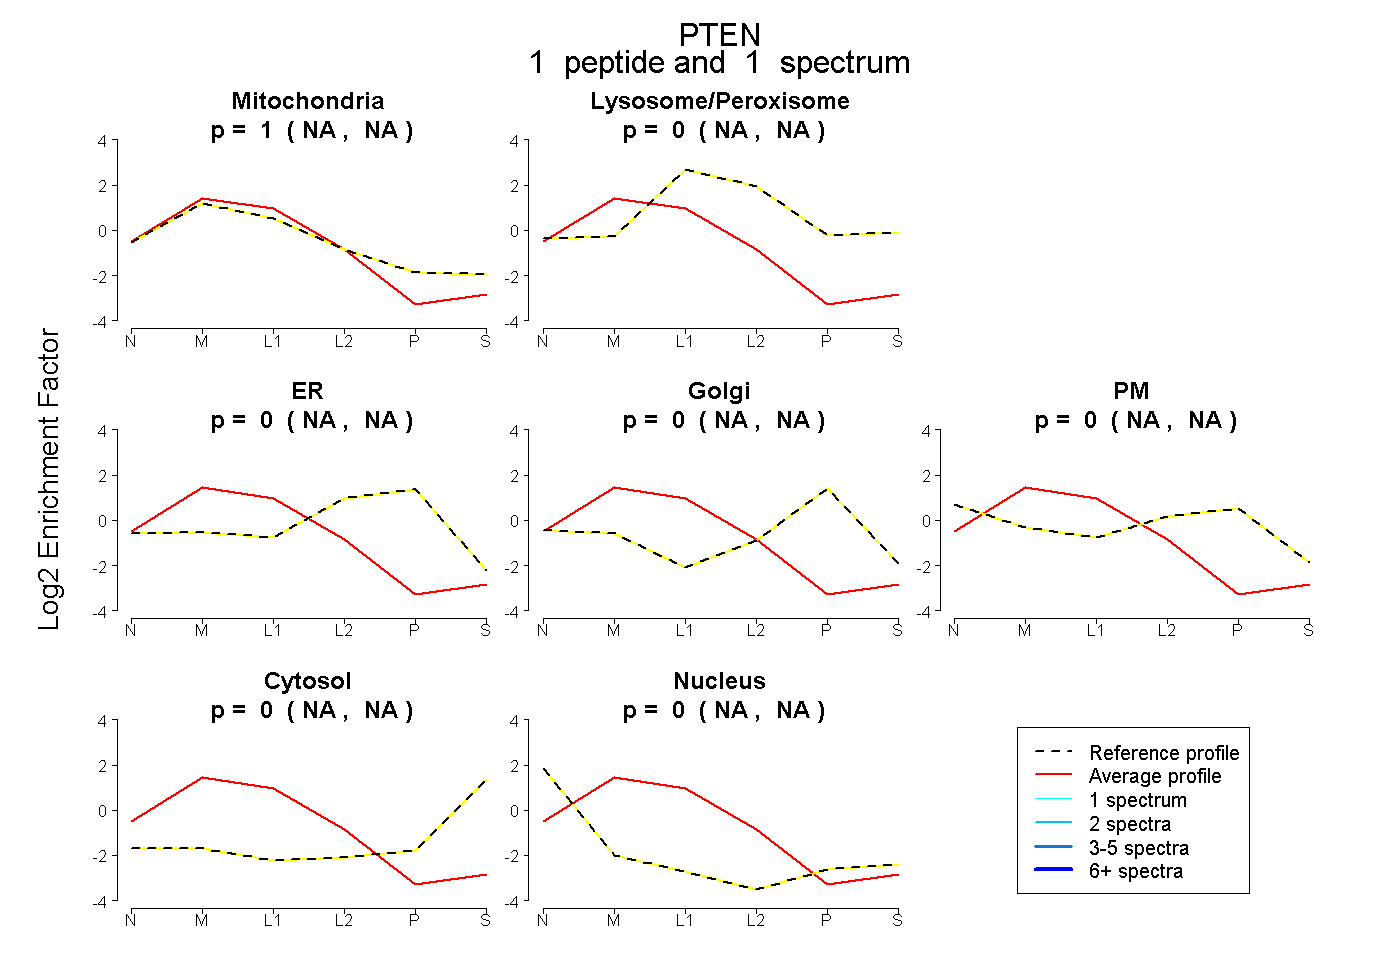 |
1.000
NA | NA |
|
0.000
NA | NA |
|
0.000
NA | NA |
0.000
NA | NA |
0.000
NA | NA |
0.000
NA | NA |
0.000
NA | NA |
|
| | | Plot |
|
Lyso |
|
|
|
|
|
|
|
Other |
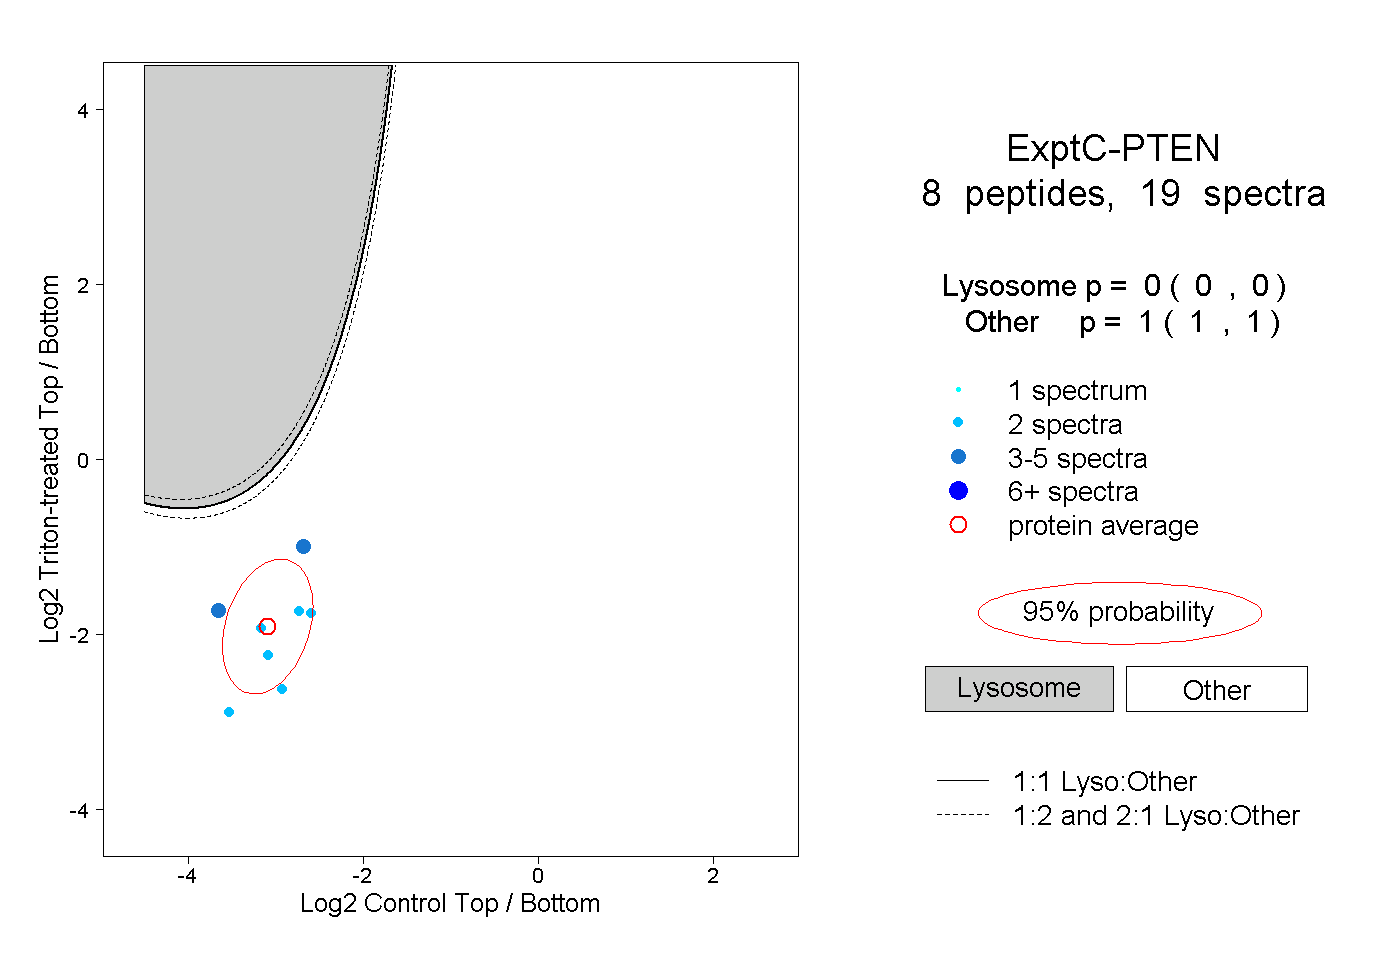
| Expt C |
8
peptides |
19
spectra |
 |
|
0.000
0.000 | 0.000 |
|
|
|
|
|
|
|
1.000
1.000 | 1.000 |
| 4 spectra, TAIIK |
|
0.000 |
|
|
|
|
|
|
|
1.000 |
| 2 spectra, IYNLCAER |
|
0.000 |
|
|
|
|
|
|
|
1.000 |
| 2 spectra, VEFFHK |
|
0.000 |
|
|
|
|
|
|
|
1.000 |
| 2 spectra, HYDTAK |
|
0.000 |
|
|
|
|
|
|
|
1.000 |
| 2 spectra, YFSPNFK |
|
0.000 |
|
|
|
|
|
|
|
1.000 |
| 2 spectra, NNIDDVVR |
|
0.000 |
|
|
|
|
|
|
|
1.000 |
| 3 spectra, GVTIPSQR |
|
0.000 |
|
|
|
|
|
|
|
1.000 |
| 2 spectra, LEGVYR |
|
0.000 |
|
|
|
|
|
|
|
1.000 |
| | | Plot |
|
Lyso |
|
|
|
|
|
|
|
Other |
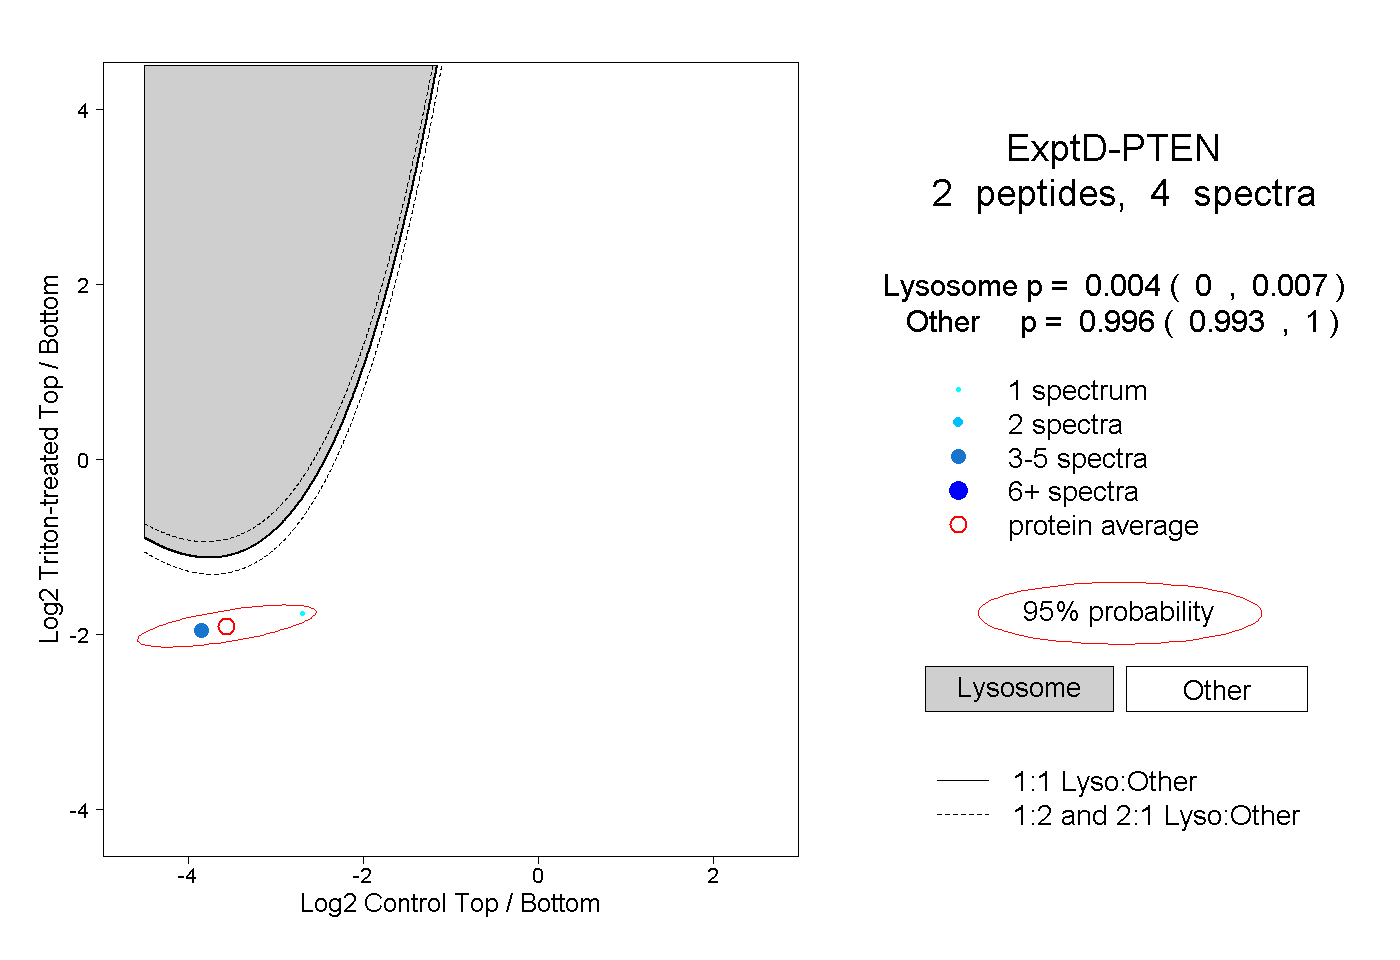
| Expt D |
2
peptides |
4
spectra |
 |
|
0.004
0.000 | 0.007 |
|
|
|
|
|
|
|
0.996
0.993 | 1.000 |