 5
5peptides
spectra
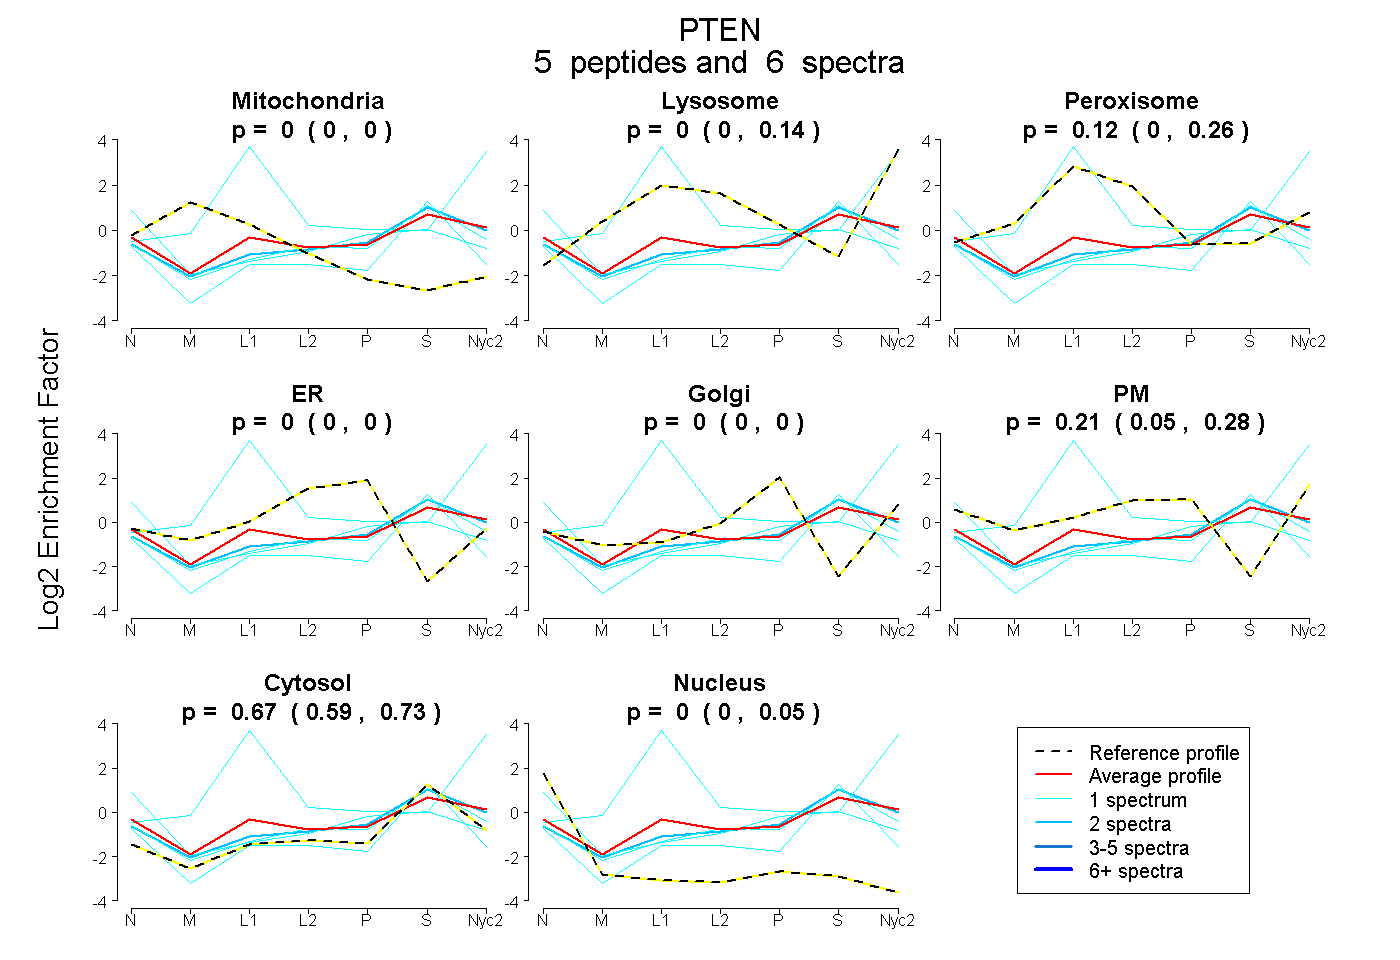
0.000 | 0.000
0.000 | 0.143
0.000 | 0.263
0.000 | 0.000
0.000 | 0.000
0.048 | 0.276
0.586 | 0.726
0.000 | 0.046
| Plot | Mito | Lyso | Perox | ER | Golgi | PM | Cytosol | Nucleus | |||||
| Expt A |
5 peptides |
6 spectra |
|
0.000 0.000 | 0.000 |
0.000 0.000 | 0.143 |
0.117 0.000 | 0.263 |
0.000 0.000 | 0.000 |
0.000 0.000 | 0.000 |
0.210 0.048 | 0.276 |
0.673 0.586 | 0.726 |
0.000 0.000 | 0.046 |
| 1 spectrum, TAIIK | 0.000 | 0.697 | 0.303 | 0.000 | 0.000 | 0.000 | 0.000 | 0.000 | ||
| 1 spectrum, AQEALDFYGEVR | 0.000 | 0.000 | 0.000 | 0.000 | 0.000 | 0.000 | 0.876 | 0.124 | ||
| 2 spectra, GVTIPSQR | 0.000 | 0.019 | 0.000 | 0.000 | 0.000 | 0.197 | 0.783 | 0.000 | ||
| 1 spectrum, VEFFHK | 0.000 | 0.000 | 0.000 | 0.000 | 0.000 | 0.166 | 0.834 | 0.000 | ||
| 1 spectrum, HYDTAK | 0.000 | 0.000 | 0.000 | 0.000 | 0.005 | 0.312 | 0.479 | 0.204 |
| Plot | Mito | Lyso or Perox | ER | Golgi | PM | Cytosol | Nucleus | ||||||
| Expt B |
1 peptide |
1 spectrum |
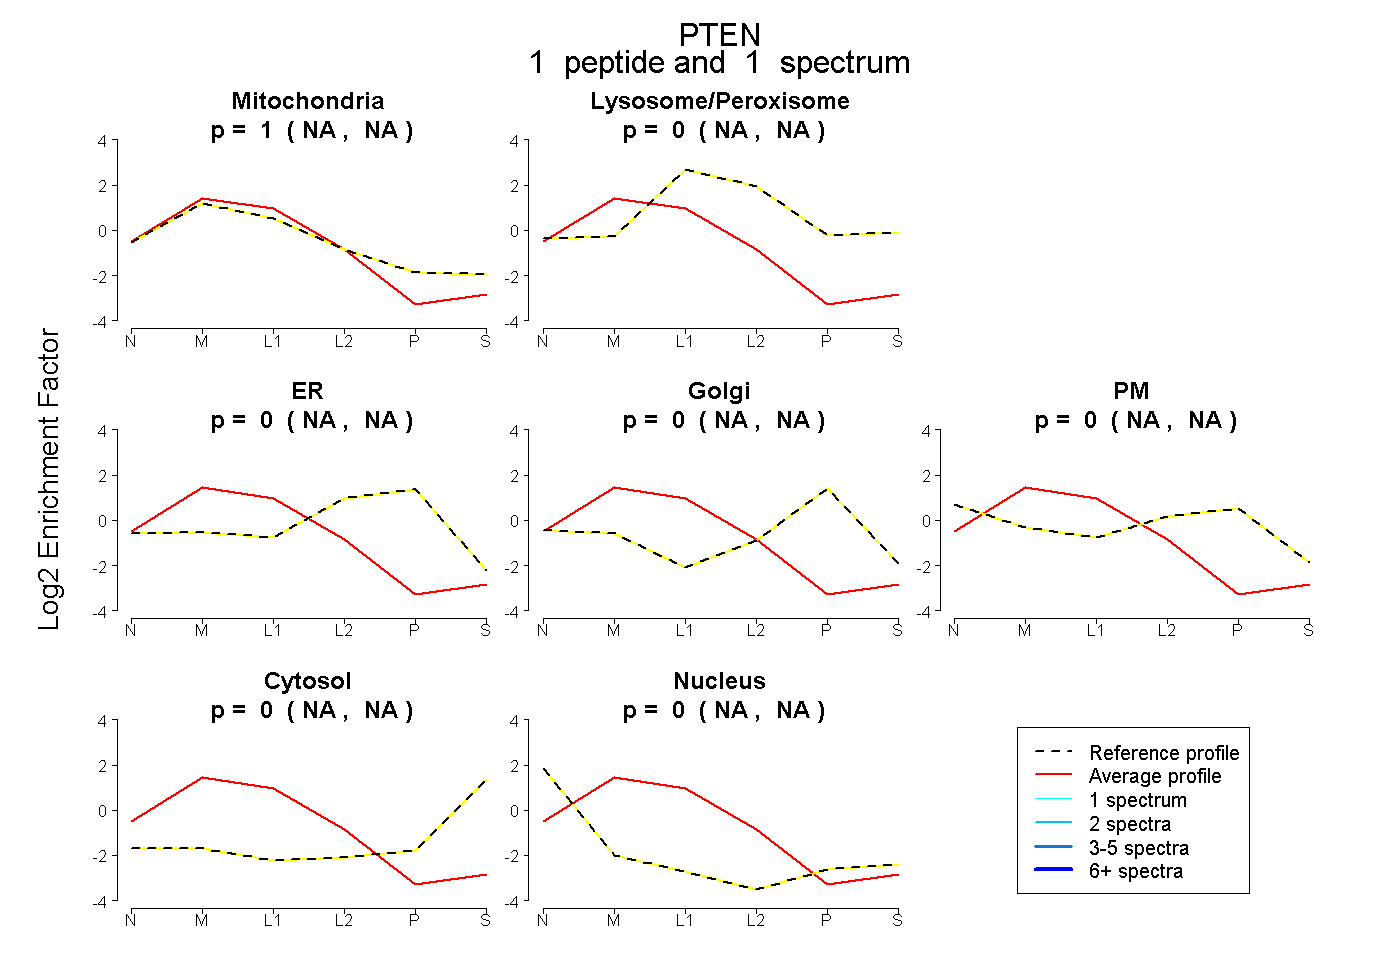 |
1.000 NA | NA |
0.000 NA | NA |
0.000 NA | NA |
0.000 NA | NA |
0.000 NA | NA |
0.000 NA | NA |
0.000 NA | NA |
|||
| Plot | Lyso | Other | |||||||||||
| Expt C |
8 peptides |
19 spectra |
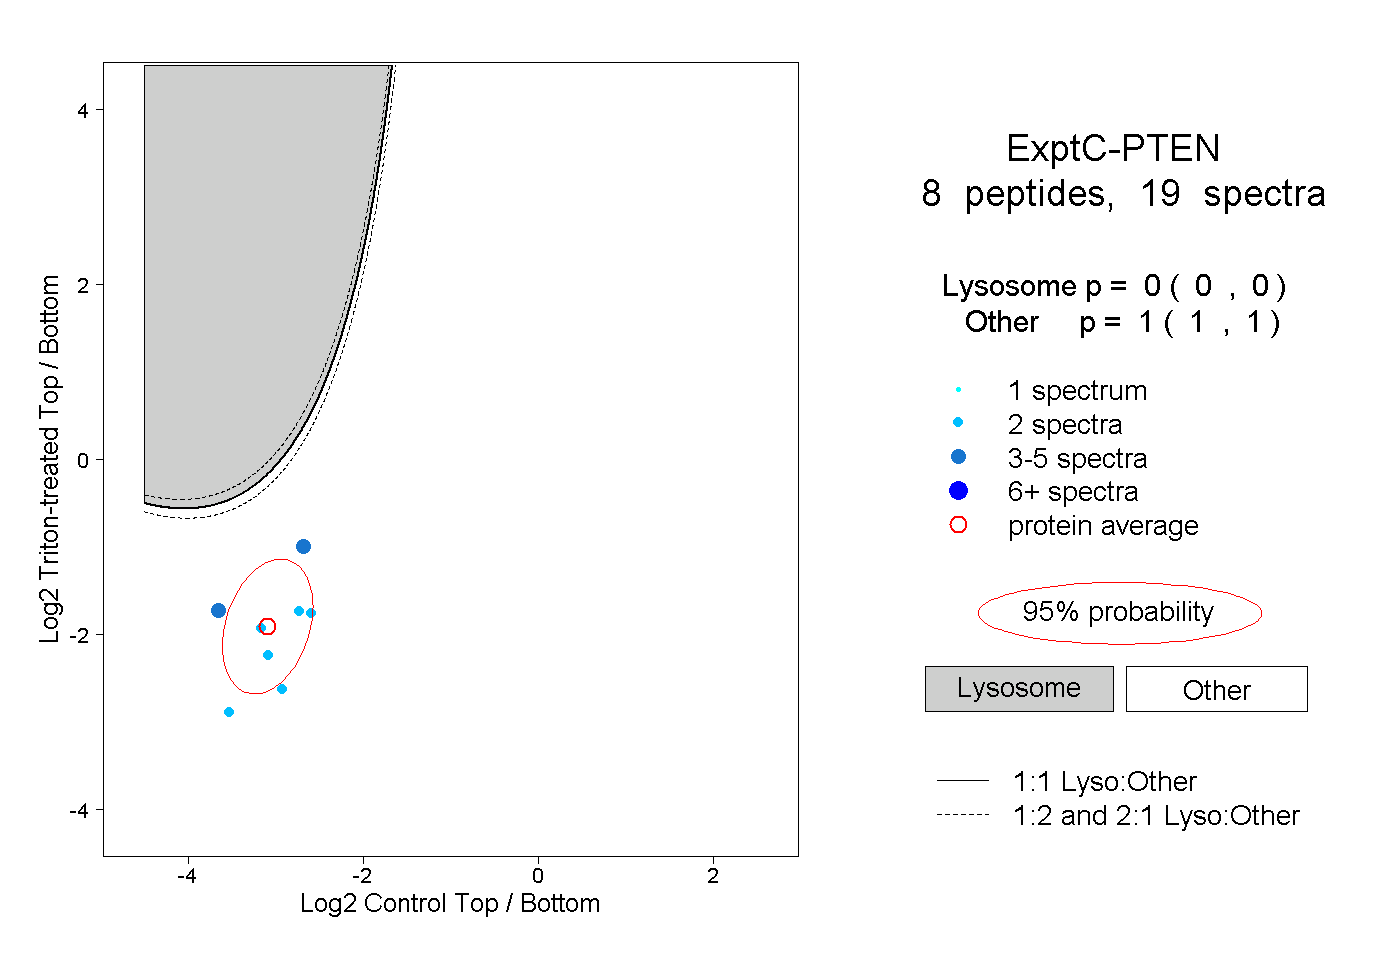 |
0.000 0.000 | 0.000 |
1.000 1.000 | 1.000 |
||||||||
| Plot | Lyso | Other | |||||||||||
| Expt D |
2 peptides |
4 spectra |
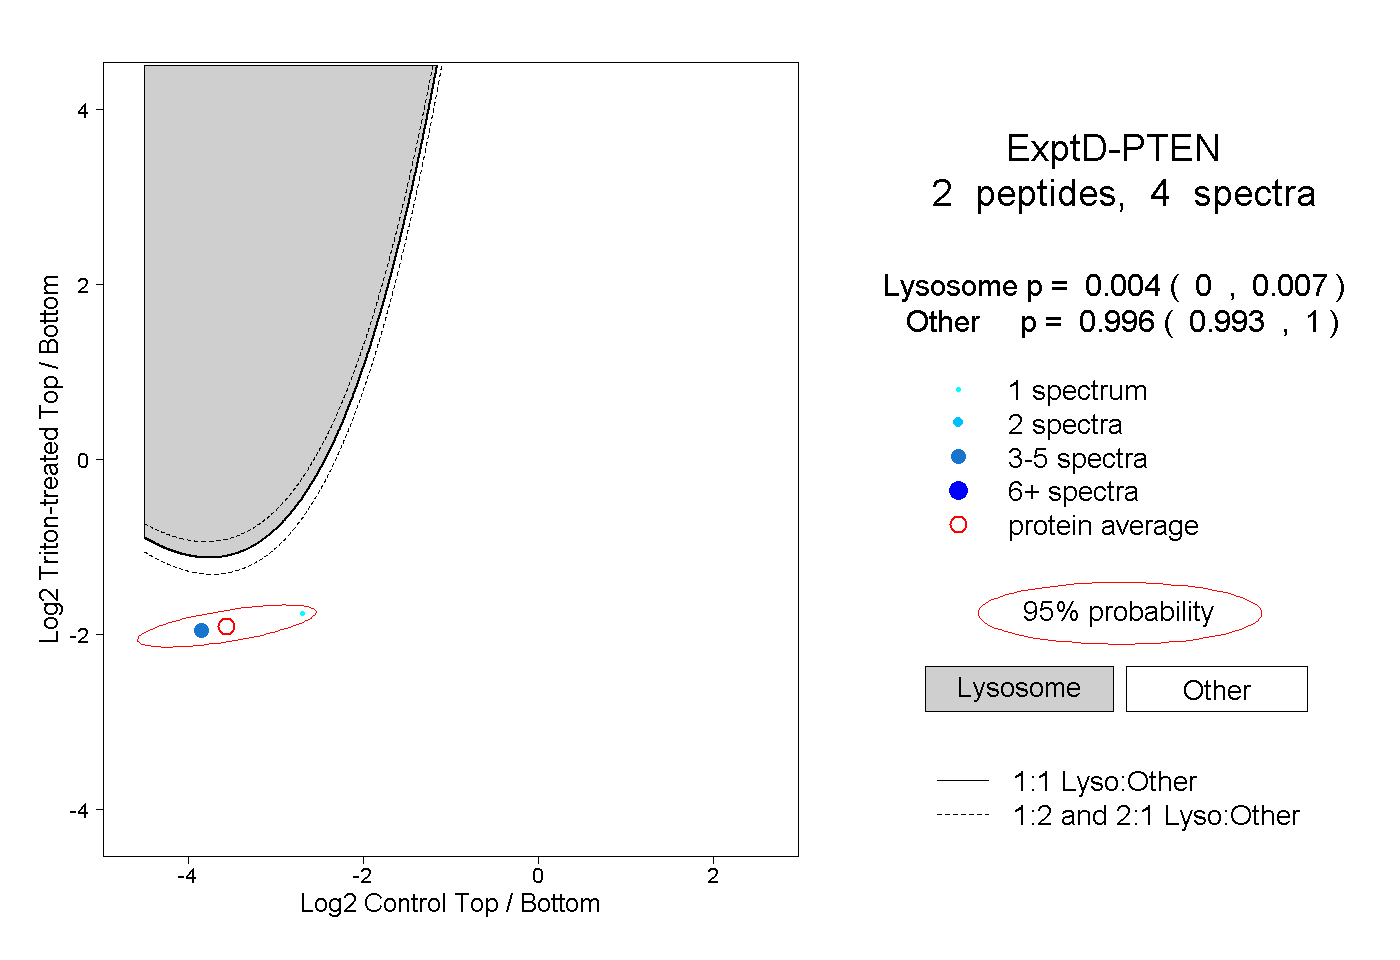 |
0.004 0.000 | 0.007 |
0.996 0.993 | 1.000 |