 9
9peptides
spectra
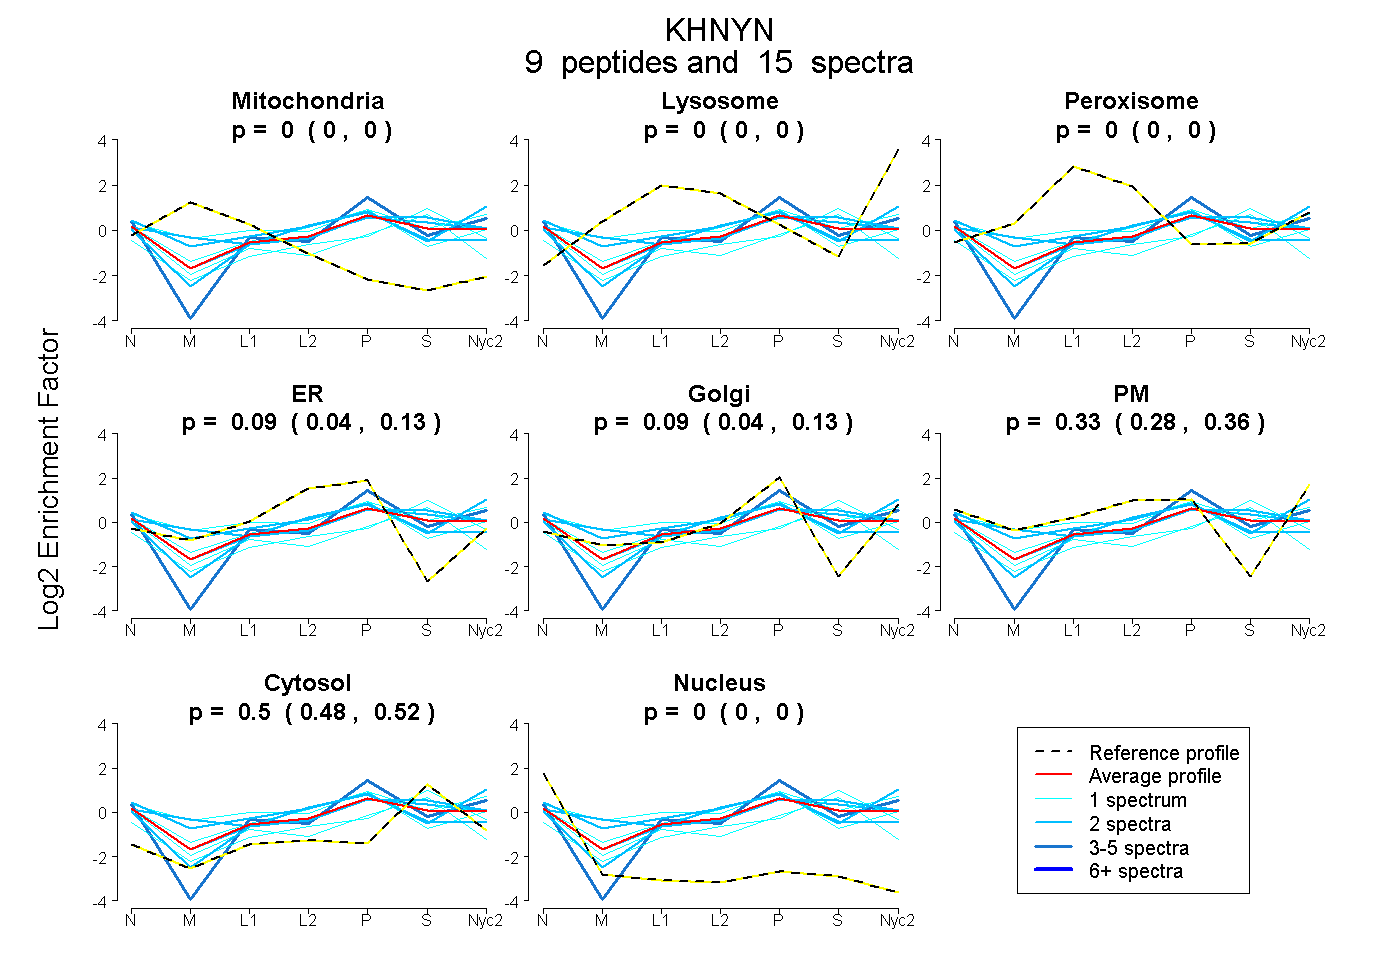
0.000 | 0.000
0.000 | 0.000
0.000 | 0.001
0.036 | 0.128
0.041 | 0.128
0.277 | 0.365
0.482 | 0.516
0.000 | 0.000
5peptides
spectra
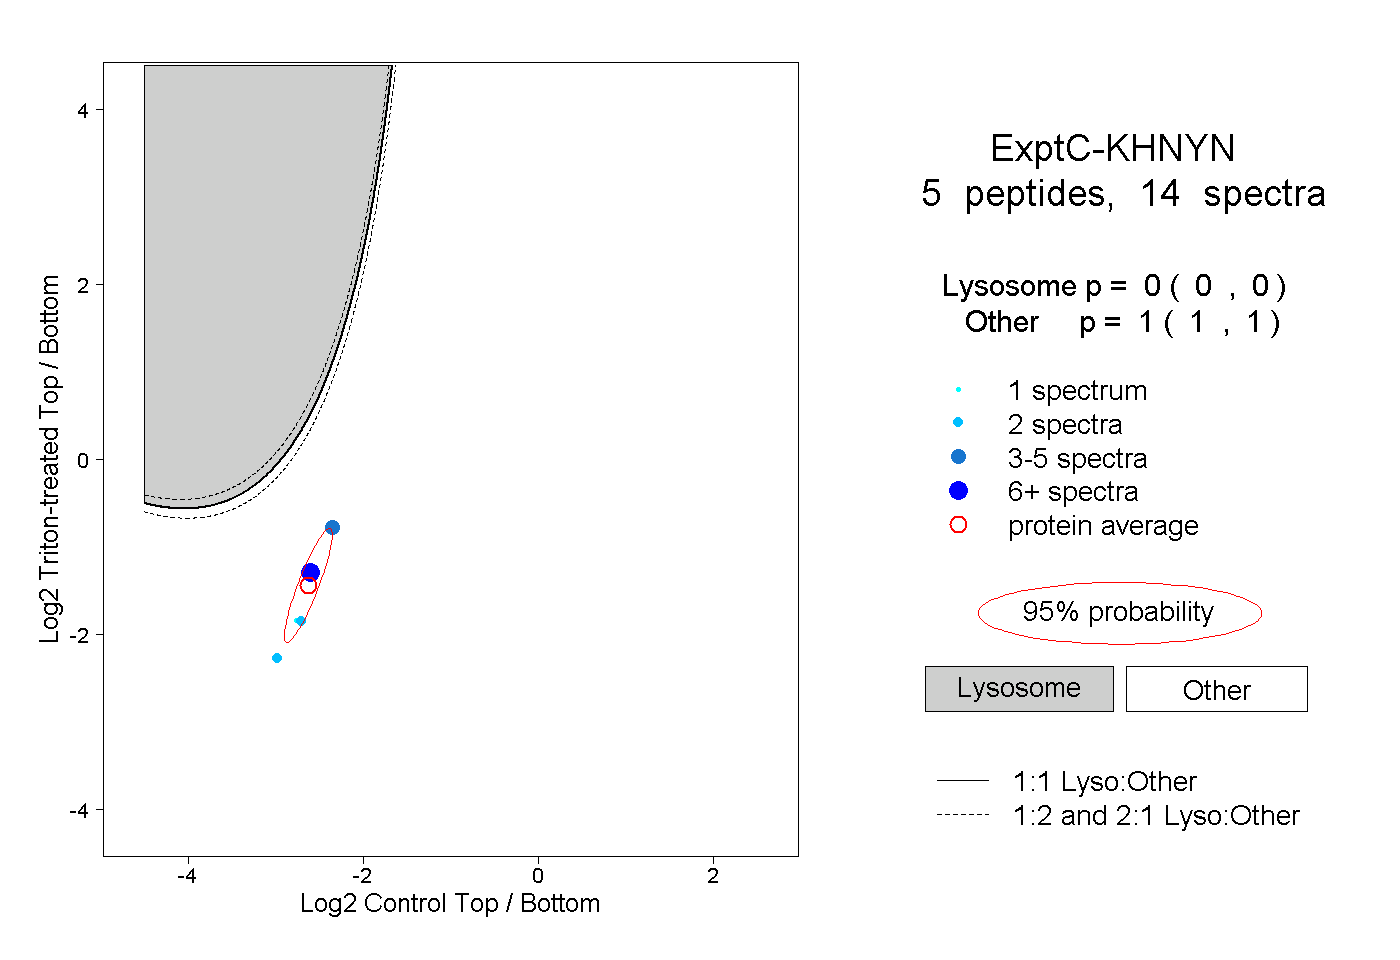
0.000 | 0.000
1.000 | 1.000
2peptides
spectra
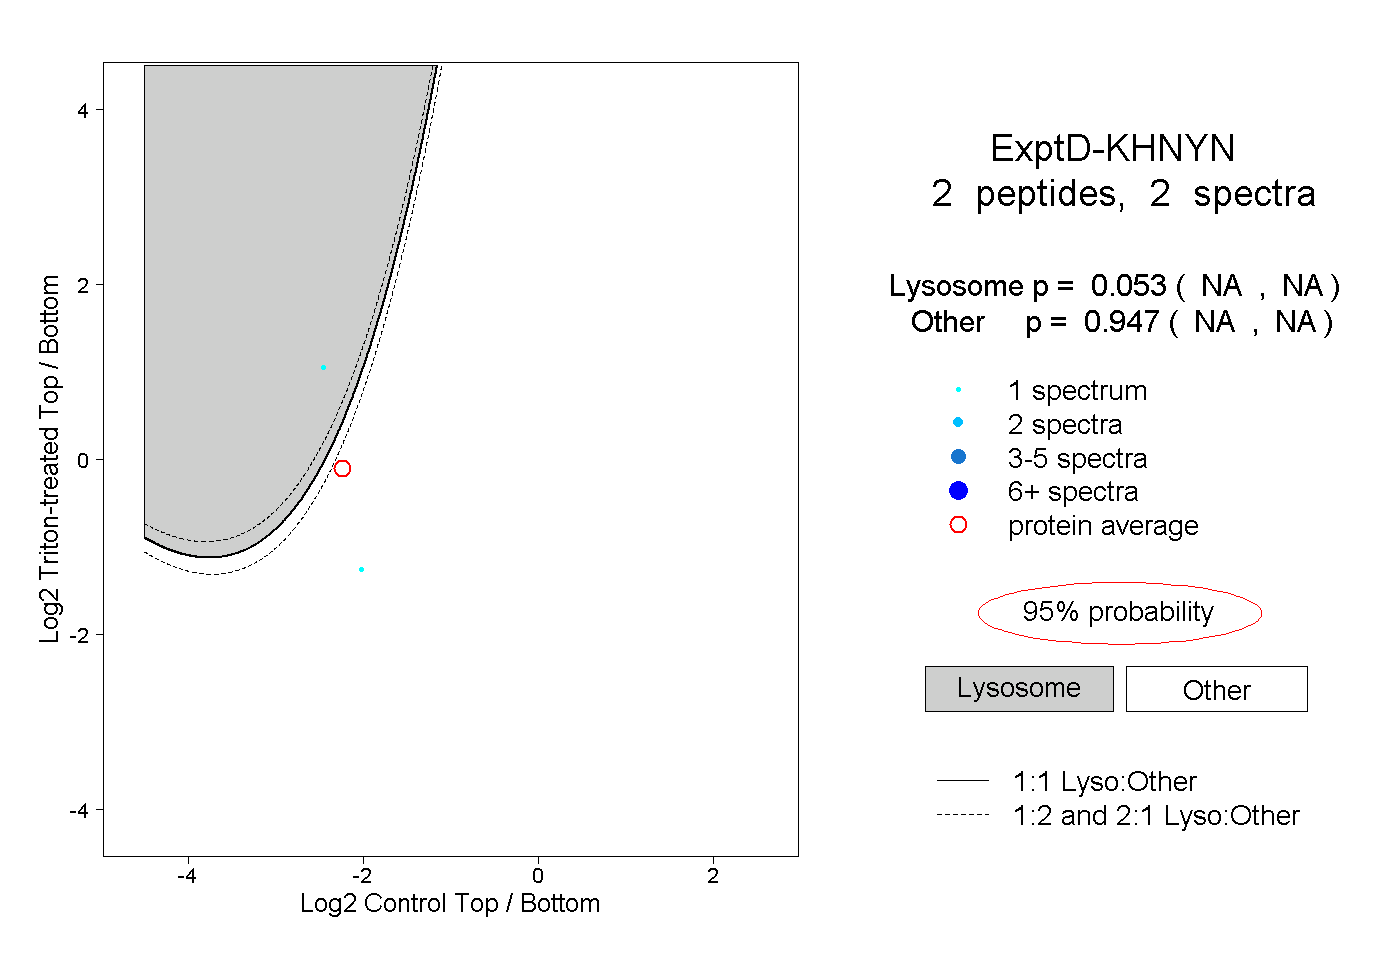
NA | NA
NA | NA