 9
9peptides
spectra
0.000 | 0.000
0.000 | 0.000
0.000 | 0.001
0.036 | 0.128
0.041 | 0.128
0.277 | 0.365
0.482 | 0.516
0.000 | 0.000
5peptides
spectra
0.000 | 0.000
1.000 | 1.000
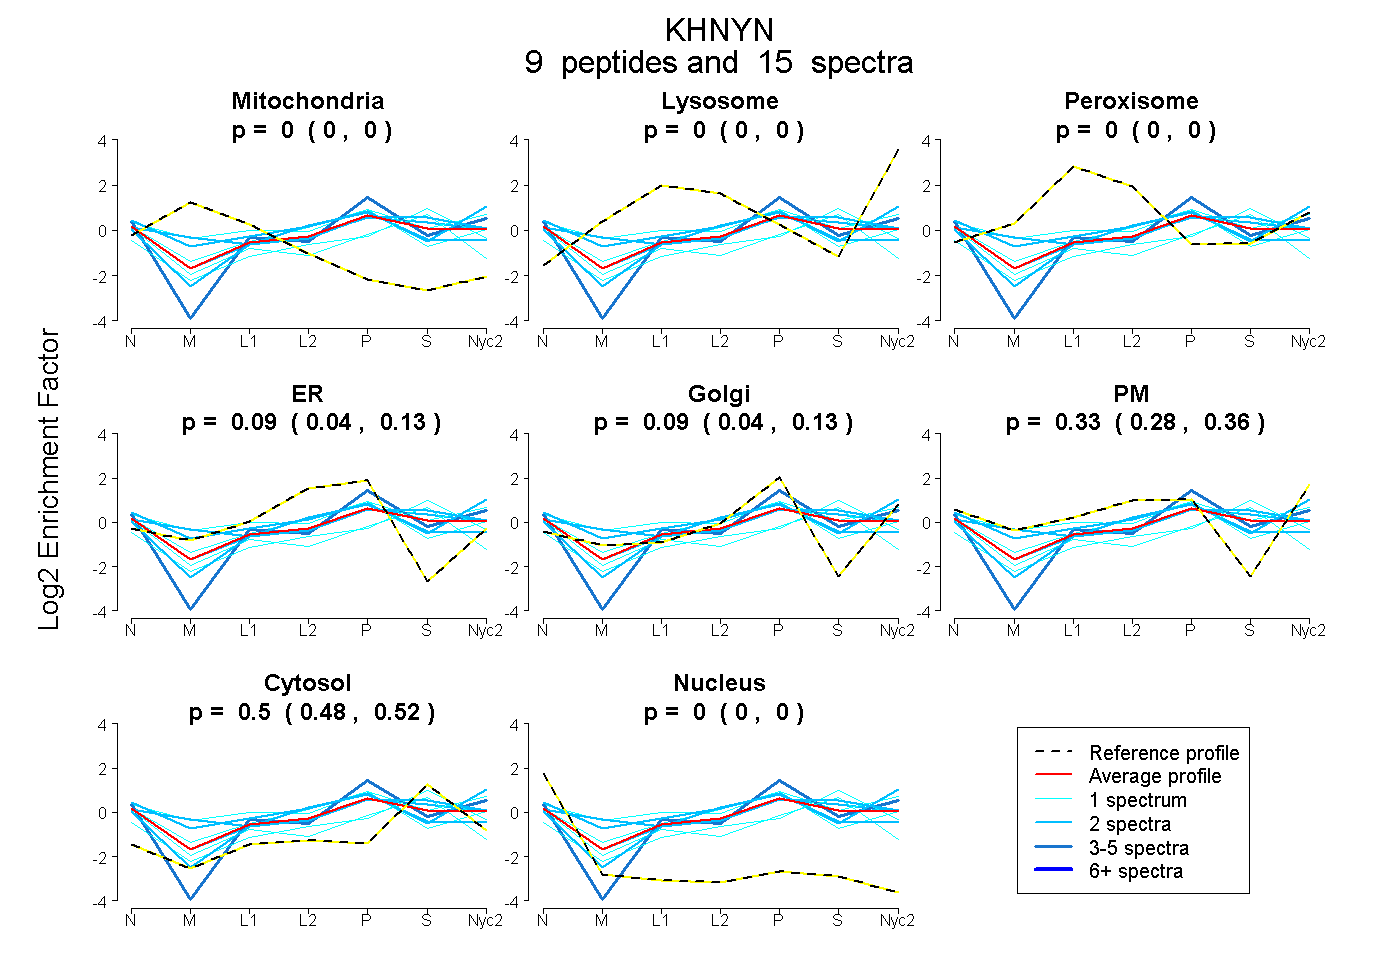
| Plot | Mito | Lyso | Perox | ER | Golgi | PM | Cytosol | Nucleus | |||||
| Expt A |
9 peptides |
15 spectra |
|
0.000 0.000 | 0.000 |
0.000 0.000 | 0.000 |
0.000 0.000 | 0.001 |
0.087 0.036 | 0.128 |
0.087 0.041 | 0.128 |
0.325 0.277 | 0.365 |
0.500 0.482 | 0.516 |
0.000 0.000 | 0.000 |
||
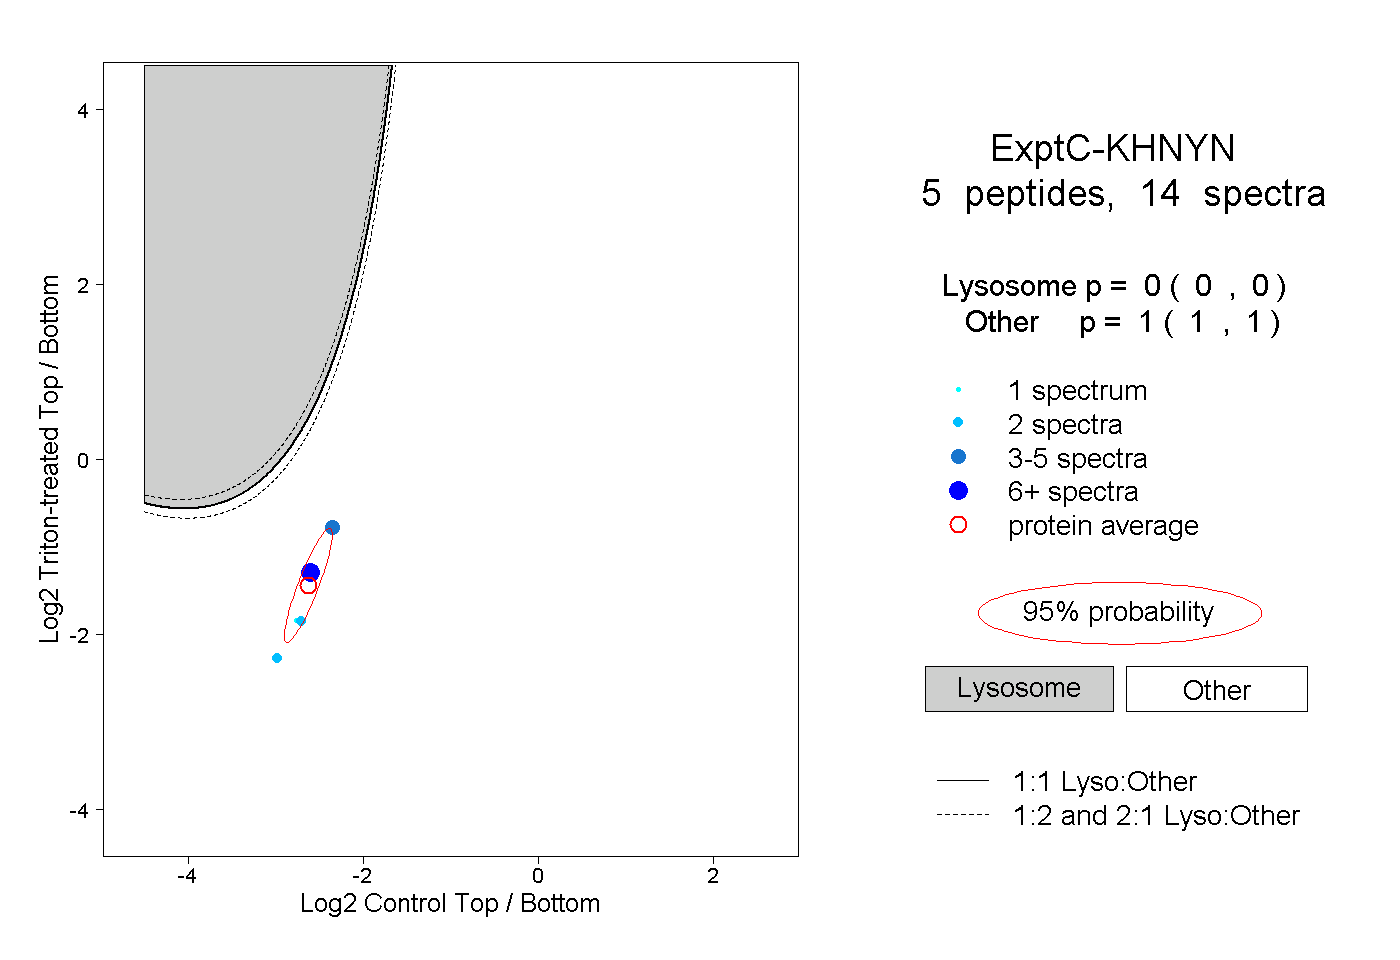
| Plot | Lyso | Other | |||||||||||
| Expt C |
5 peptides |
14 spectra |
|
0.000 0.000 | 0.000 |
1.000 1.000 | 1.000 |
| 2 spectra, SQQPSK | 0.000 | 1.000 | ||||||||
| 2 spectra, LAEETDGIIVSNDQFR | 0.000 | 1.000 | ||||||||
| 6 spectra, GGNLVTGTQR | 0.000 | 1.000 | ||||||||
| 1 spectrum, DFSALLQTR | 0.000 | 1.000 | ||||||||
| 3 spectra, VEELAQR | 0.000 | 1.000 |
| Plot | Lyso | Other | |||||||||||
| Expt D |
2 peptides |
2 spectra |
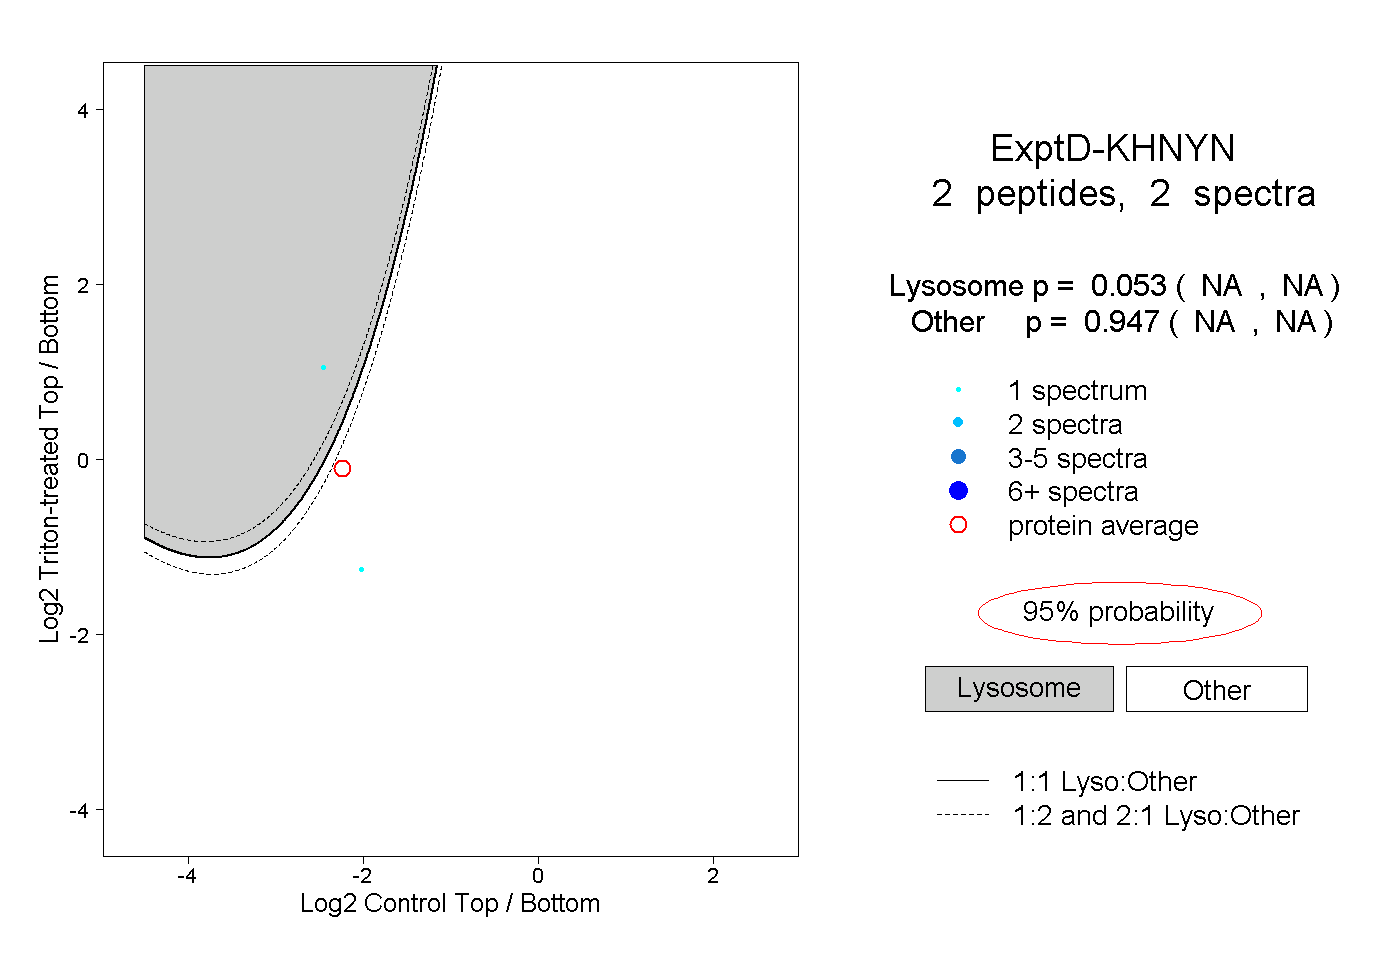 |
0.053 NA | NA |
0.947 NA | NA |