 13
13peptides
spectra
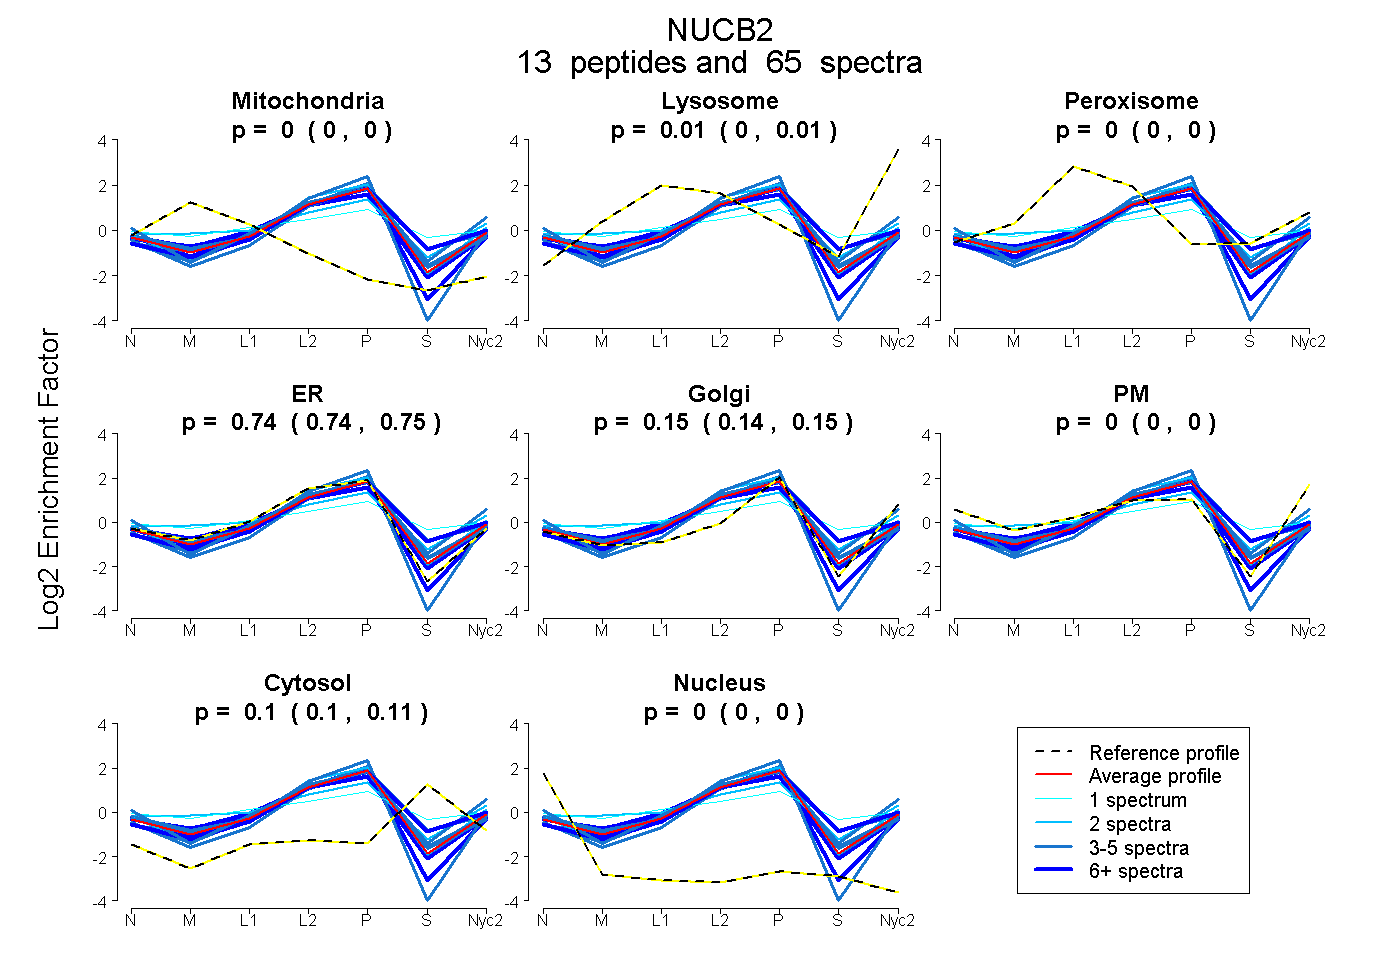
0.000 | 0.000
0.004 | 0.011
0.000 | 0.000
0.738 | 0.749
0.136 | 0.153
0.000 | 0.000
0.096 | 0.109
0.000 | 0.000
7peptides
spectra
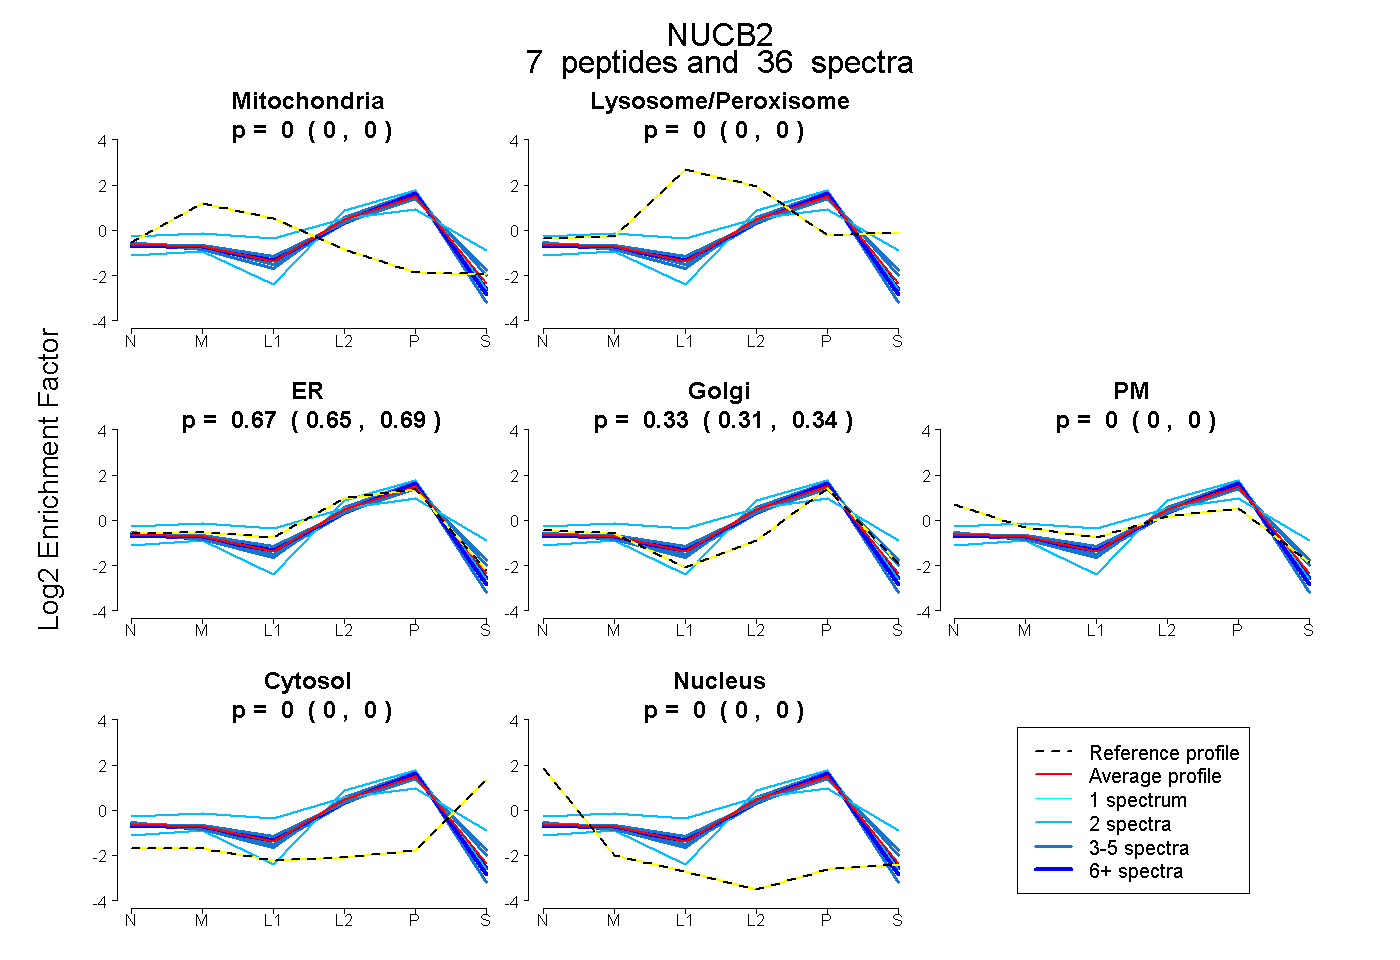
0.000 | 0.000
0.000 | 0.000
0.653 | 0.691
0.307 | 0.343
0.000 | 0.000
0.000 | 0.000
0.000 | 0.000
15peptides
spectra
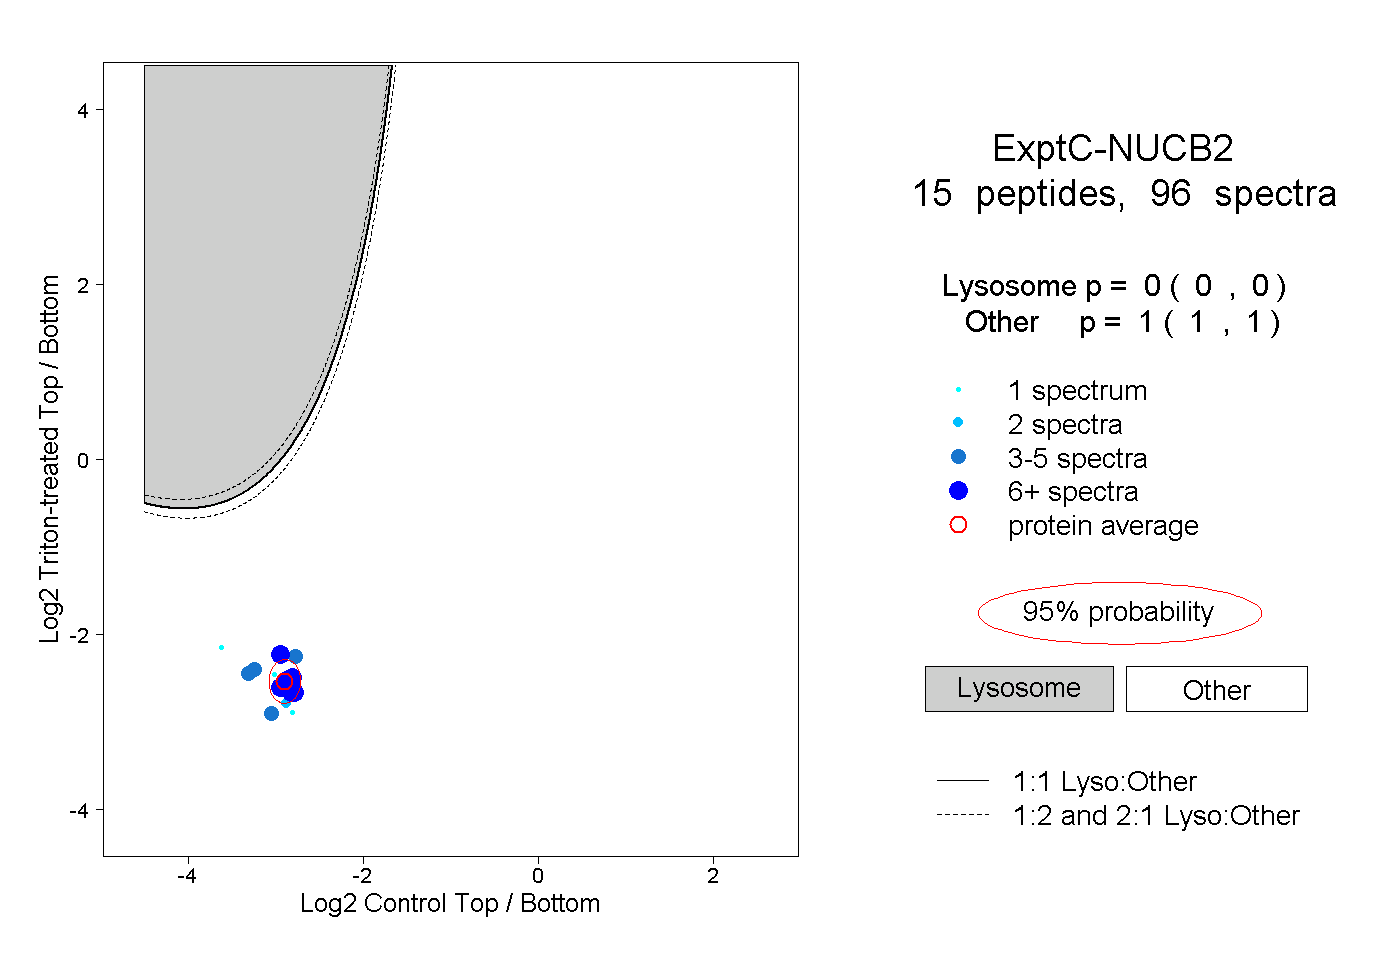
0.000 | 0.000
1.000 | 1.000
7peptides
spectra
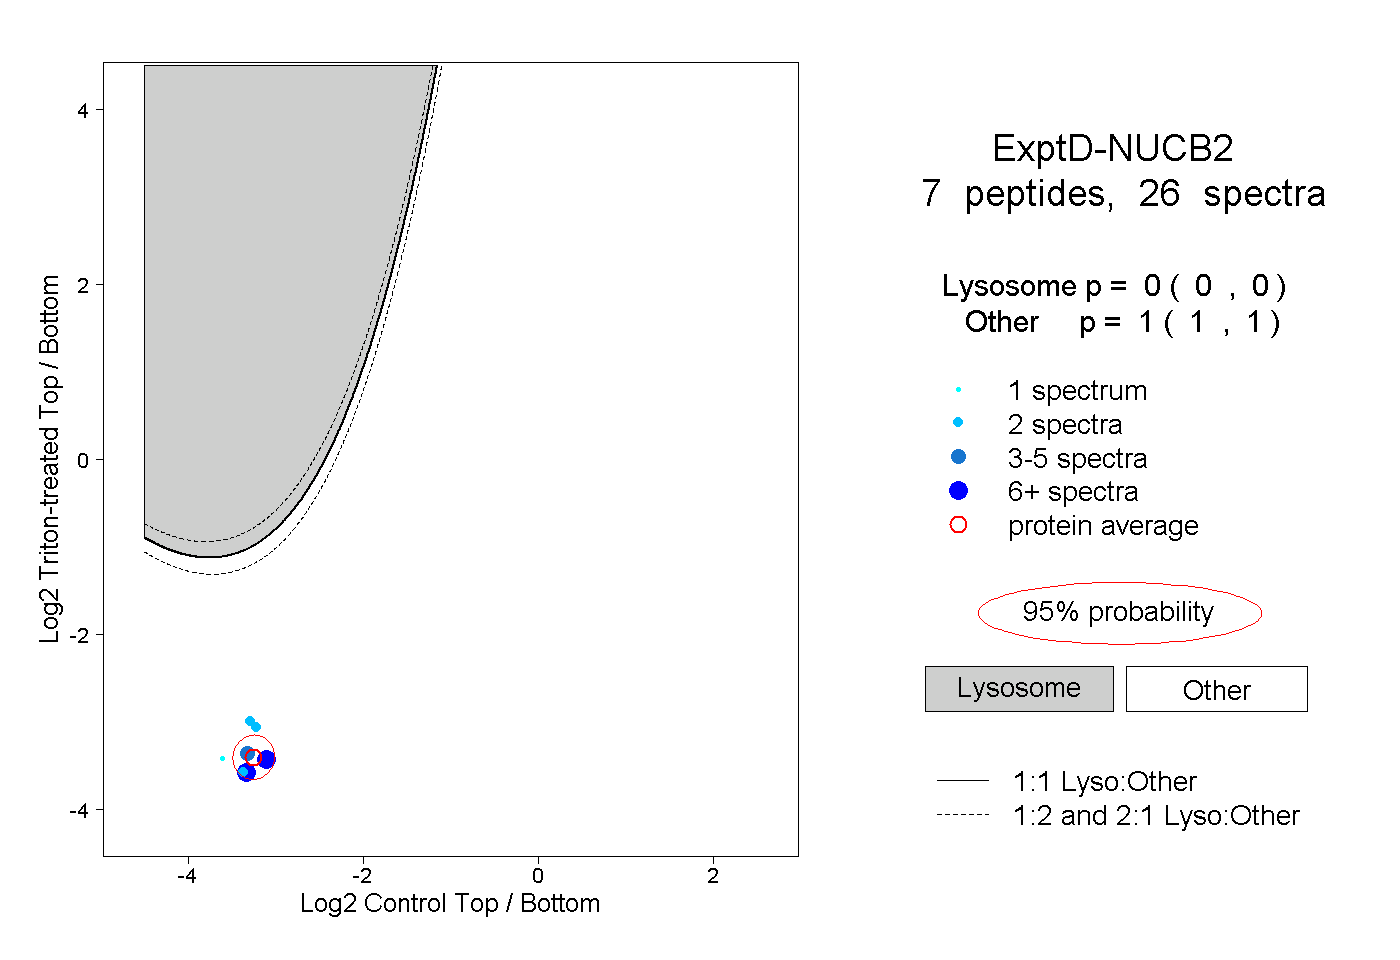
0.000 | 0.000
1.000 | 1.000