NUCB2
[ENSRNOP00000027753]
Main page
| | | Plot |
Mito |
Lyso |
|
Perox |
ER |
Golgi |
PM |
Cytosol |
Nucleus |
|
| Expt A |
 13
13
peptides |
65
spectra |
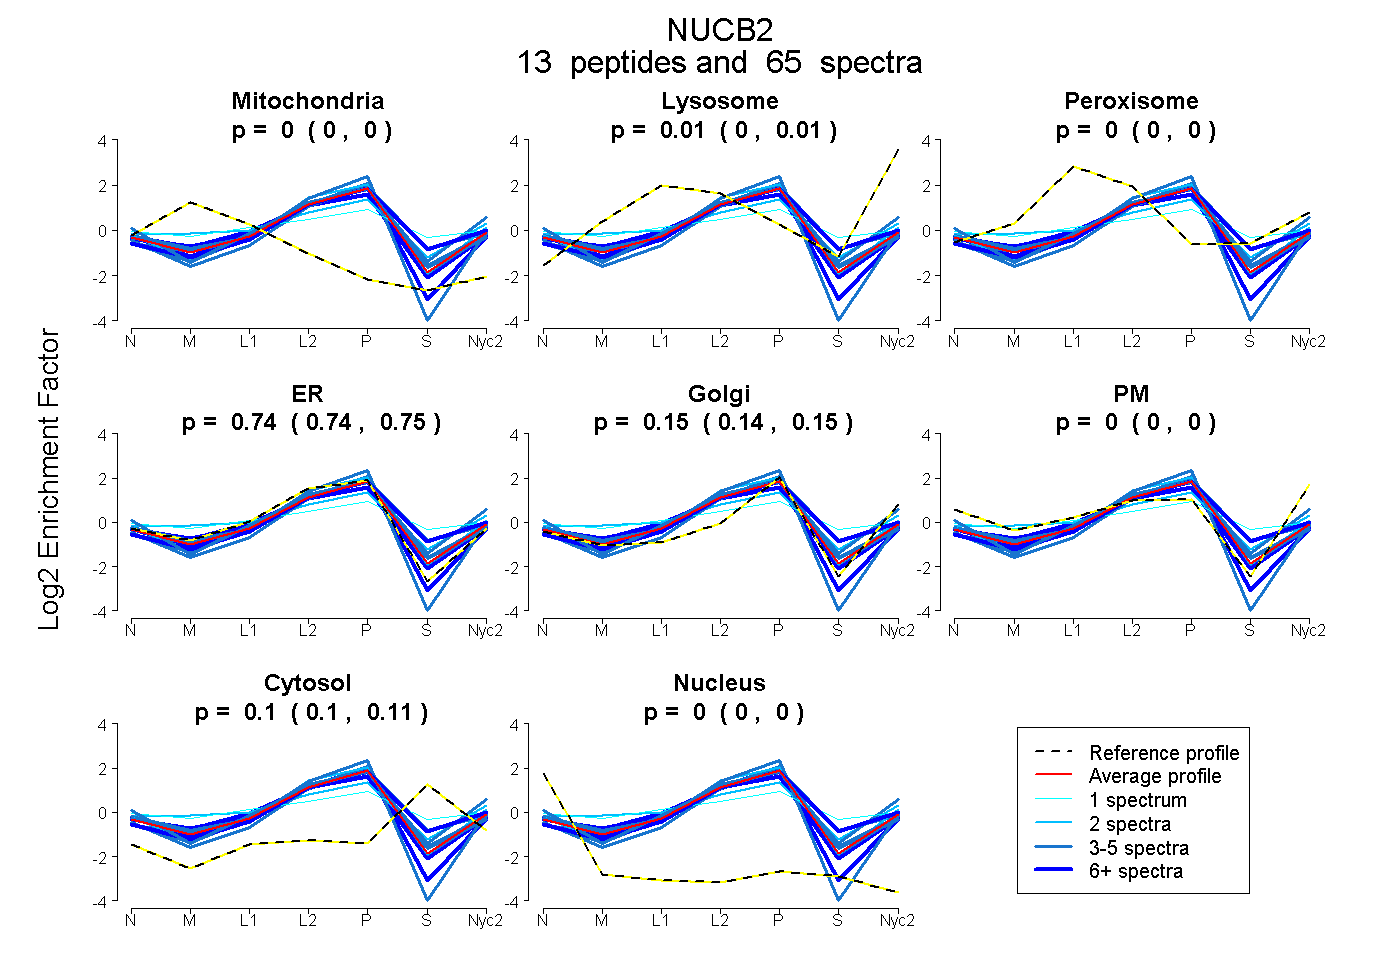 |
0.000
0.000 | 0.000 |
0.008
0.004 | 0.011 |
|
0.000
0.000 | 0.000 |
0.744
0.738 | 0.749 |
0.145
0.136 | 0.153 |
0.000
0.000 | 0.000 |
0.103
0.096 | 0.109 |
0.000
0.000 | 0.000 |
|
| | | Plot |
Mito |
|
Lyso or Perox |
|
ER |
Golgi |
PM |
Cytosol |
Nucleus |
|
| Expt B |
7
peptides |
36
spectra |
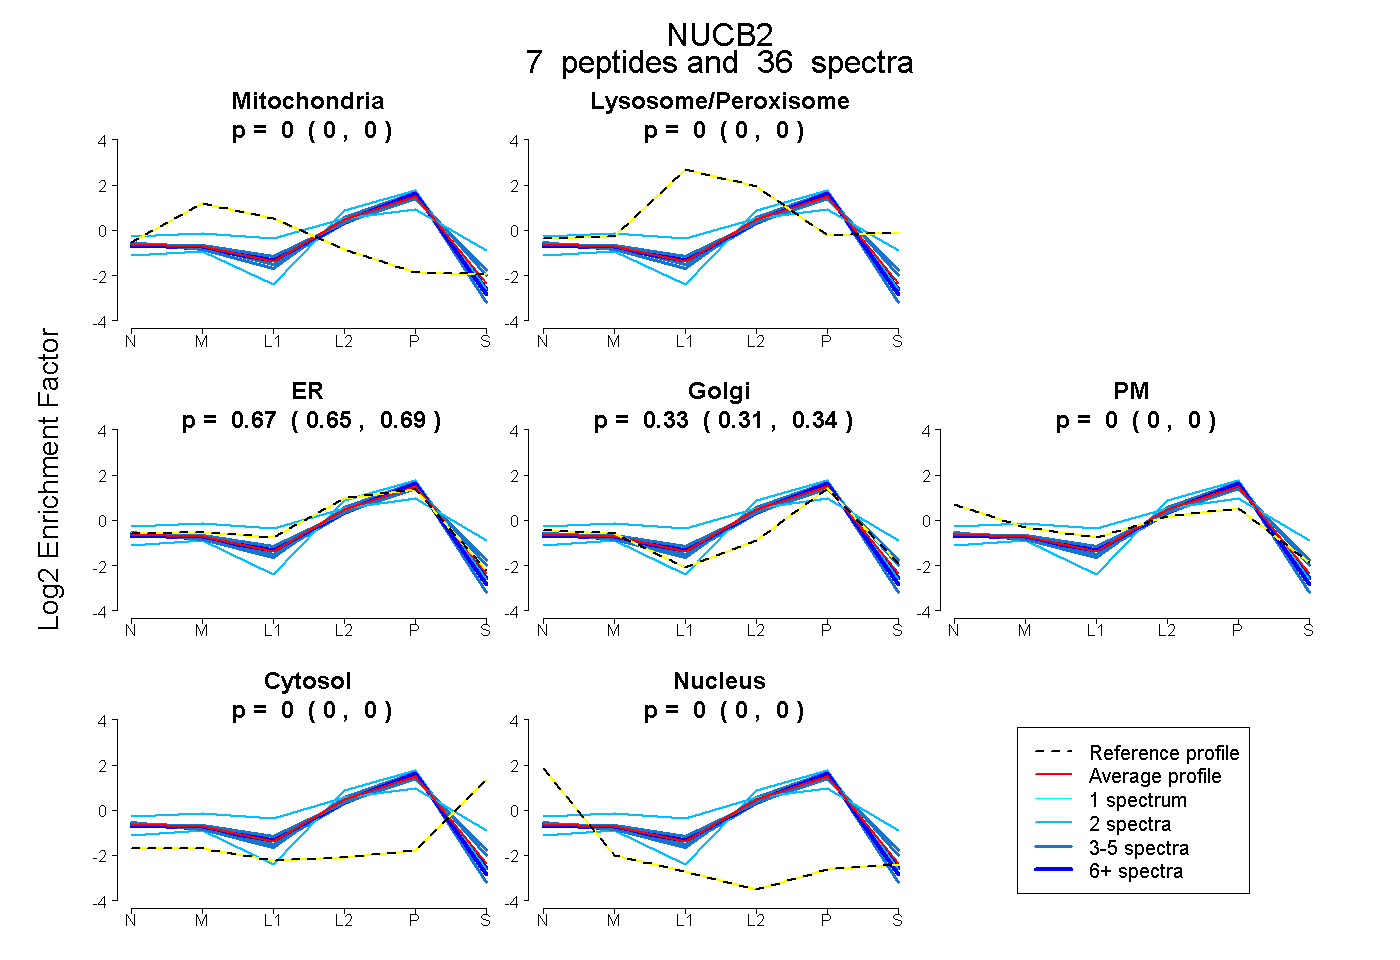 |
0.000
0.000 | 0.000 |
|
0.000
0.000 | 0.000 |
|
0.674
0.653 | 0.691 |
0.326
0.307 | 0.343 |
0.000
0.000 | 0.000 |
0.000
0.000 | 0.000 |
0.000
0.000 | 0.000 |
|
| 2 spectra, VHNVEPVESAR |
0.000 |
|
0.381 |
|
0.054 |
0.525 |
0.039 |
0.000 |
0.000 |
|
| 4 spectra, QVIEVLETDPHFR |
0.000 |
|
0.023 |
|
0.630 |
0.307 |
0.000 |
0.039 |
0.000 |
|
| 5 spectra, AATADLEQYDR |
0.000 |
|
0.000 |
|
0.559 |
0.441 |
0.000 |
0.000 |
0.000 |
|
| 13 spectra, LVTLEEFLR |
0.000 |
|
0.000 |
|
0.690 |
0.310 |
0.000 |
0.000 |
0.000 |
|
| 2 spectra, DLDMLIK |
0.000 |
|
0.000 |
|
0.586 |
0.414 |
0.000 |
0.000 |
0.000 |
|
| 6 spectra, ADIEEIR |
0.000 |
|
0.000 |
|
0.659 |
0.341 |
0.000 |
0.000 |
0.000 |
|
| 4 spectra, LSQELDLVSHK |
0.000 |
|
0.000 |
|
0.677 |
0.323 |
0.000 |
0.000 |
0.000 |
|
| | | Plot |
|
Lyso |
|
|
|
|
|
|
|
Other |
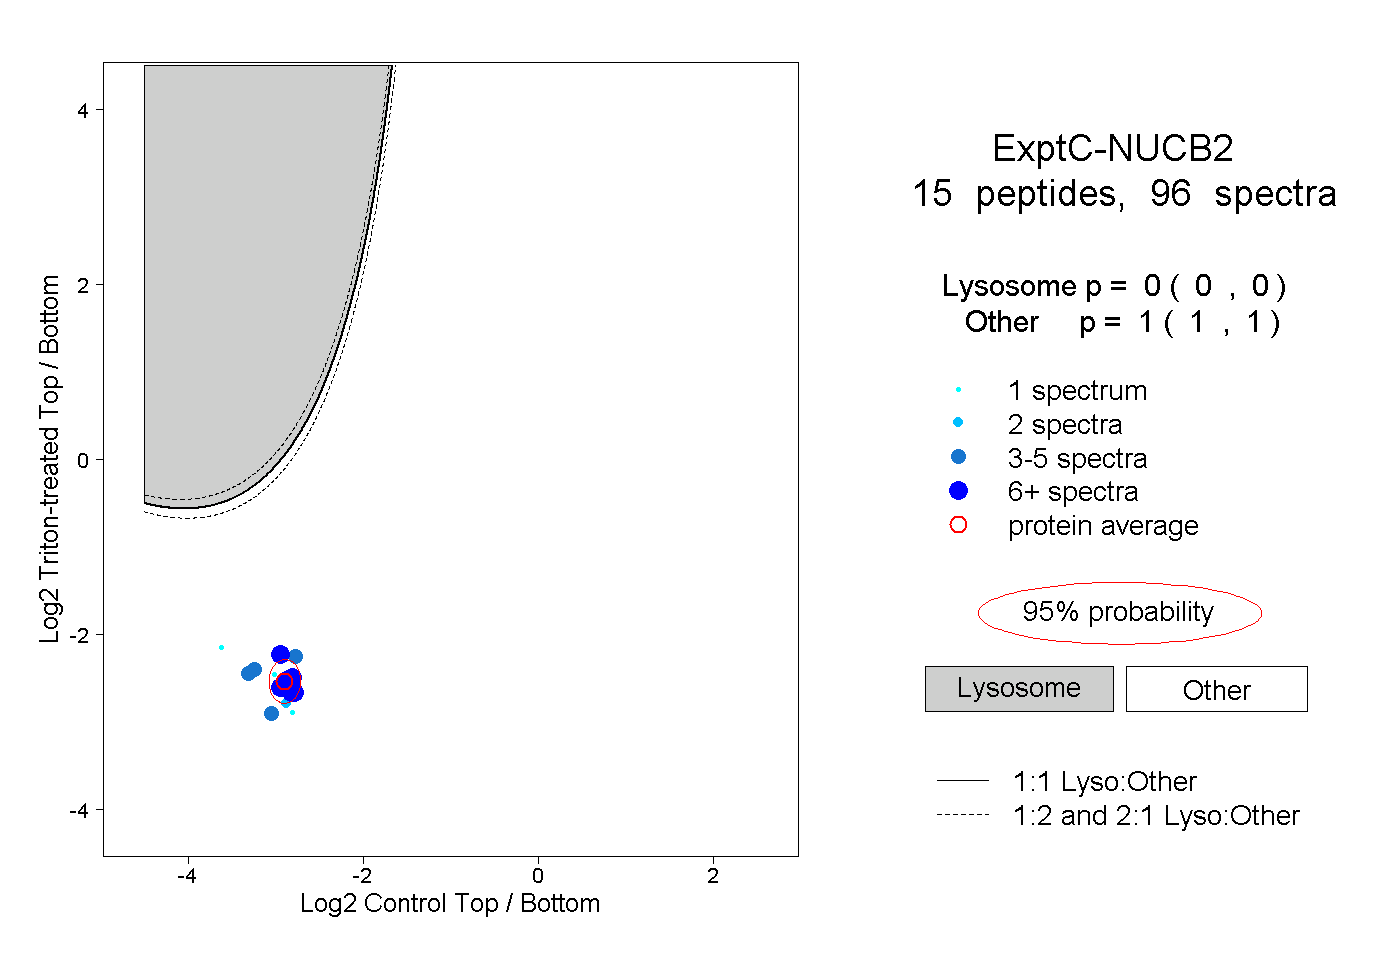
| Expt C |
15
peptides |
96
spectra |
 |
|
0.000
0.000 | 0.000 |
|
|
|
|
|
|
|
1.000
1.000 | 1.000 |
| | | Plot |
|
Lyso |
|
|
|
|
|
|
|
Other |
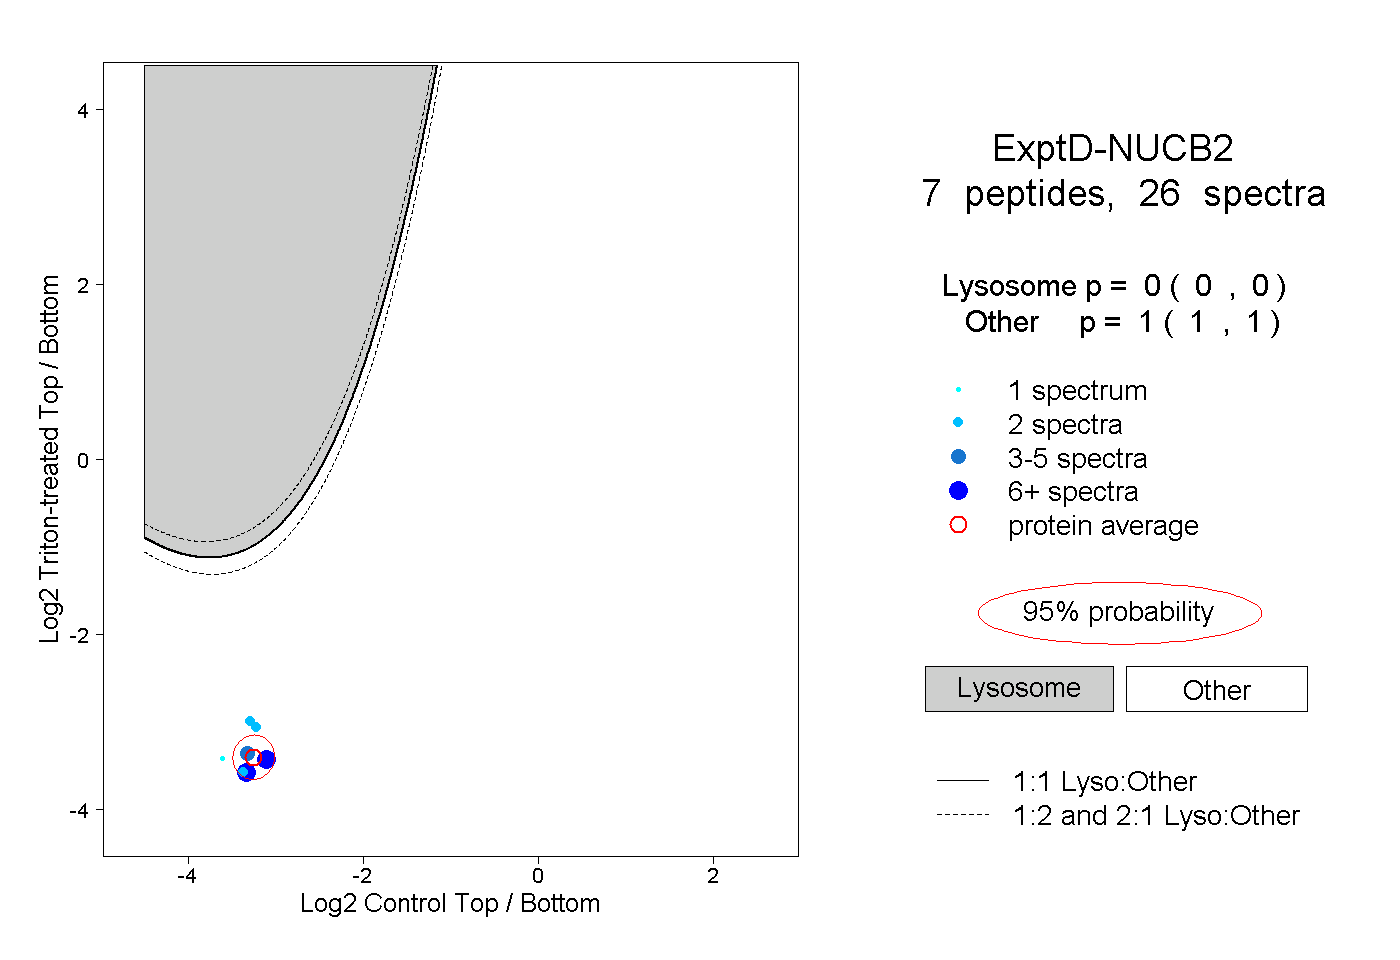
| Expt D |
7
peptides |
26
spectra |
 |
|
0.000
0.000 | 0.000 |
|
|
|
|
|
|
|
1.000
1.000 | 1.000 |