 13
13peptides
spectra
0.000 | 0.000
0.004 | 0.011
0.000 | 0.000
0.738 | 0.749
0.136 | 0.153
0.000 | 0.000
0.096 | 0.109
0.000 | 0.000
| Plot | Mito | Lyso | Perox | ER | Golgi | PM | Cytosol | Nucleus | |||||
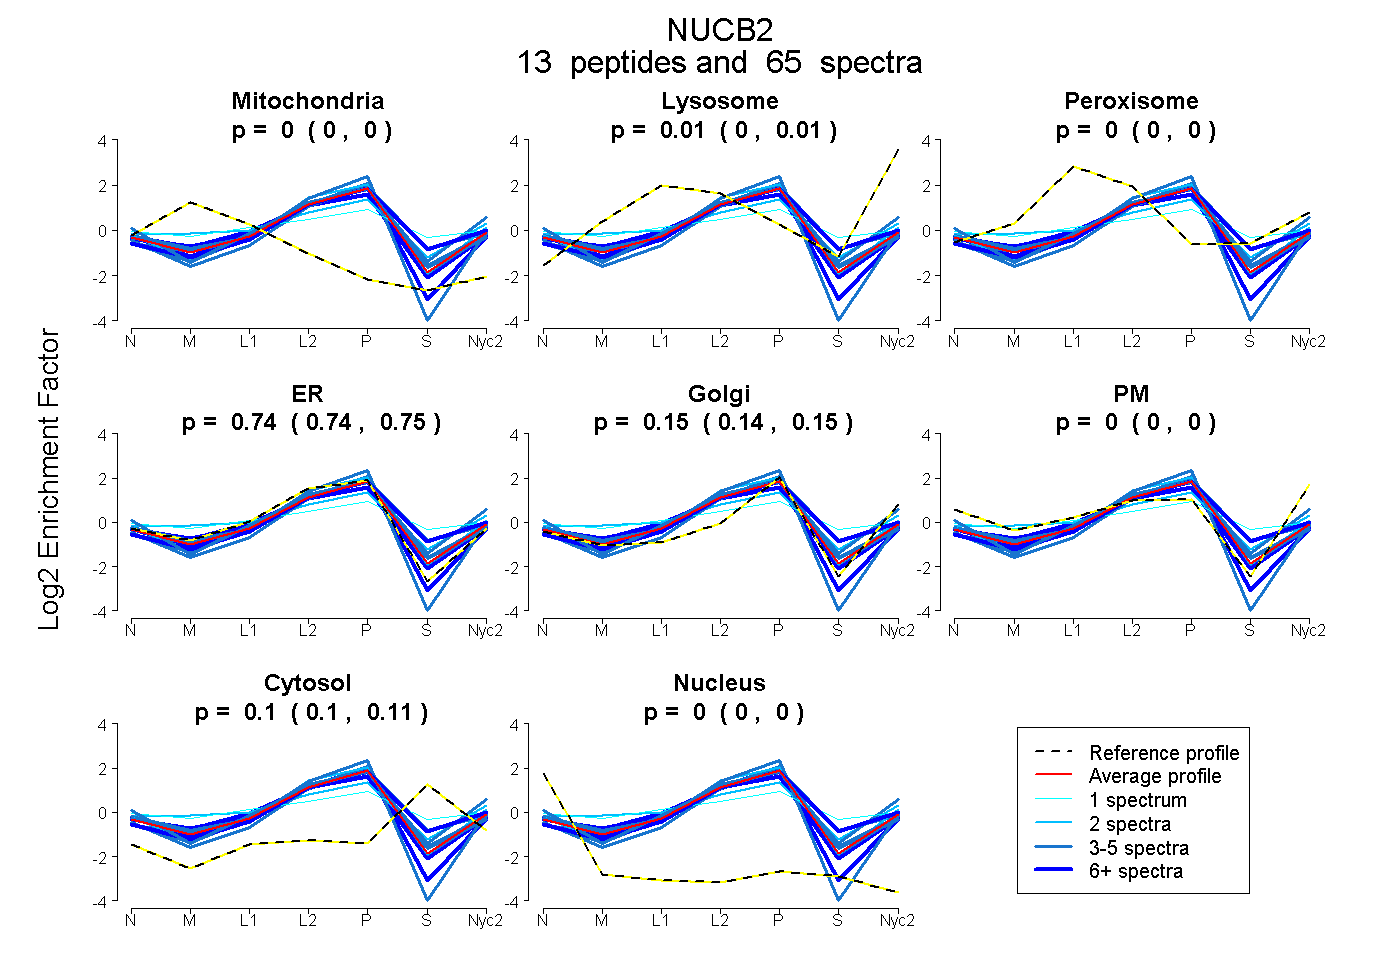
| Expt A |
13 peptides |
65 spectra |
|
0.000 0.000 | 0.000 |
0.008 0.004 | 0.011 |
0.000 0.000 | 0.000 |
0.744 0.738 | 0.749 |
0.145 0.136 | 0.153 |
0.000 0.000 | 0.000 |
0.103 0.096 | 0.109 |
0.000 0.000 | 0.000 |
| 3 spectra, VHNVEPVESAR | 0.000 | 0.000 | 0.000 | 0.771 | 0.029 | 0.051 | 0.149 | 0.000 | ||
| 4 spectra, HEDHPK | 0.000 | 0.000 | 0.000 | 0.739 | 0.175 | 0.000 | 0.087 | 0.000 | ||
| 5 spectra, LVTLEEFLR | 0.000 | 0.000 | 0.000 | 0.844 | 0.156 | 0.000 | 0.000 | 0.000 | ||
| 12 spectra, DLDMLIK | 0.014 | 0.000 | 0.054 | 0.738 | 0.121 | 0.000 | 0.072 | 0.000 | ||
| 3 spectra, QHDHLEAQK | 0.000 | 0.000 | 0.000 | 0.802 | 0.061 | 0.000 | 0.137 | 0.000 | ||
| 1 spectrum, QVIEVLETDPHFR | 0.000 | 0.000 | 0.307 | 0.171 | 0.292 | 0.005 | 0.226 | 0.000 | ||
| 3 spectra, LDALQDTGMNHHLLLK | 0.000 | 0.101 | 0.000 | 0.498 | 0.202 | 0.098 | 0.101 | 0.000 | ||
| 10 spectra, AATADLEQYDR | 0.016 | 0.000 | 0.000 | 0.809 | 0.165 | 0.000 | 0.000 | 0.009 | ||
| 2 spectra, FQQGIAPSGPAGELK | 0.003 | 0.000 | 0.263 | 0.226 | 0.433 | 0.004 | 0.072 | 0.000 | ||
| 3 spectra, HEEFK | 0.000 | 0.000 | 0.000 | 0.613 | 0.139 | 0.000 | 0.248 | 0.000 | ||
| 7 spectra, TLSEEK | 0.000 | 0.051 | 0.000 | 0.642 | 0.081 | 0.000 | 0.225 | 0.000 | ||
| 10 spectra, ADIEEIR | 0.000 | 0.000 | 0.000 | 0.766 | 0.155 | 0.000 | 0.079 | 0.000 | ||
| 2 spectra, LSQELDLVSHK | 0.000 | 0.002 | 0.000 | 0.746 | 0.183 | 0.000 | 0.069 | 0.000 |
| Plot | Mito | Lyso or Perox | ER | Golgi | PM | Cytosol | Nucleus | ||||||
| Expt B |
7 peptides |
36 spectra |
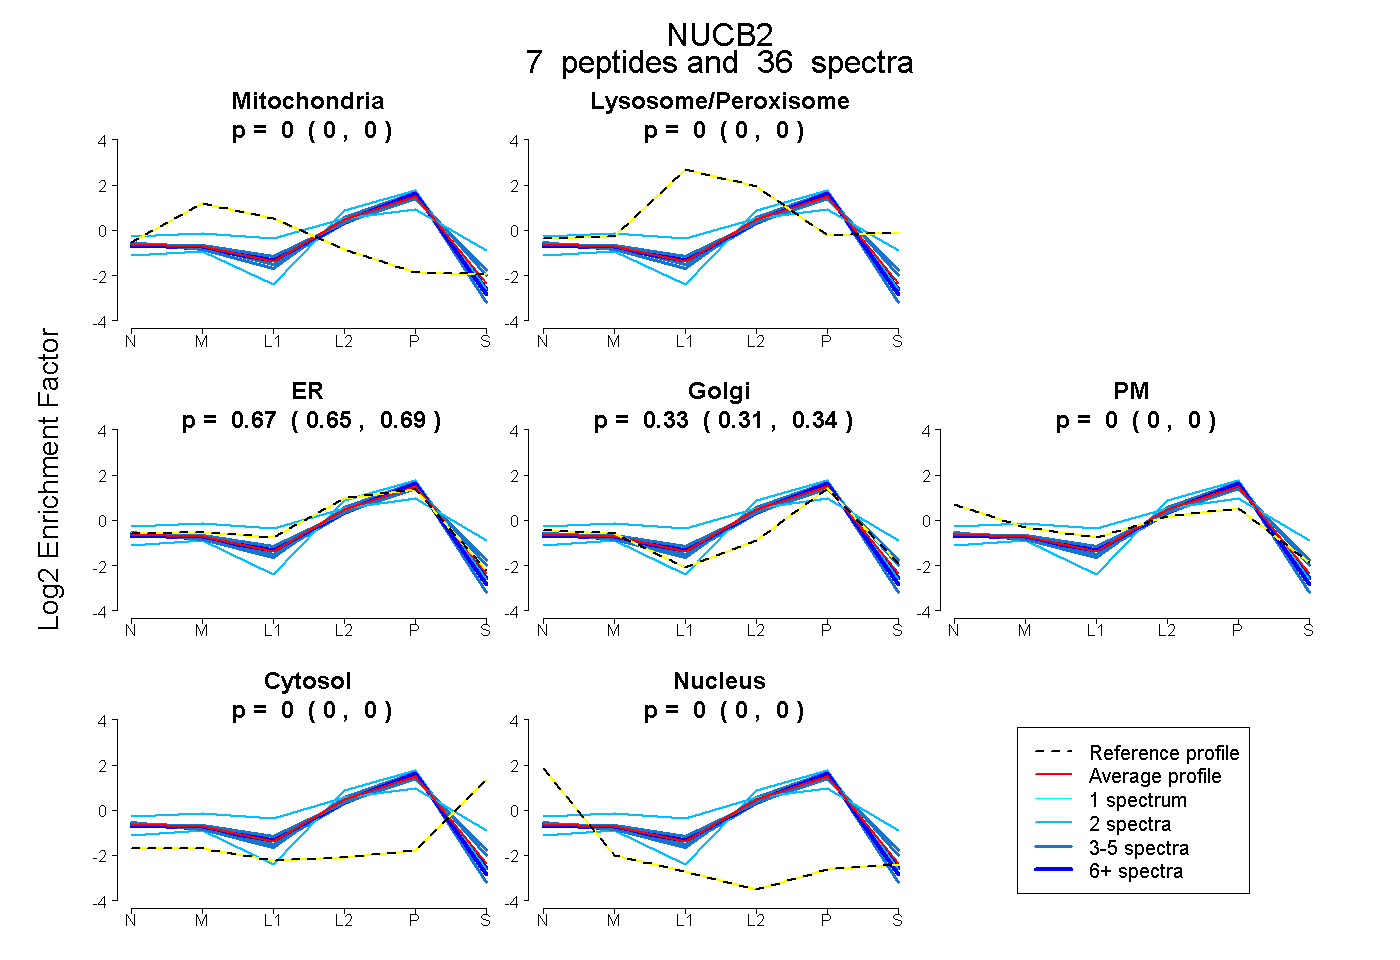 |
0.000 0.000 | 0.000 |
0.000 0.000 | 0.000 |
0.674 0.653 | 0.691 |
0.326 0.307 | 0.343 |
0.000 0.000 | 0.000 |
0.000 0.000 | 0.000 |
0.000 0.000 | 0.000 |
|||
| Plot | Lyso | Other | |||||||||||
| Expt C |
15 peptides |
96 spectra |
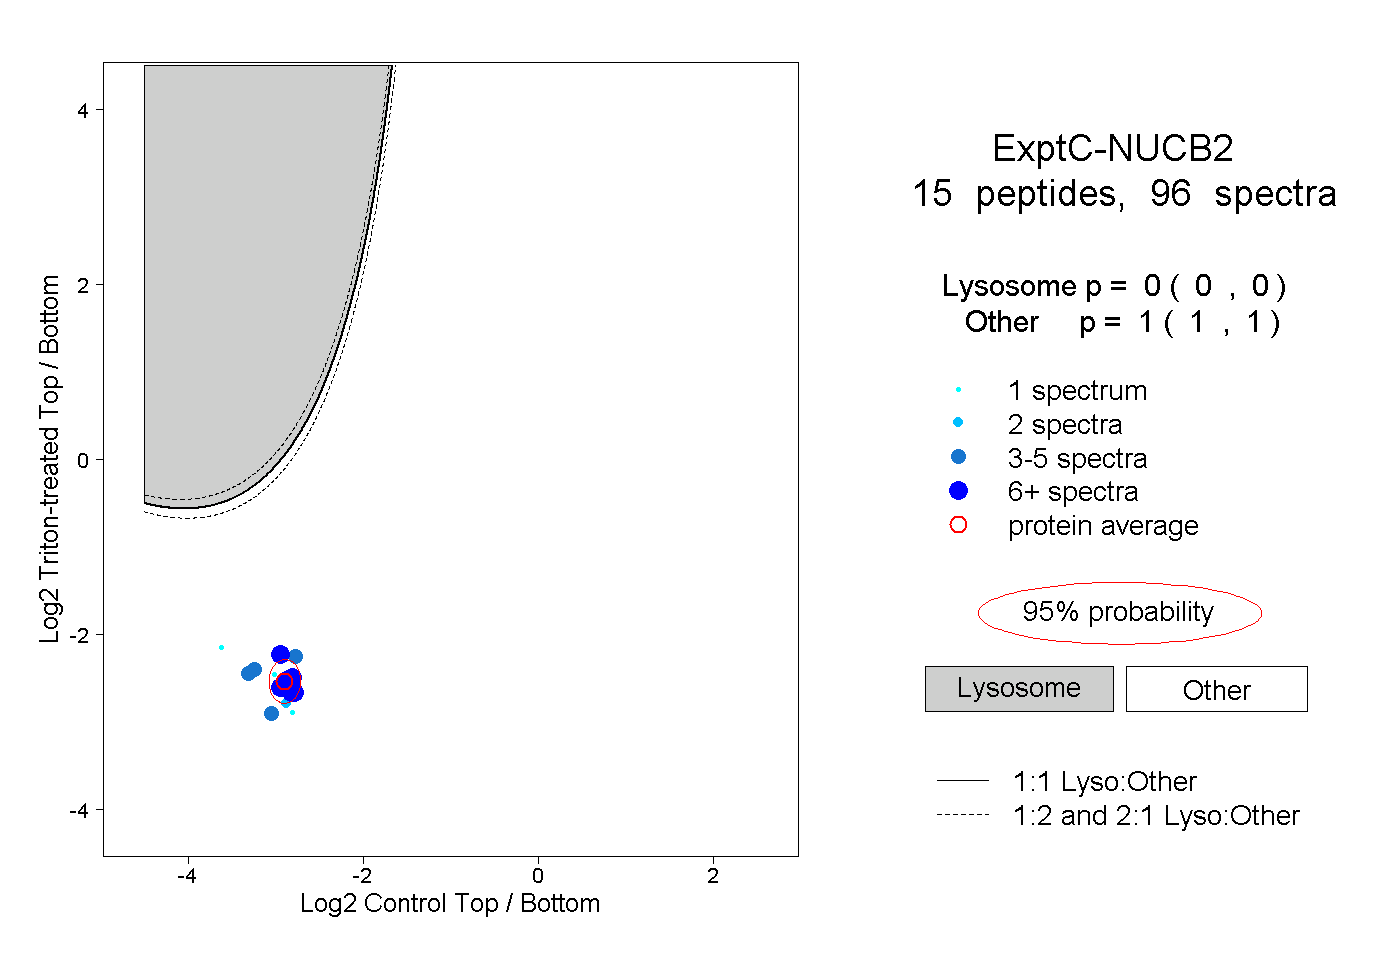 |
0.000 0.000 | 0.000 |
1.000 1.000 | 1.000 |
||||||||
| Plot | Lyso | Other | |||||||||||
| Expt D |
7 peptides |
26 spectra |
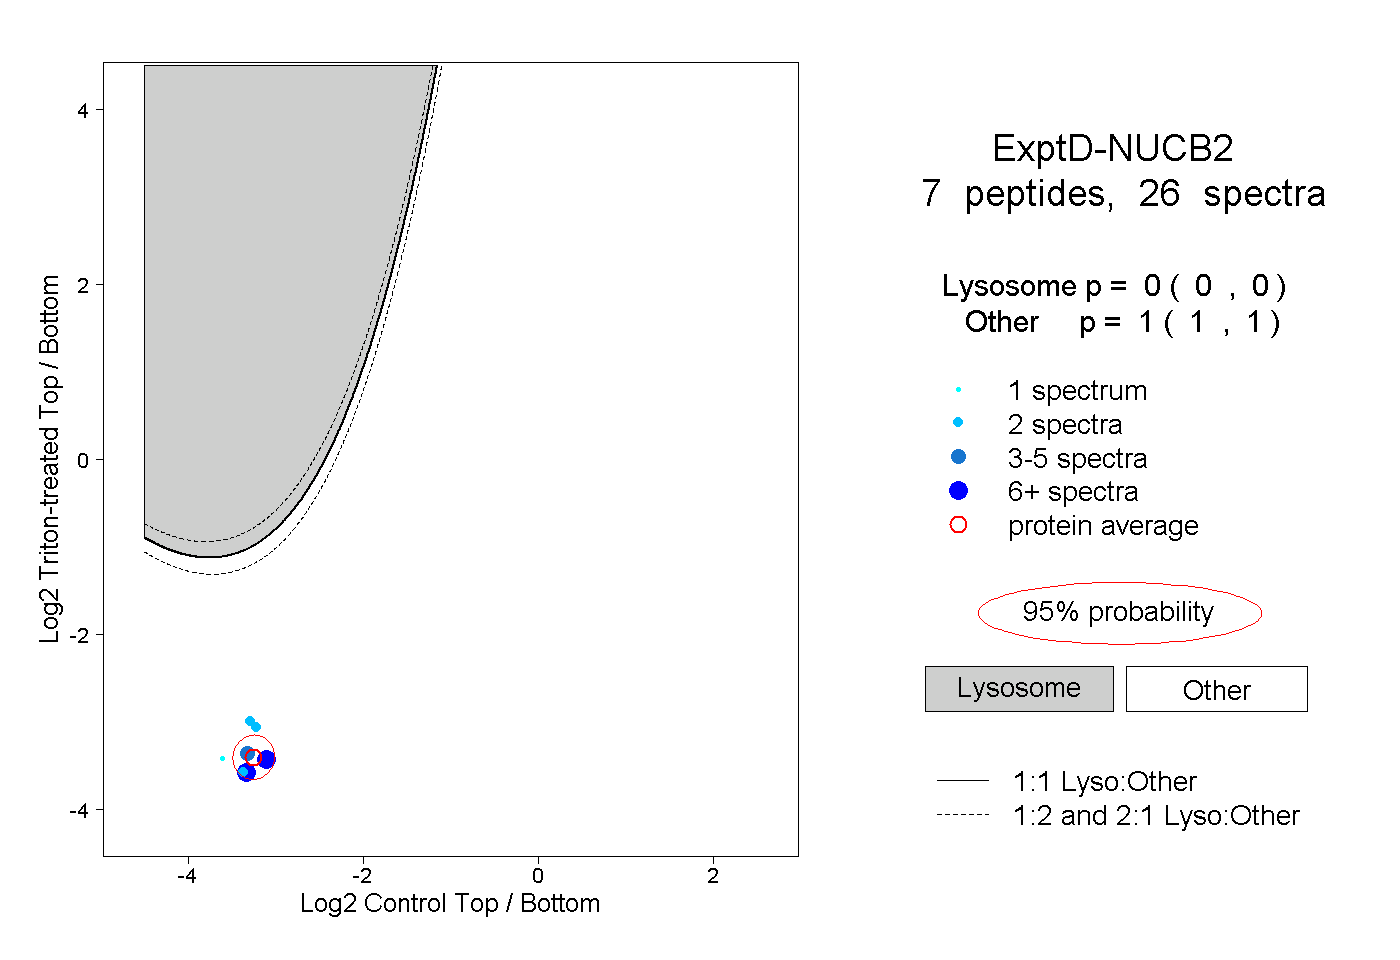 |
0.000 0.000 | 0.000 |
1.000 1.000 | 1.000 |