 22
22peptides
spectra
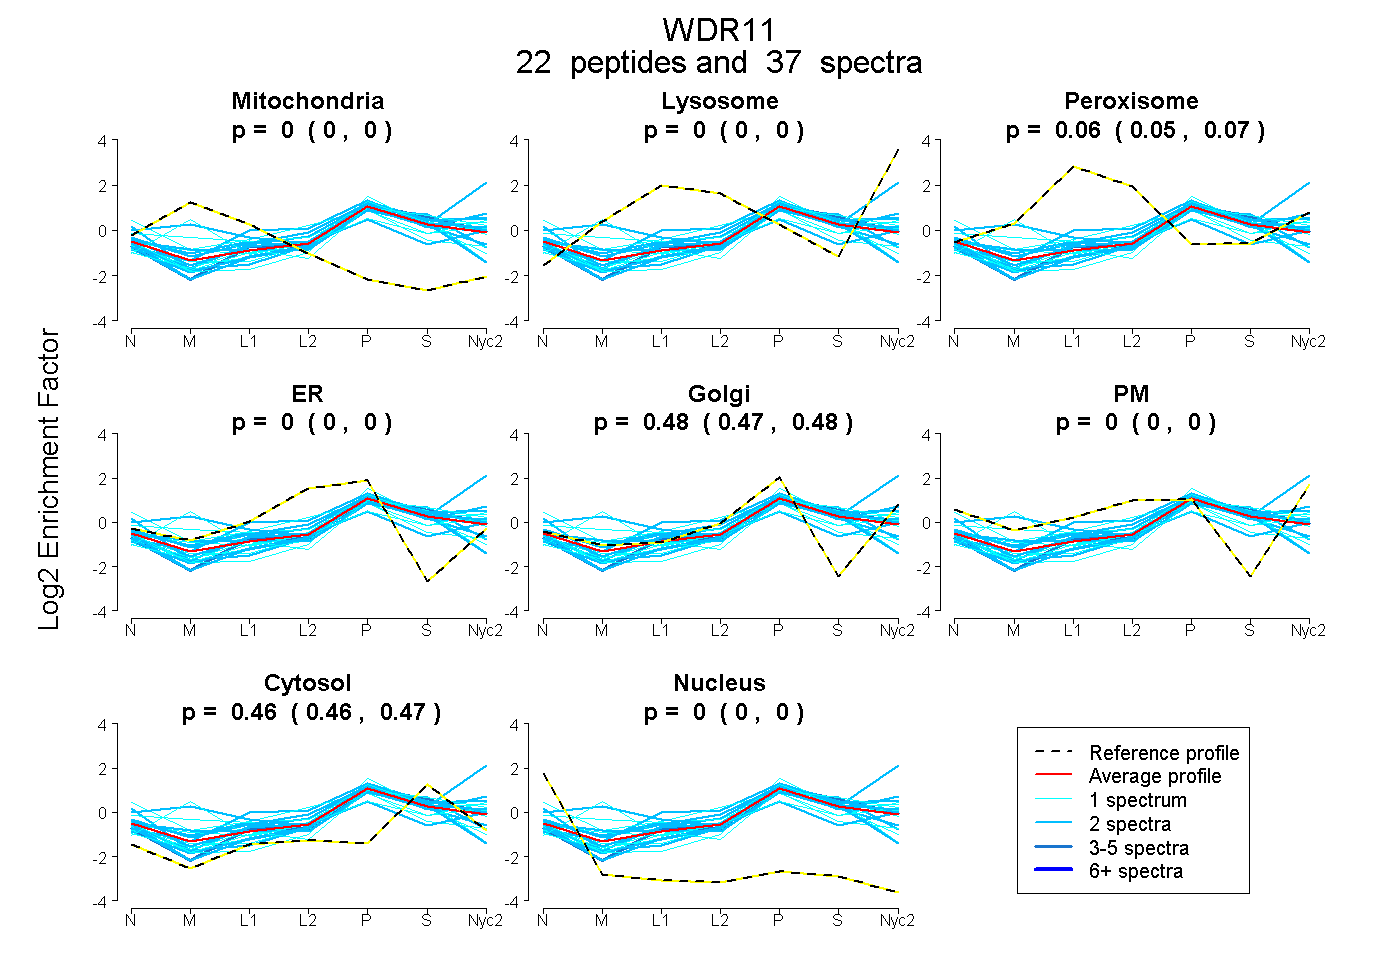
0.000 | 0.000
0.000 | 0.000
0.055 | 0.066
0.000 | 0.000
0.471 | 0.482
0.000 | 0.000
0.456 | 0.467
0.000 | 0.000
4peptides
spectra
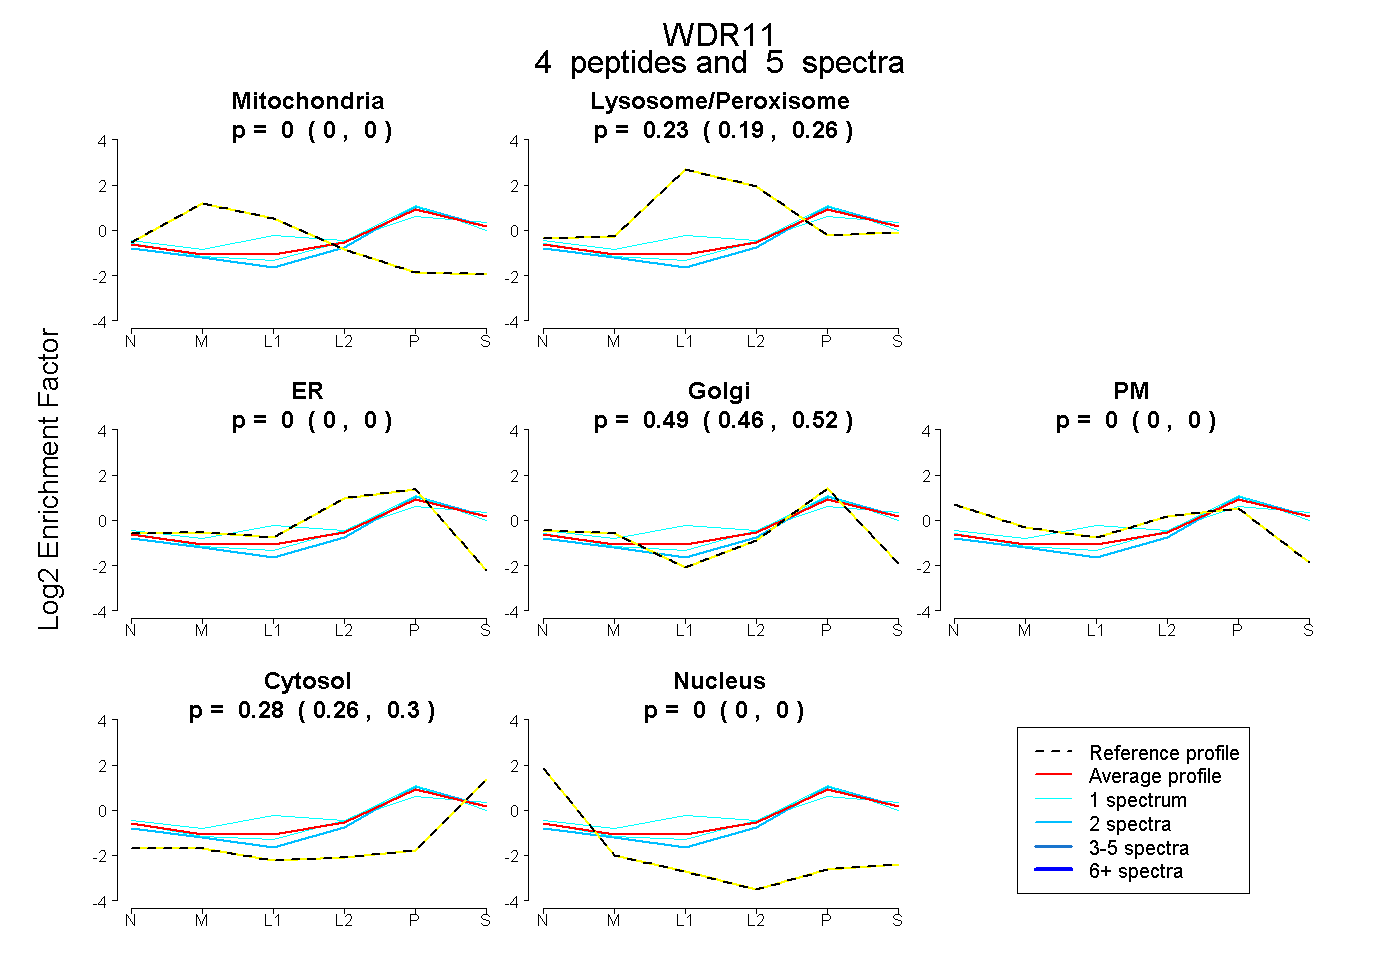
0.000 | 0.000
0.190 | 0.257
0.000 | 0.000
0.462 | 0.516
0.000 | 0.000
0.262 | 0.298
0.000 | 0.000
13peptides
spectra
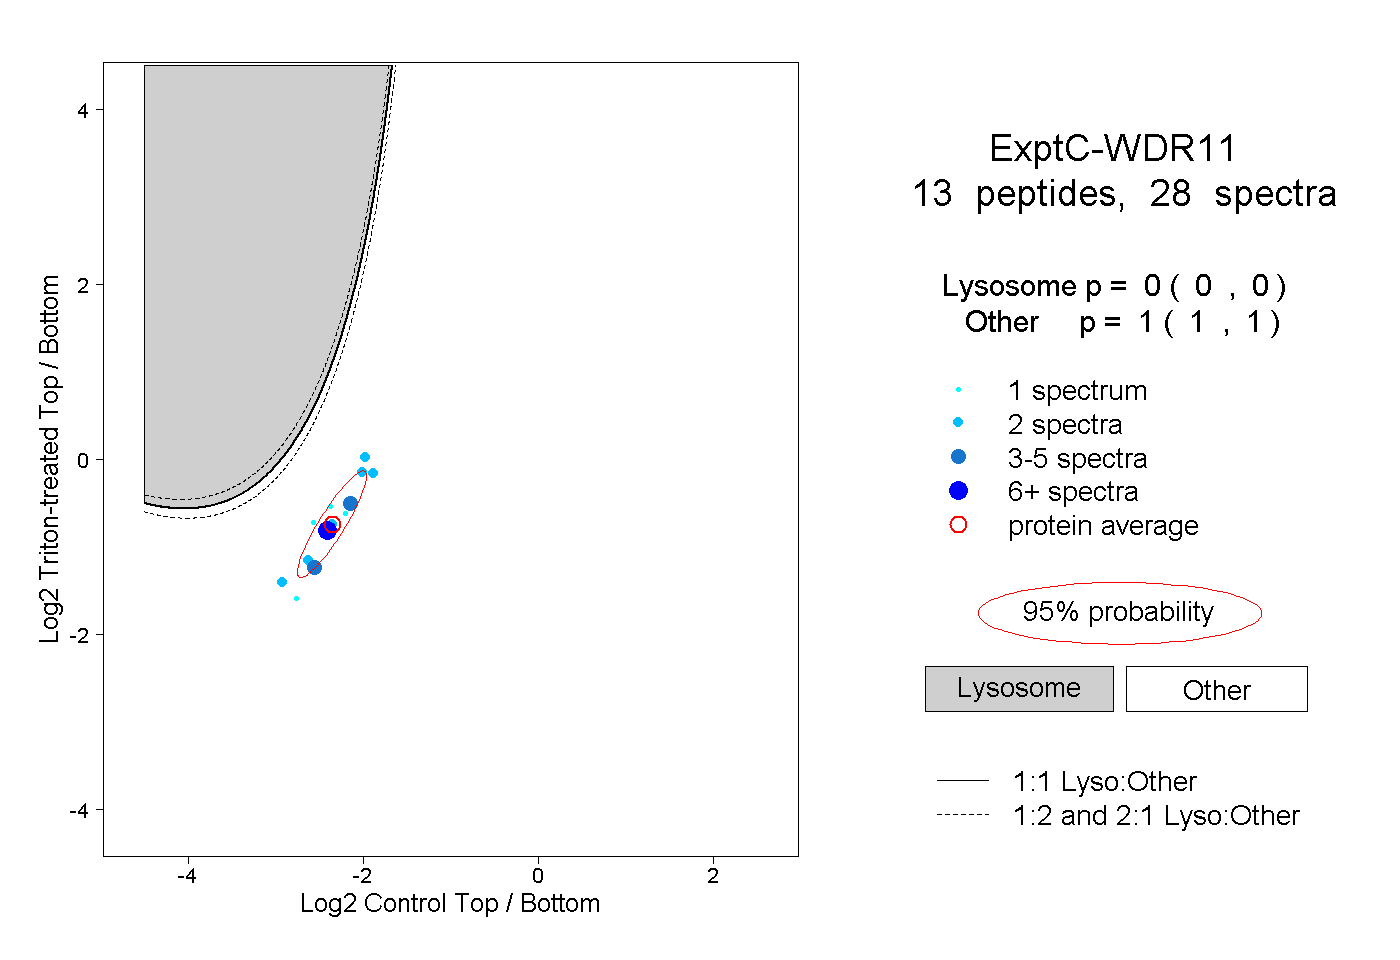
0.000 | 0.000
1.000 | 1.000
2peptides
spectra

0.000 | 0.008
0.991 | 1.000