 22
22peptides
spectra
0.000 | 0.000
0.000 | 0.000
0.055 | 0.066
0.000 | 0.000
0.471 | 0.482
0.000 | 0.000
0.456 | 0.467
0.000 | 0.000
| Plot | Mito | Lyso | Perox | ER | Golgi | PM | Cytosol | Nucleus | |||||
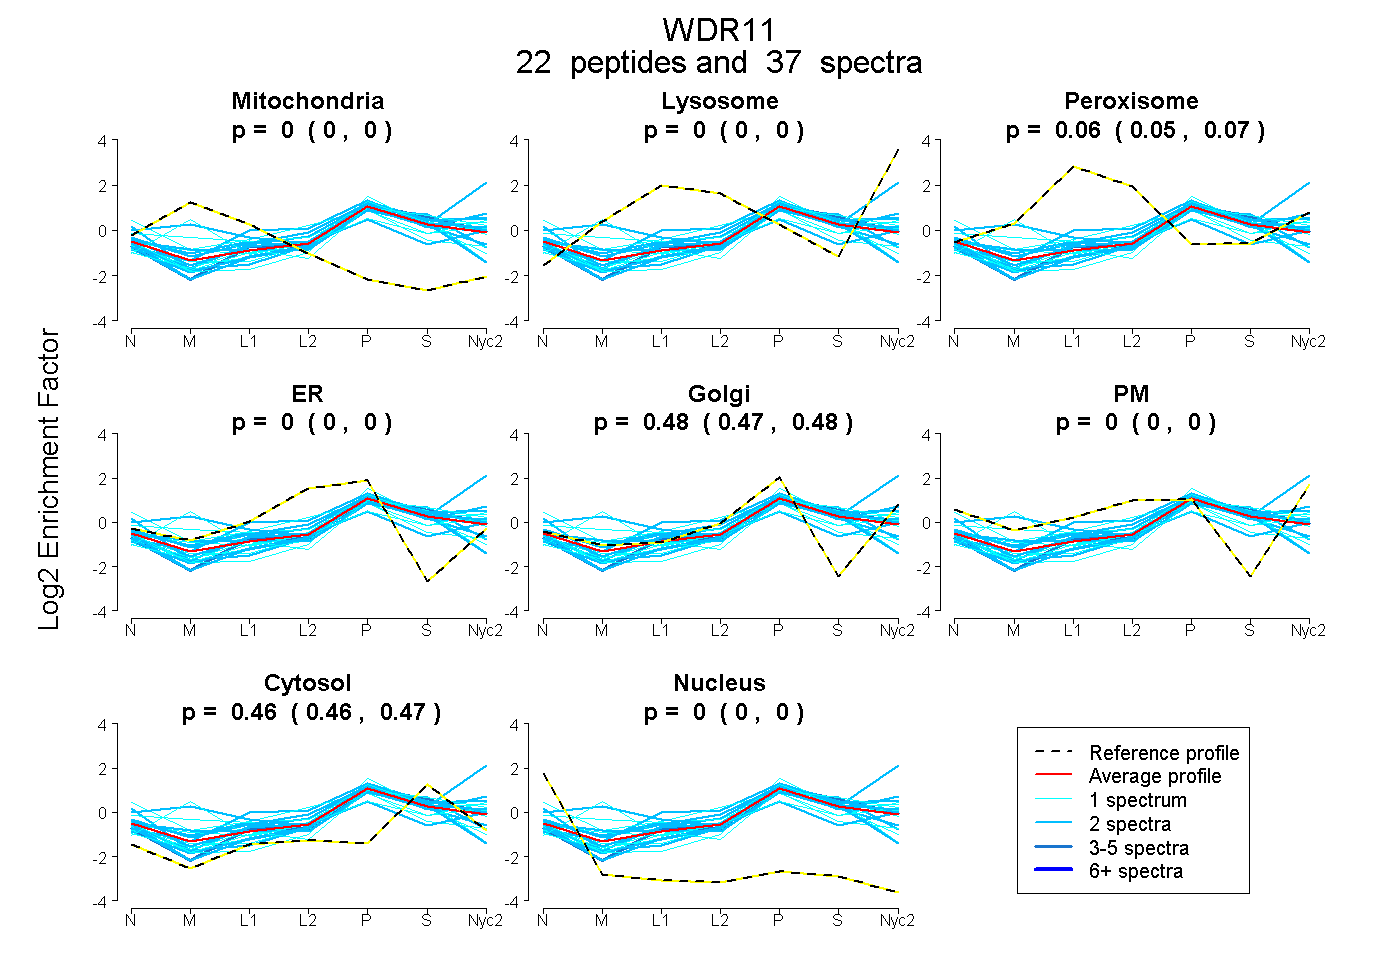
| Expt A |
22 peptides |
37 spectra |
|
0.000 0.000 | 0.000 |
0.000 0.000 | 0.000 |
0.061 0.055 | 0.066 |
0.000 0.000 | 0.000 |
0.478 0.471 | 0.482 |
0.000 0.000 | 0.000 |
0.462 0.456 | 0.467 |
0.000 0.000 | 0.000 |
| 1 spectrum, TGVPFLQVIPCSQR | 0.000 | 0.000 | 0.014 | 0.000 | 0.514 | 0.000 | 0.472 | 0.000 | ||
| 2 spectra, TLTGALNAHNK | 0.000 | 0.118 | 0.041 | 0.000 | 0.413 | 0.065 | 0.363 | 0.000 | ||
| 1 spectrum, SHMLLLYPR | 0.000 | 0.000 | 0.072 | 0.440 | 0.000 | 0.112 | 0.321 | 0.055 | ||
| 1 spectrum, LNSEECADVLK | 0.000 | 0.000 | 0.000 | 0.000 | 0.468 | 0.000 | 0.517 | 0.015 | ||
| 1 spectrum, LITAIYTDYAR | 0.000 | 0.075 | 0.013 | 0.000 | 0.484 | 0.000 | 0.428 | 0.000 | ||
| 4 spectra, DKPLELWDIR | 0.000 | 0.000 | 0.019 | 0.000 | 0.435 | 0.000 | 0.546 | 0.000 | ||
| 2 spectra, SAVCSR | 0.000 | 0.393 | 0.000 | 0.000 | 0.309 | 0.000 | 0.298 | 0.000 | ||
| 2 spectra, SELSQNISAR | 0.000 | 0.006 | 0.000 | 0.000 | 0.499 | 0.000 | 0.495 | 0.000 | ||
| 2 spectra, CLLVSR | 0.000 | 0.000 | 0.000 | 0.139 | 0.235 | 0.000 | 0.626 | 0.000 | ||
| 1 spectrum, GNDESPIEMIK | 0.000 | 0.000 | 0.000 | 0.000 | 0.462 | 0.000 | 0.538 | 0.000 | ||
| 2 spectra, SQCDAIR | 0.210 | 0.000 | 0.121 | 0.000 | 0.332 | 0.119 | 0.218 | 0.000 | ||
| 2 spectra, VMIWELK | 0.000 | 0.000 | 0.085 | 0.000 | 0.463 | 0.000 | 0.452 | 0.000 | ||
| 2 spectra, EVQMVSSLR | 0.000 | 0.127 | 0.000 | 0.000 | 0.421 | 0.000 | 0.453 | 0.000 | ||
| 1 spectrum, VLEMSMK | 0.174 | 0.156 | 0.000 | 0.000 | 0.342 | 0.000 | 0.328 | 0.000 | ||
| 2 spectra, VILASDDGCIR | 0.084 | 0.000 | 0.000 | 0.252 | 0.134 | 0.000 | 0.529 | 0.000 | ||
| 2 spectra, LLLDPEFTLLQR | 0.000 | 0.000 | 0.000 | 0.000 | 0.472 | 0.000 | 0.528 | 0.000 | ||
| 2 spectra, AFLLHQPWNGR | 0.000 | 0.000 | 0.000 | 0.054 | 0.418 | 0.000 | 0.481 | 0.047 | ||
| 1 spectrum, ILDVDWCTSDK | 0.000 | 0.000 | 0.000 | 0.226 | 0.164 | 0.000 | 0.609 | 0.000 | ||
| 2 spectra, APSGPGK | 0.000 | 0.000 | 0.115 | 0.000 | 0.475 | 0.000 | 0.411 | 0.000 | ||
| 1 spectrum, LIAMYTDGAEVWDTK | 0.000 | 0.000 | 0.157 | 0.000 | 0.359 | 0.161 | 0.323 | 0.000 | ||
| 1 spectrum, YSLDISHIDYPENEEIK | 0.000 | 0.041 | 0.000 | 0.000 | 0.390 | 0.000 | 0.569 | 0.000 | ||
| 2 spectra, LAEGVQLLCLIDK | 0.000 | 0.000 | 0.000 | 0.246 | 0.159 | 0.000 | 0.582 | 0.013 |
| Plot | Mito | Lyso or Perox | ER | Golgi | PM | Cytosol | Nucleus | ||||||
| Expt B |
4 peptides |
5 spectra |
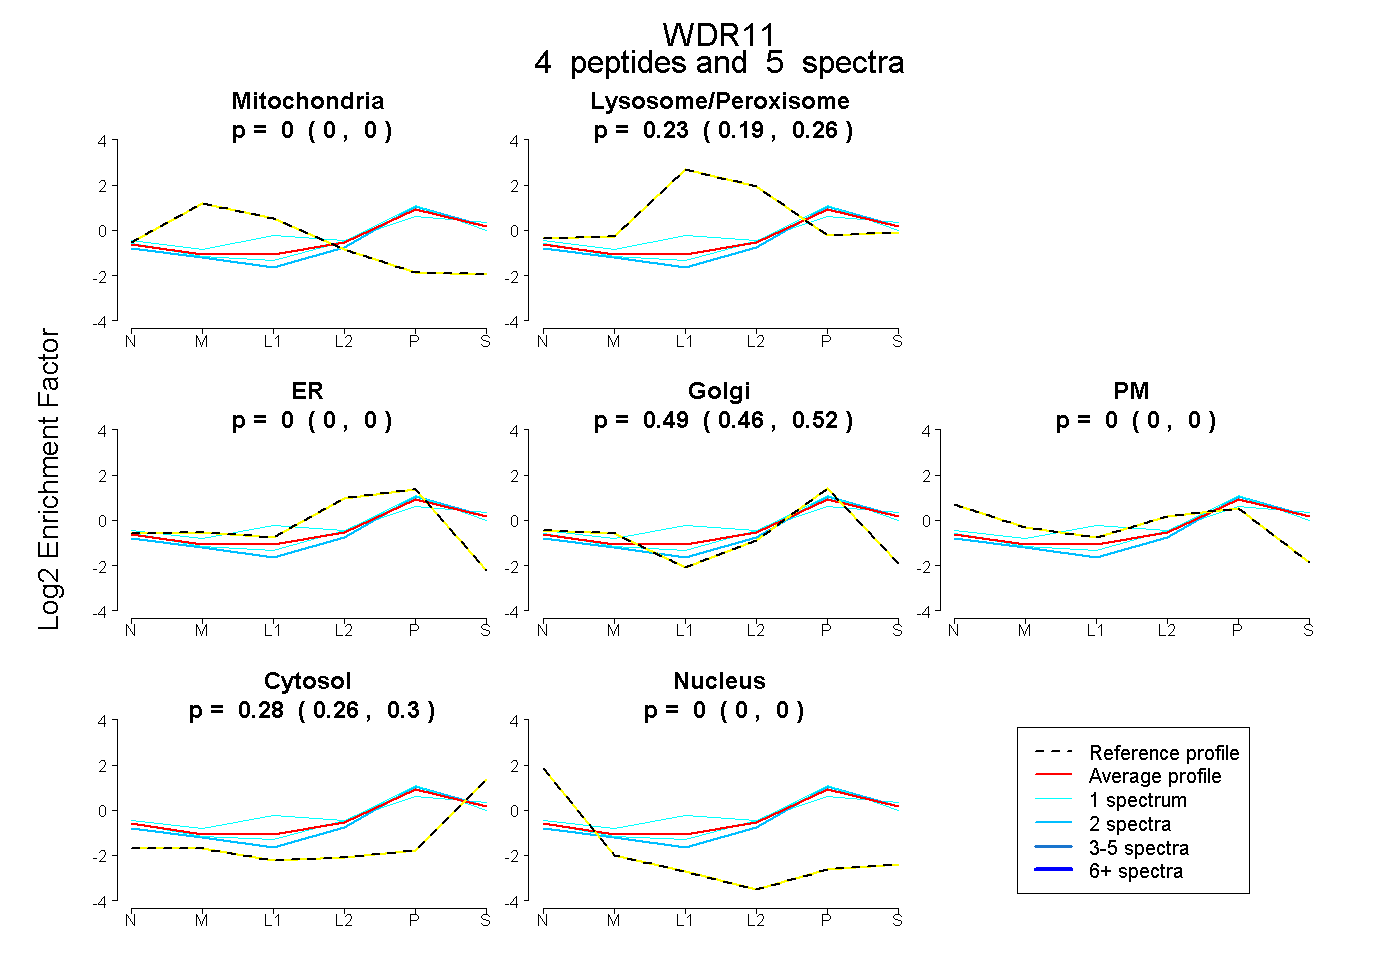 |
0.000 0.000 | 0.000 |
0.226 0.190 | 0.257 |
0.000 0.000 | 0.000 |
0.491 0.462 | 0.516 |
0.000 0.000 | 0.000 |
0.282 0.262 | 0.298 |
0.000 0.000 | 0.000 |
|||
| Plot | Lyso | Other | |||||||||||
| Expt C |
13 peptides |
28 spectra |
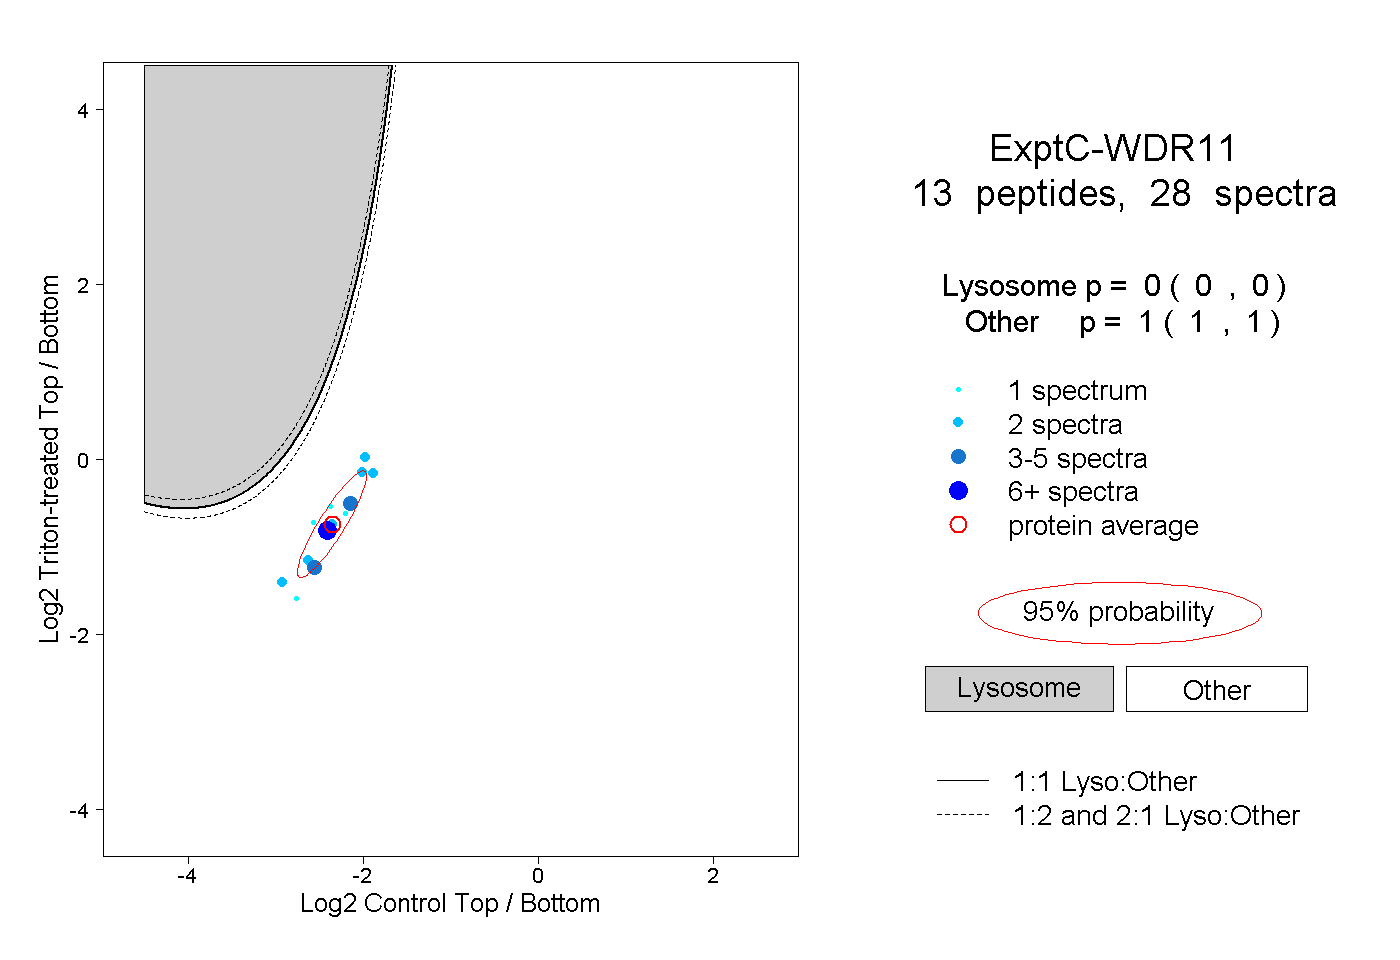 |
0.000 0.000 | 0.000 |
1.000 1.000 | 1.000 |
||||||||
| Plot | Lyso | Other | |||||||||||
| Expt D |
2 peptides |
6 spectra |
 |
0.001 0.000 | 0.008 |
0.999 0.991 | 1.000 |