WDR11
[ENSRNOP00000027704]
Main page
| | | Plot |
Mito |
Lyso |
|
Perox |
ER |
Golgi |
PM |
Cytosol |
Nucleus |
|
| Expt A |
 22
22
peptides |
37
spectra |
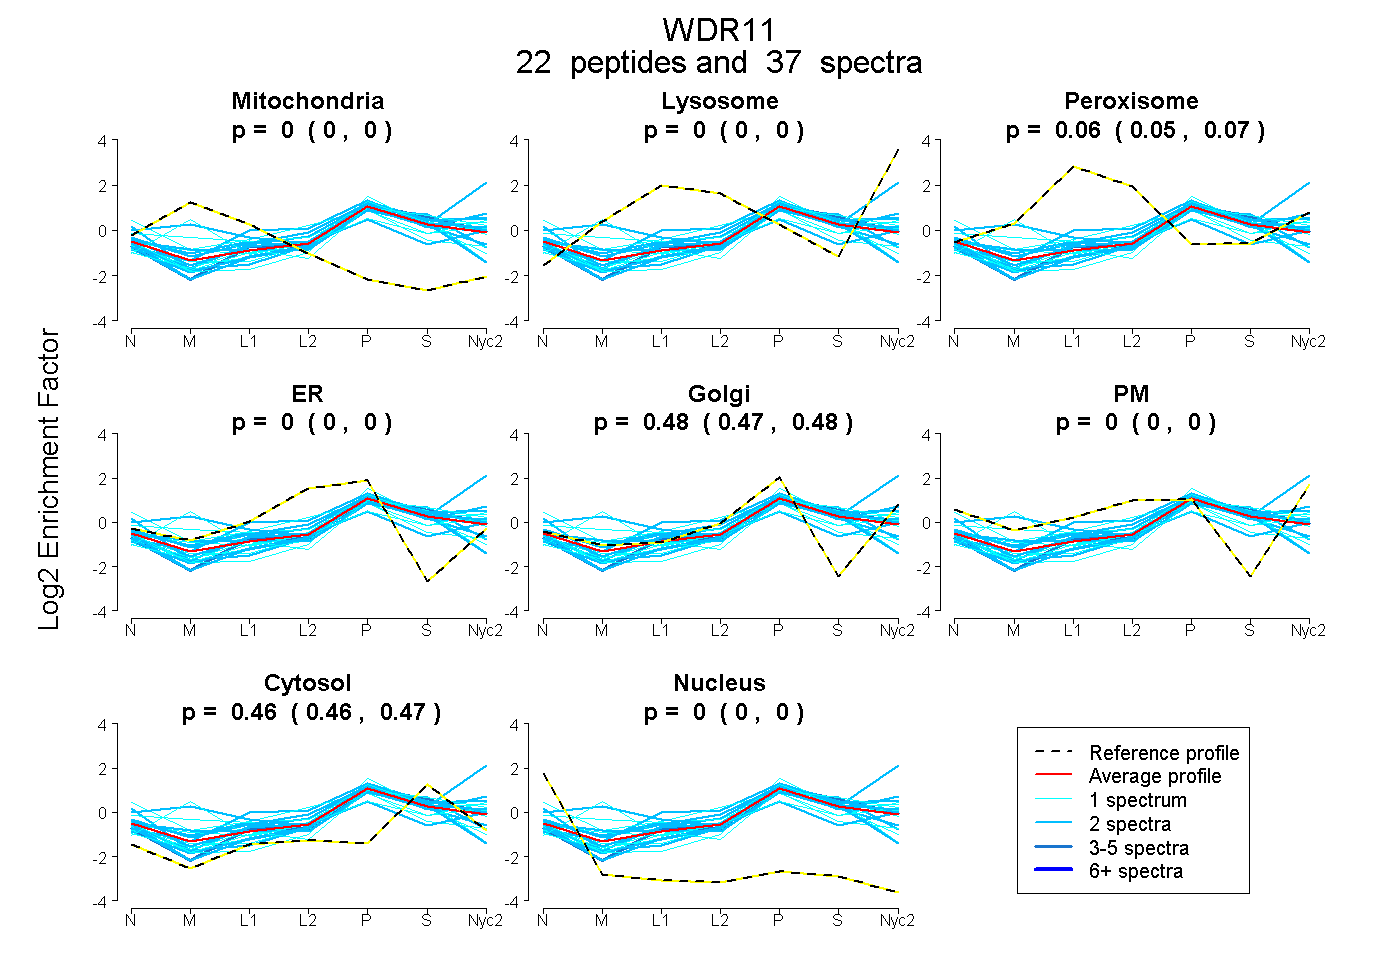 |
0.000
0.000 | 0.000 |
0.000
0.000 | 0.000 |
|
0.061
0.055 | 0.066 |
0.000
0.000 | 0.000 |
0.478
0.471 | 0.482 |
0.000
0.000 | 0.000 |
0.462
0.456 | 0.467 |
0.000
0.000 | 0.000 |
|
| | | Plot |
Mito |
|
Lyso or Perox |
|
ER |
Golgi |
PM |
Cytosol |
Nucleus |
|
| Expt B |
4
peptides |
5
spectra |
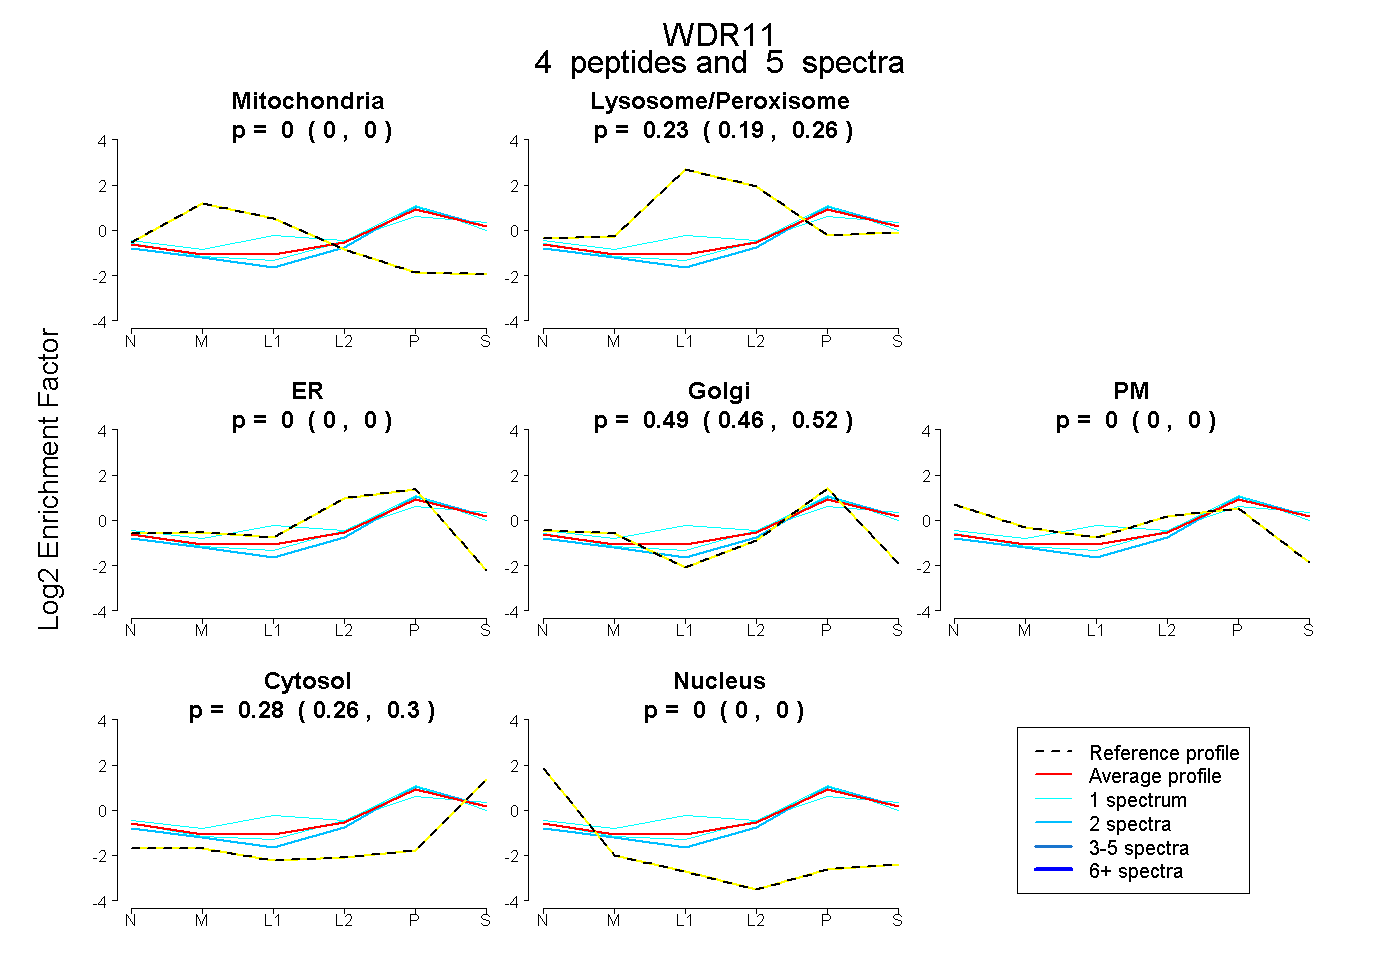 |
0.000
0.000 | 0.000 |
|
0.226
0.190 | 0.257 |
|
0.000
0.000 | 0.000 |
0.491
0.462 | 0.516 |
0.000
0.000 | 0.000 |
0.282
0.262 | 0.298 |
0.000
0.000 | 0.000 |
|
| 1 spectrum, AFLLHQPWNGR |
0.000 |
|
0.368 |
|
0.000 |
0.351 |
0.000 |
0.282 |
0.000 |
|
| 2 spectra, CLLVSR |
0.000 |
|
0.122 |
|
0.000 |
0.554 |
0.000 |
0.324 |
0.000 |
|
| 1 spectrum, QYLAVVFK |
0.000 |
|
0.221 |
|
0.000 |
0.542 |
0.000 |
0.236 |
0.000 |
|
| 1 spectrum, TCTLLR |
0.000 |
|
0.197 |
|
0.000 |
0.517 |
0.000 |
0.285 |
0.000 |
|
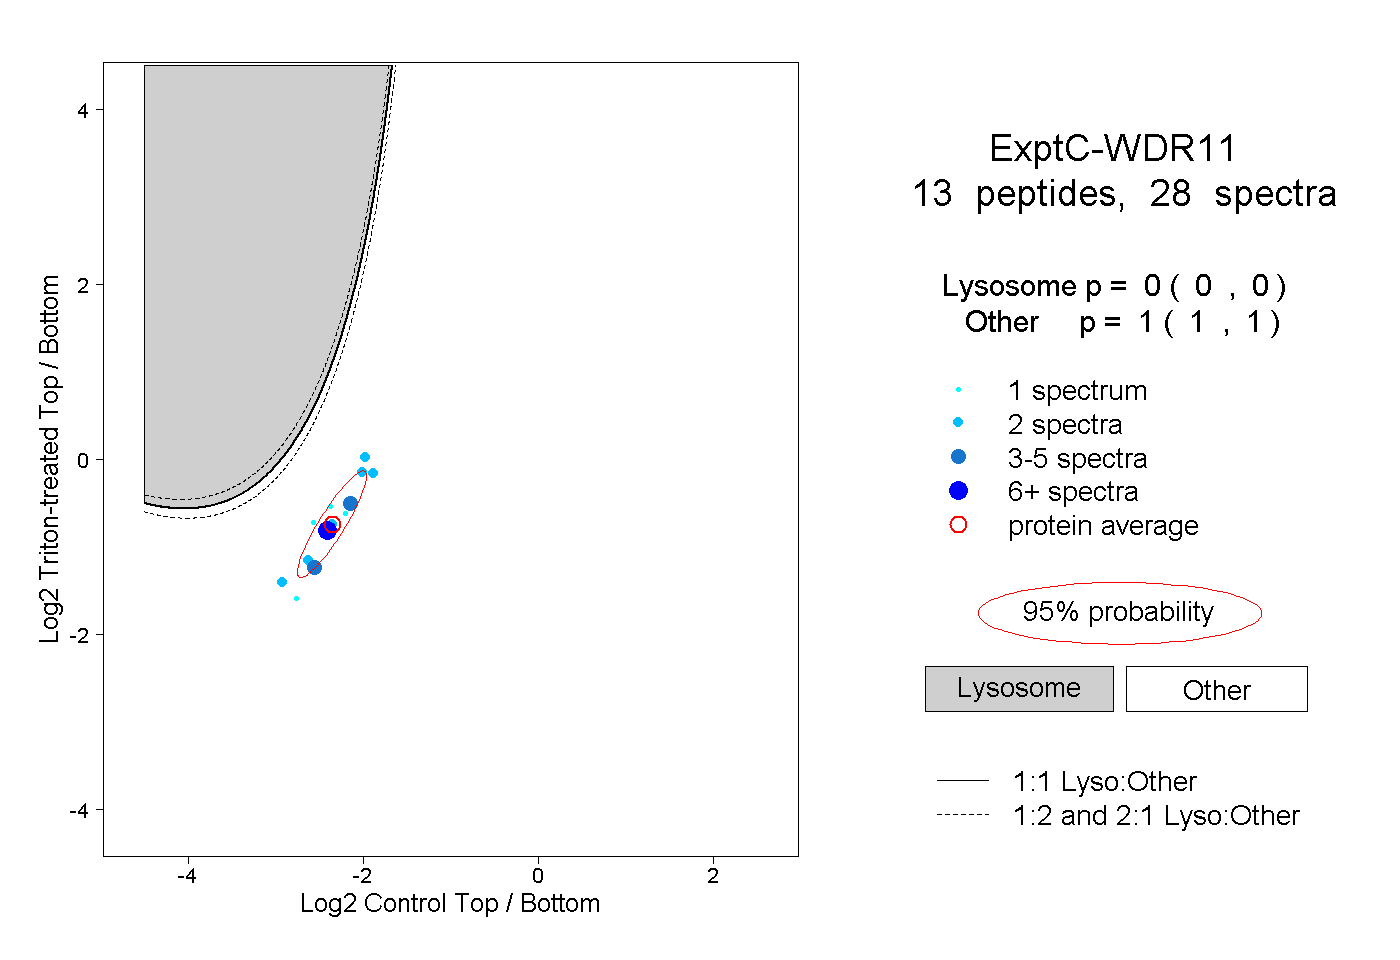
| | | Plot |
|
Lyso |
|
|
|
|
|
|
|
Other |
| Expt C |
13
peptides |
28
spectra |
 |
|
0.000
0.000 | 0.000 |
|
|
|
|
|
|
|
1.000
1.000 | 1.000 |
| | | Plot |
|
Lyso |
|
|
|
|
|
|
|
Other |
| Expt D |
2
peptides |
6
spectra |
 |
|
0.001
0.000 | 0.008 |
|
|
|
|
|
|
|
0.999
0.991 | 1.000 |