 11
11peptides
spectra
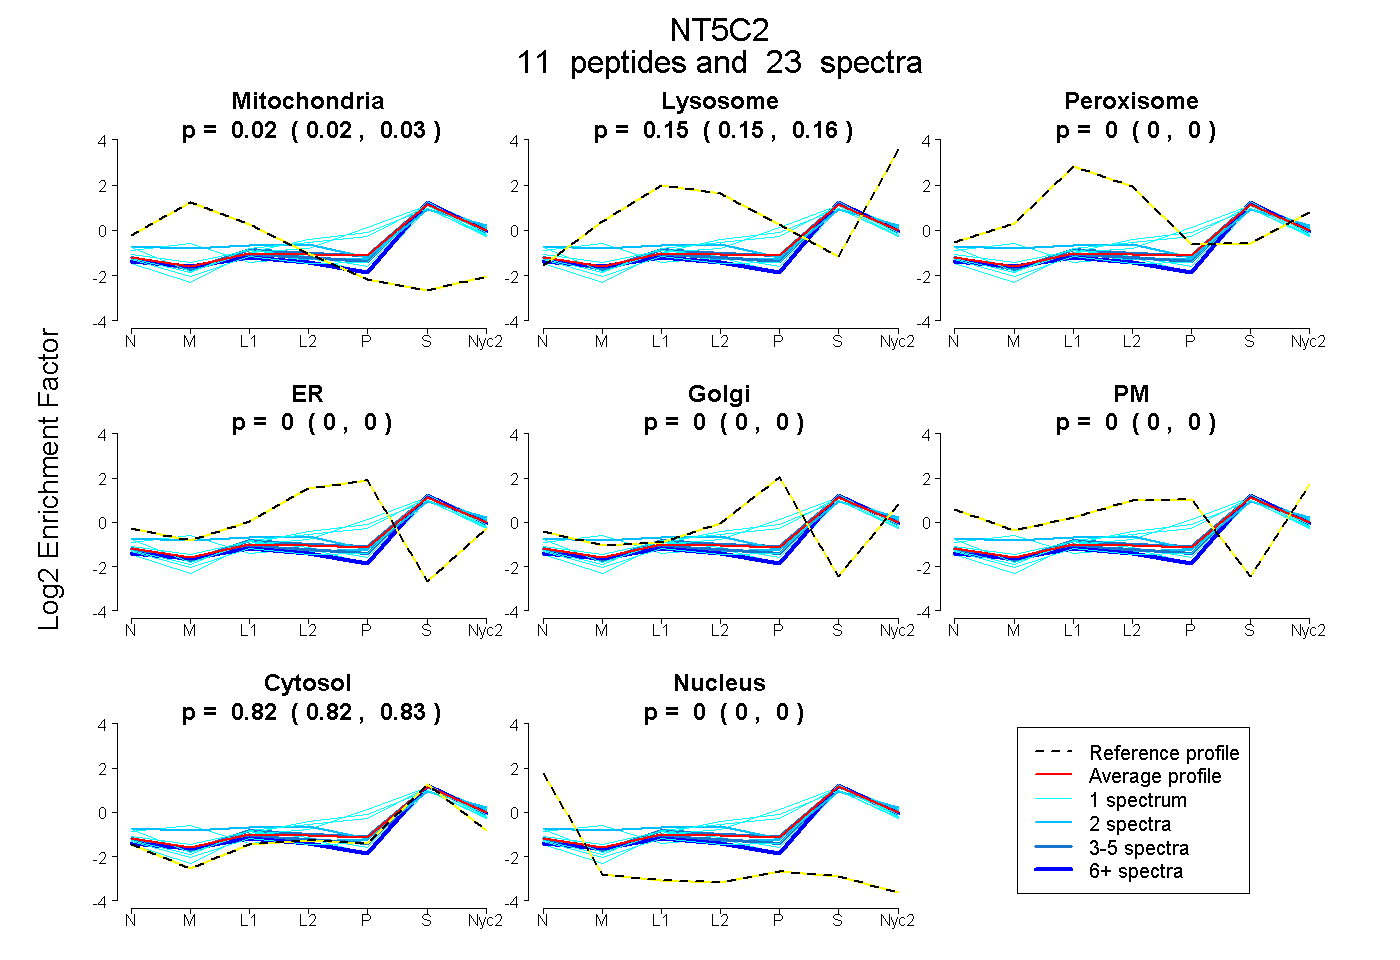
0.016 | 0.028
0.148 | 0.157
0.000 | 0.000
0.000 | 0.000
0.000 | 0.000
0.000 | 0.000
0.818 | 0.829
0.000 | 0.000
1peptide
spectra
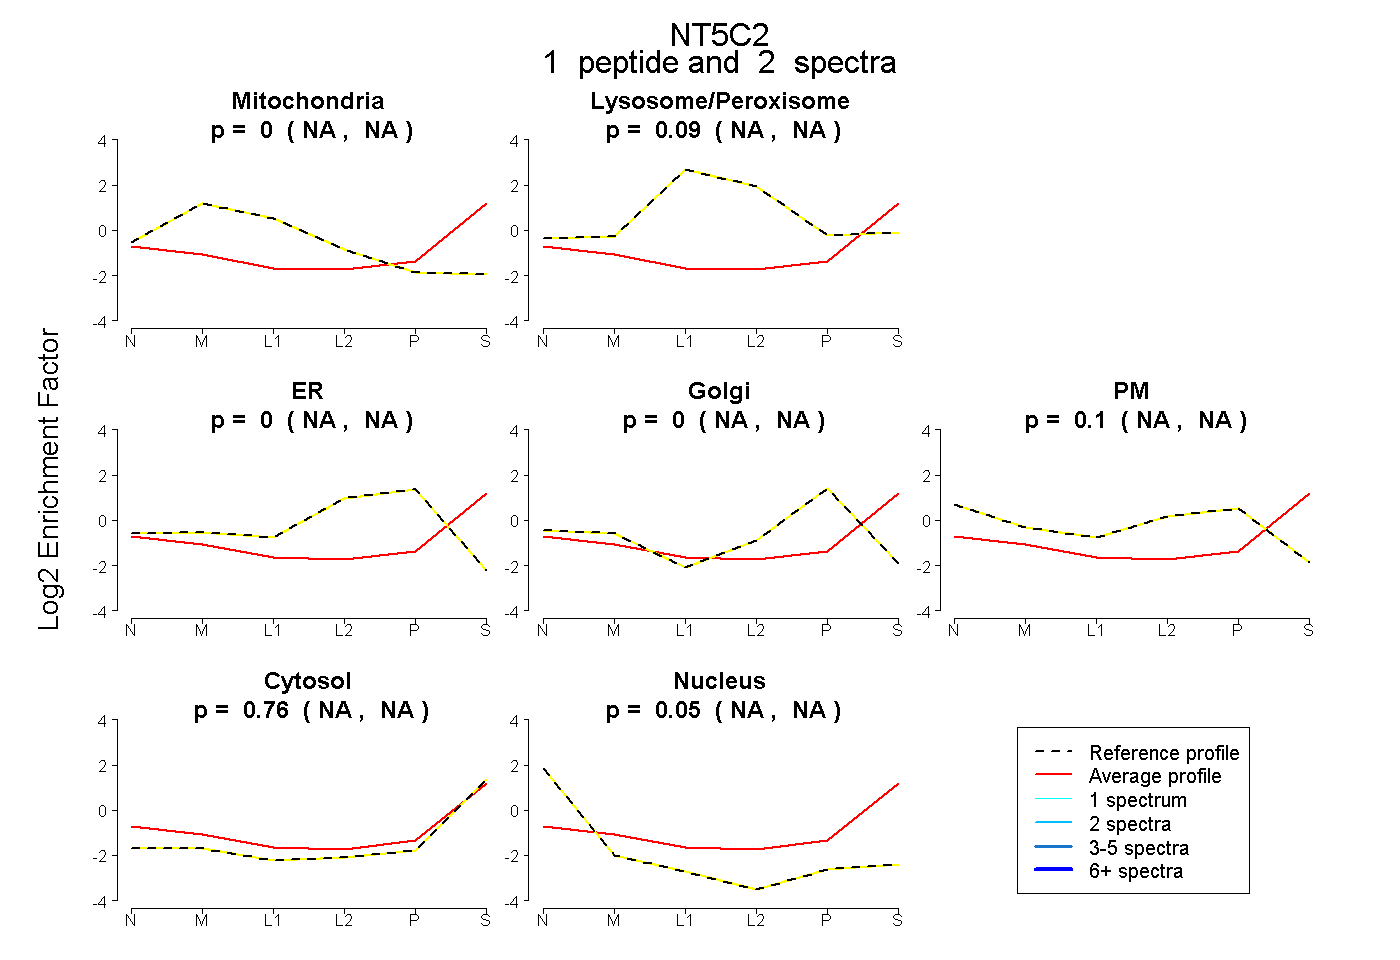
NA | NA
NA | NA
NA | NA
NA | NA
NA | NA
NA | NA
NA | NA
11peptides
spectra
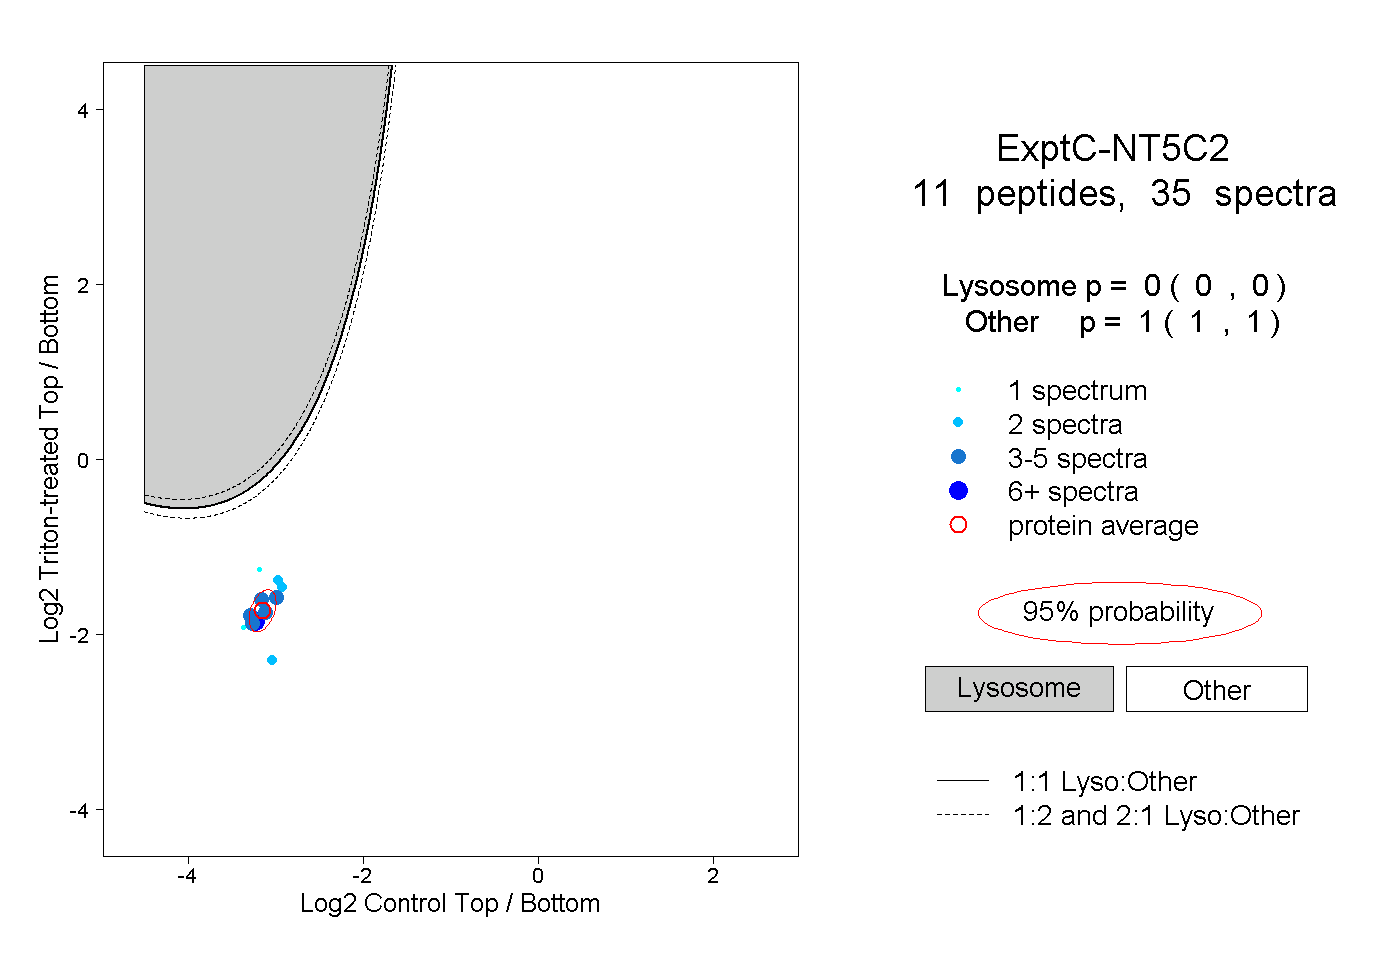
0.000 | 0.000
1.000 | 1.000