NT5C2
[ENSRNOP00000027351]
Main page
| | | Plot |
Mito |
Lyso |
|
Perox |
ER |
Golgi |
PM |
Cytosol |
Nucleus |
|
| Expt A |
 11
11
peptides |
23
spectra |
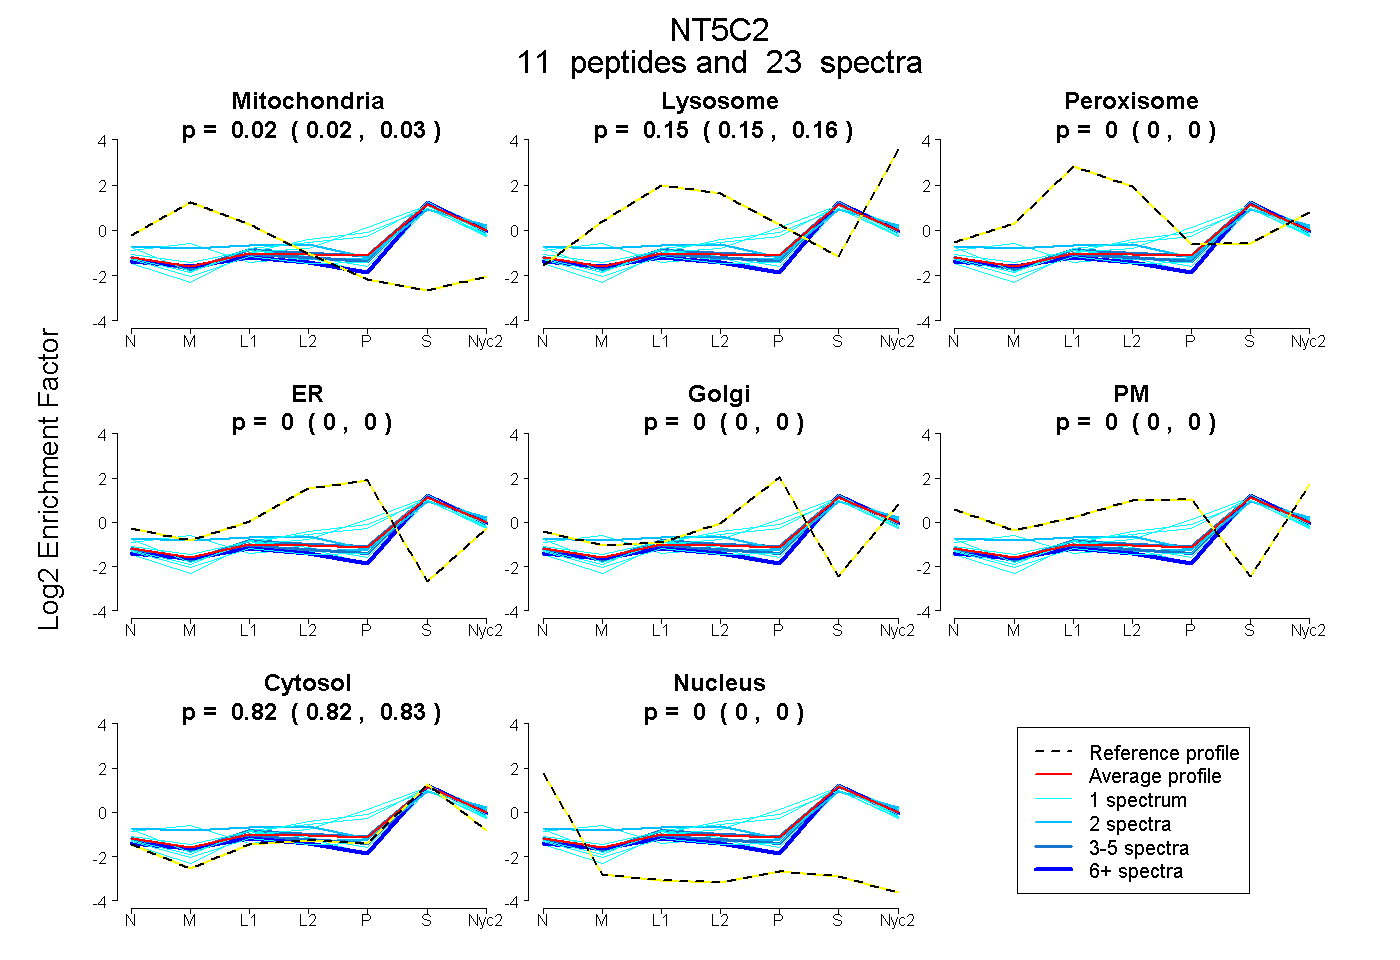 |
0.023
0.016 | 0.028 |
0.153
0.148 | 0.157 |
|
0.000
0.000 | 0.000 |
0.000
0.000 | 0.000 |
0.000
0.000 | 0.000 |
0.000
0.000 | 0.000 |
0.824
0.818 | 0.829 |
0.000
0.000 | 0.000 |
|
| | | Plot |
Mito |
|
Lyso or Perox |
|
ER |
Golgi |
PM |
Cytosol |
Nucleus |
|
| Expt B |
1
peptide |
2
spectra |
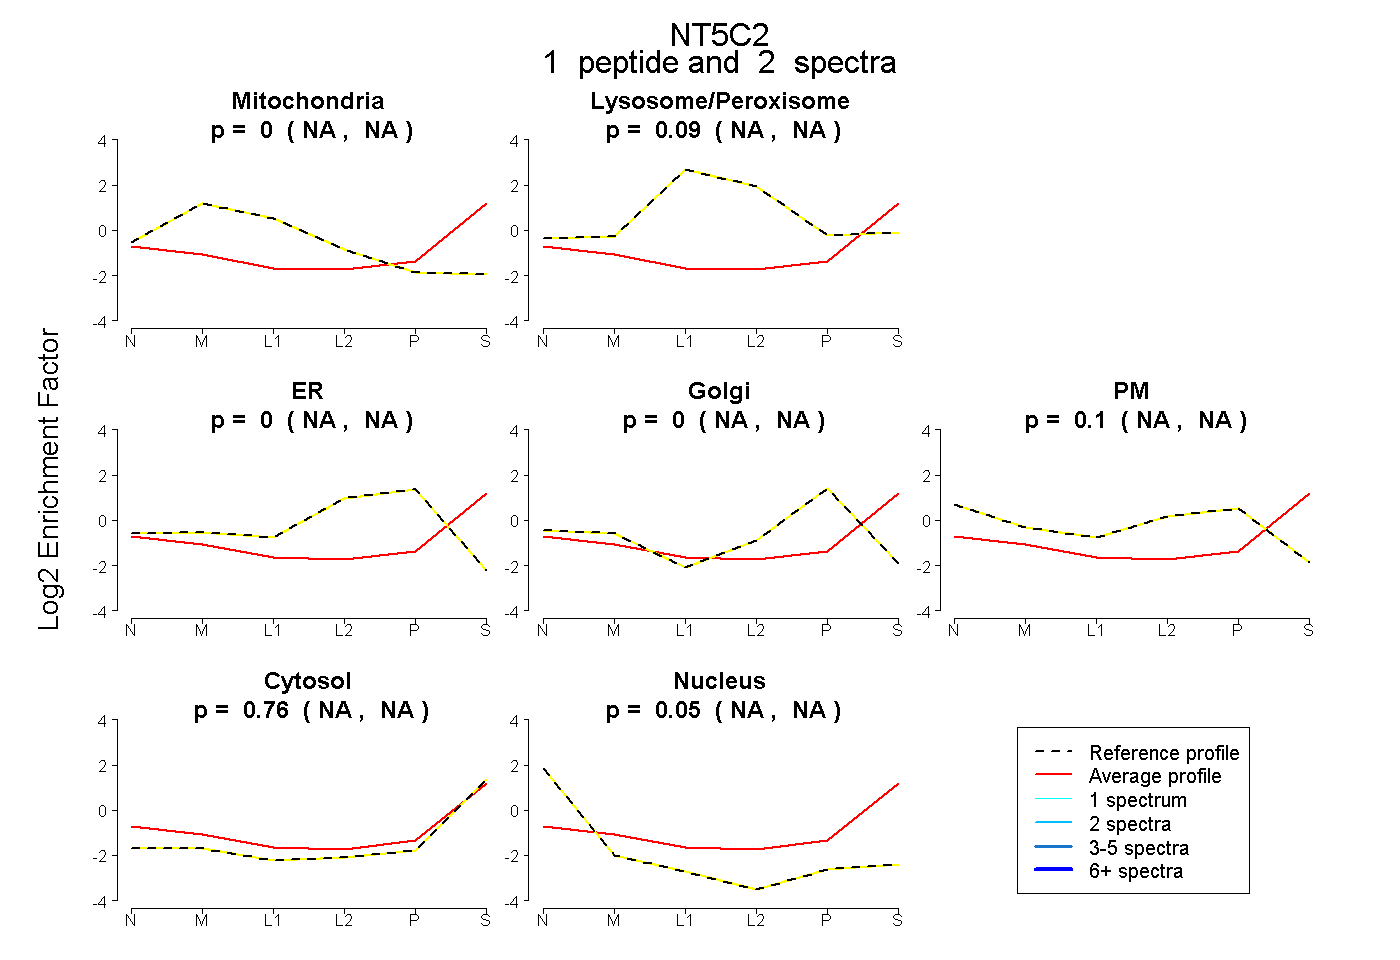 |
0.000
NA | NA |
|
0.088
NA | NA |
|
0.000
NA | NA |
0.000
NA | NA |
0.098
NA | NA |
0.765
NA | NA |
0.049
NA | NA |
|
| | | Plot |
|
Lyso |
|
|
|
|
|
|
|
Other |
| Expt C |
11
peptides |
35
spectra |
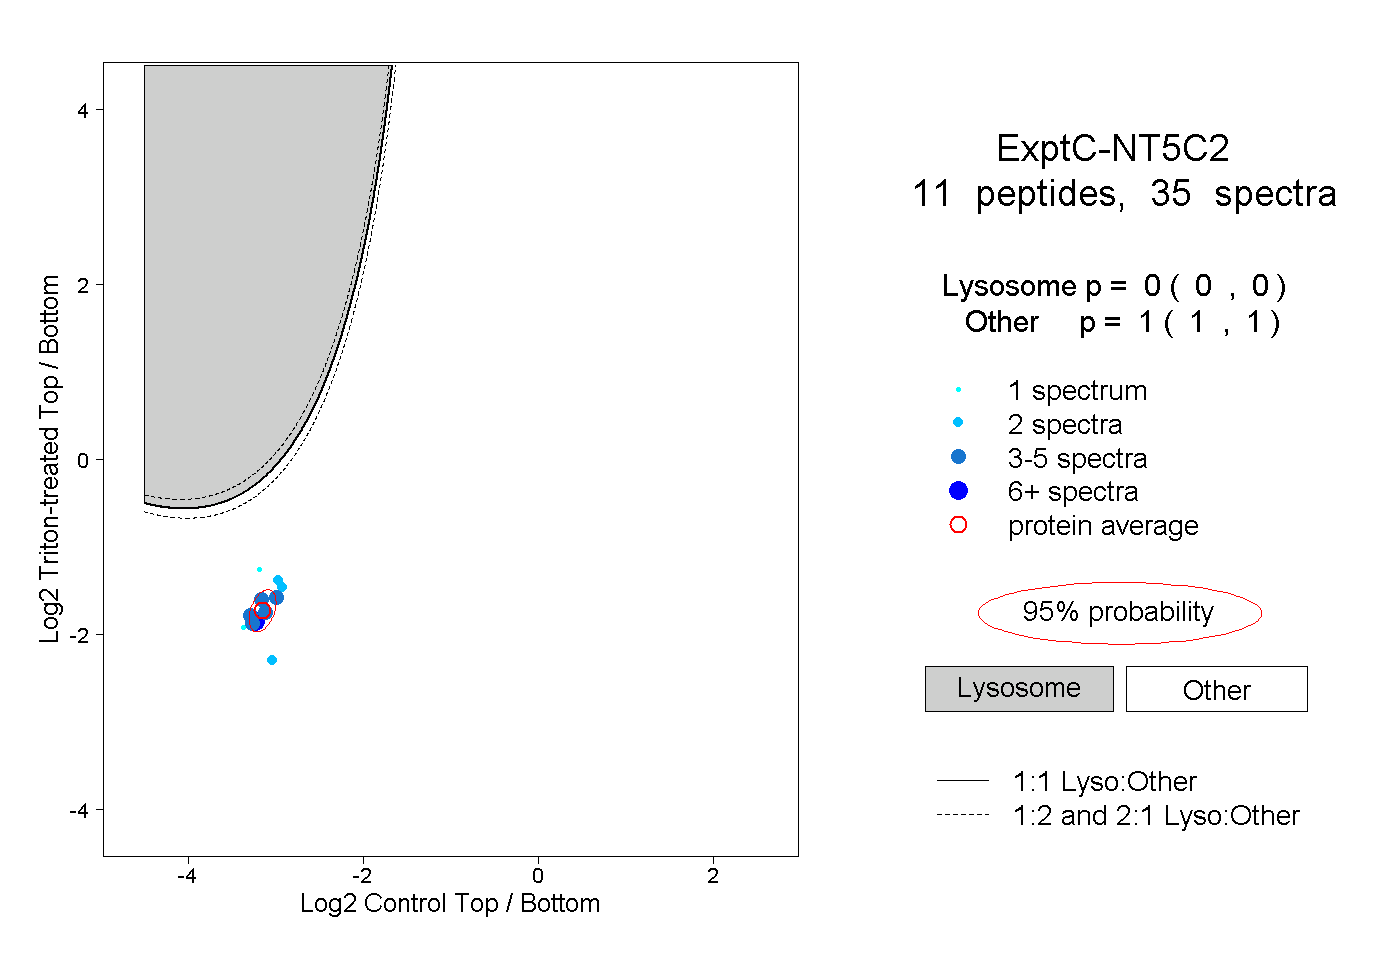 |
|
0.000
0.000 | 0.000 |
|
|
|
|
|
|
|
1.000
1.000 | 1.000 |
| 1 spectrum, QTLFASQVMR |
|
0.000 |
|
|
|
|
|
|
|
1.000 |
| 2 spectra, DGDLFMSYR |
|
0.000 |
|
|
|
|
|
|
|
1.000 |
| 1 spectrum, SMFQDVR |
|
0.000 |
|
|
|
|
|
|
|
1.000 |
| 2 spectra, TSVDFK |
|
0.000 |
|
|
|
|
|
|
|
1.000 |
| 2 spectra, YTSCDTGFK |
|
0.000 |
|
|
|
|
|
|
|
1.000 |
| 6 spectra, DAVDWVHYK |
|
0.000 |
|
|
|
|
|
|
|
1.000 |
| 4 spectra, EQYPNK |
|
0.000 |
|
|
|
|
|
|
|
1.000 |
| 4 spectra, TVENLEK |
|
0.000 |
|
|
|
|
|
|
|
1.000 |
| 5 spectra, LPLLLSR |
|
0.000 |
|
|
|
|
|
|
|
1.000 |
| 4 spectra, KPLFFGEGTVLR |
|
0.000 |
|
|
|
|
|
|
|
1.000 |
| 4 spectra, VFLATNSDYK |
|
0.000 |
|
|
|
|
|
|
|
1.000 |