 10
10peptides
spectra
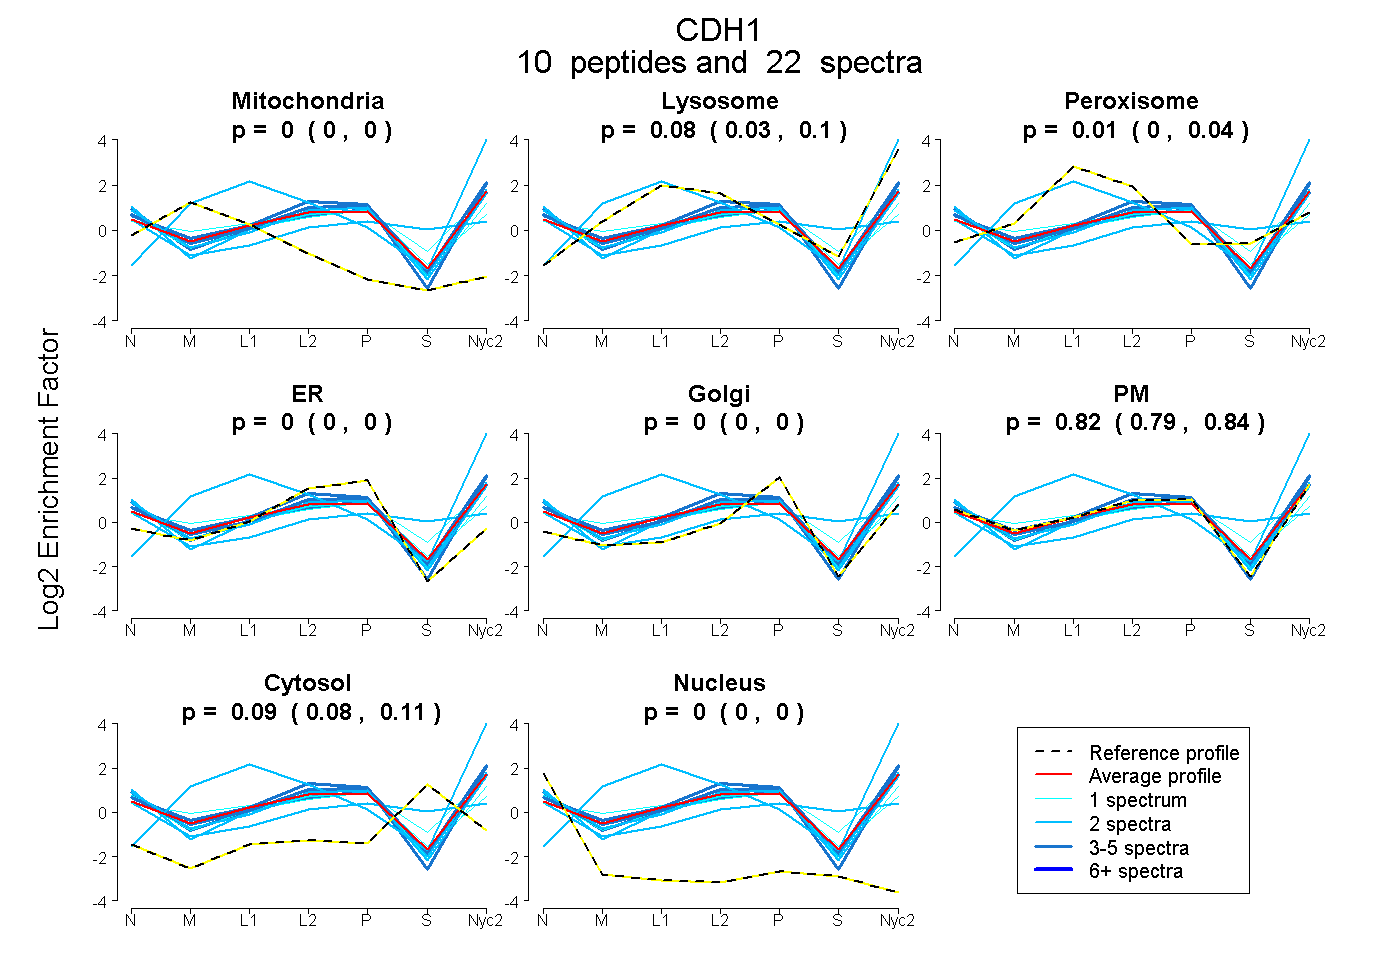
0.000 | 0.000
0.031 | 0.103
0.000 | 0.044
0.000 | 0.000
0.000 | 0.000
0.792 | 0.841
0.079 | 0.106
0.000 | 0.000
4peptides
spectra
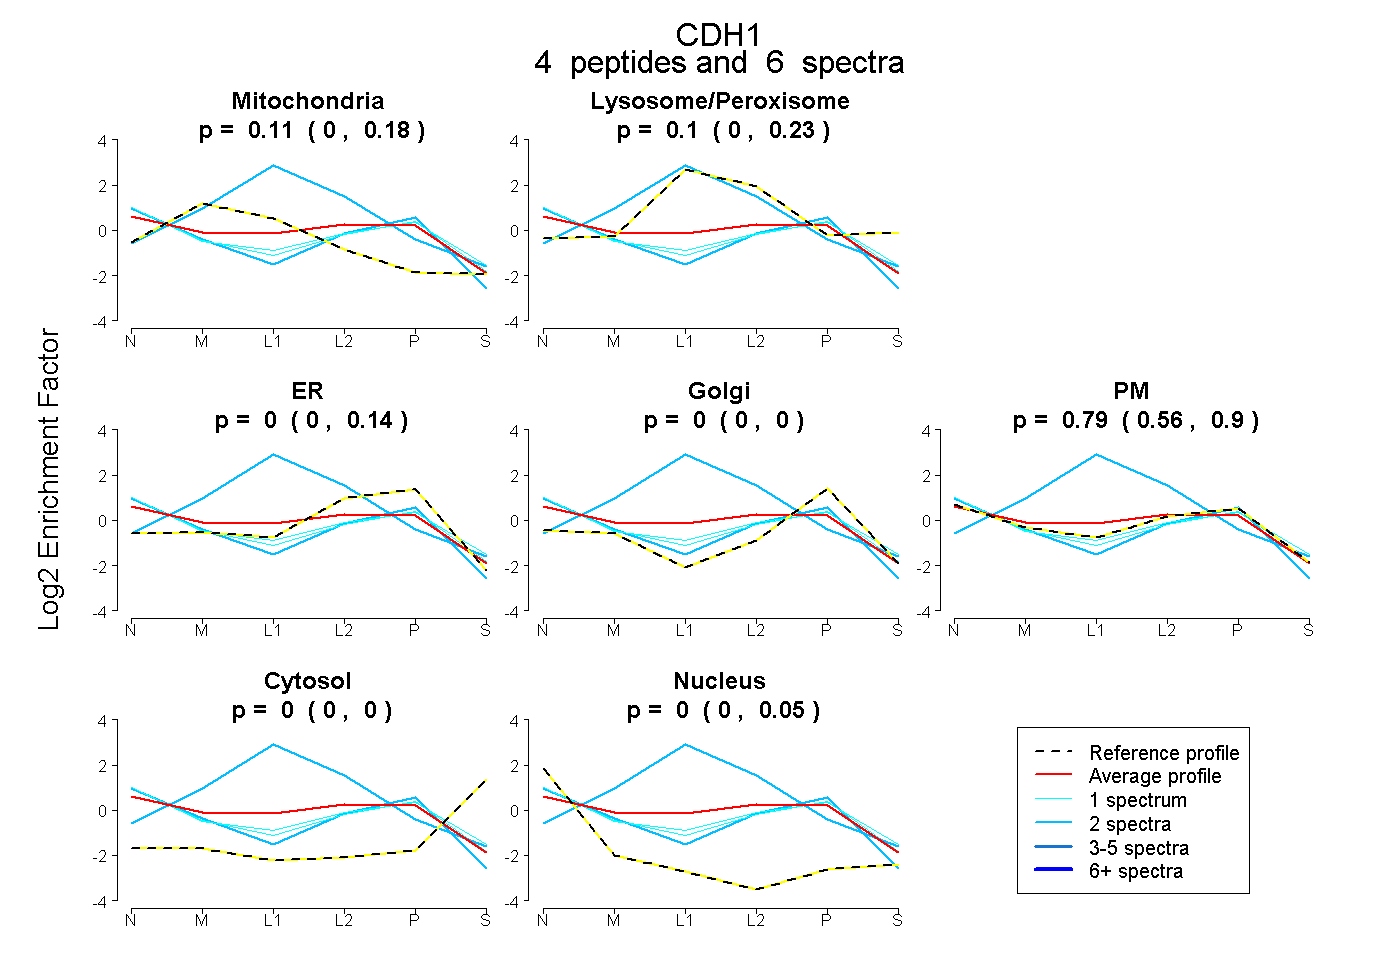
0.004 | 0.177
0.000 | 0.228
0.000 | 0.143
0.000 | 0.004
0.560 | 0.895
0.000 | 0.000
0.000 | 0.046
15peptides
spectra
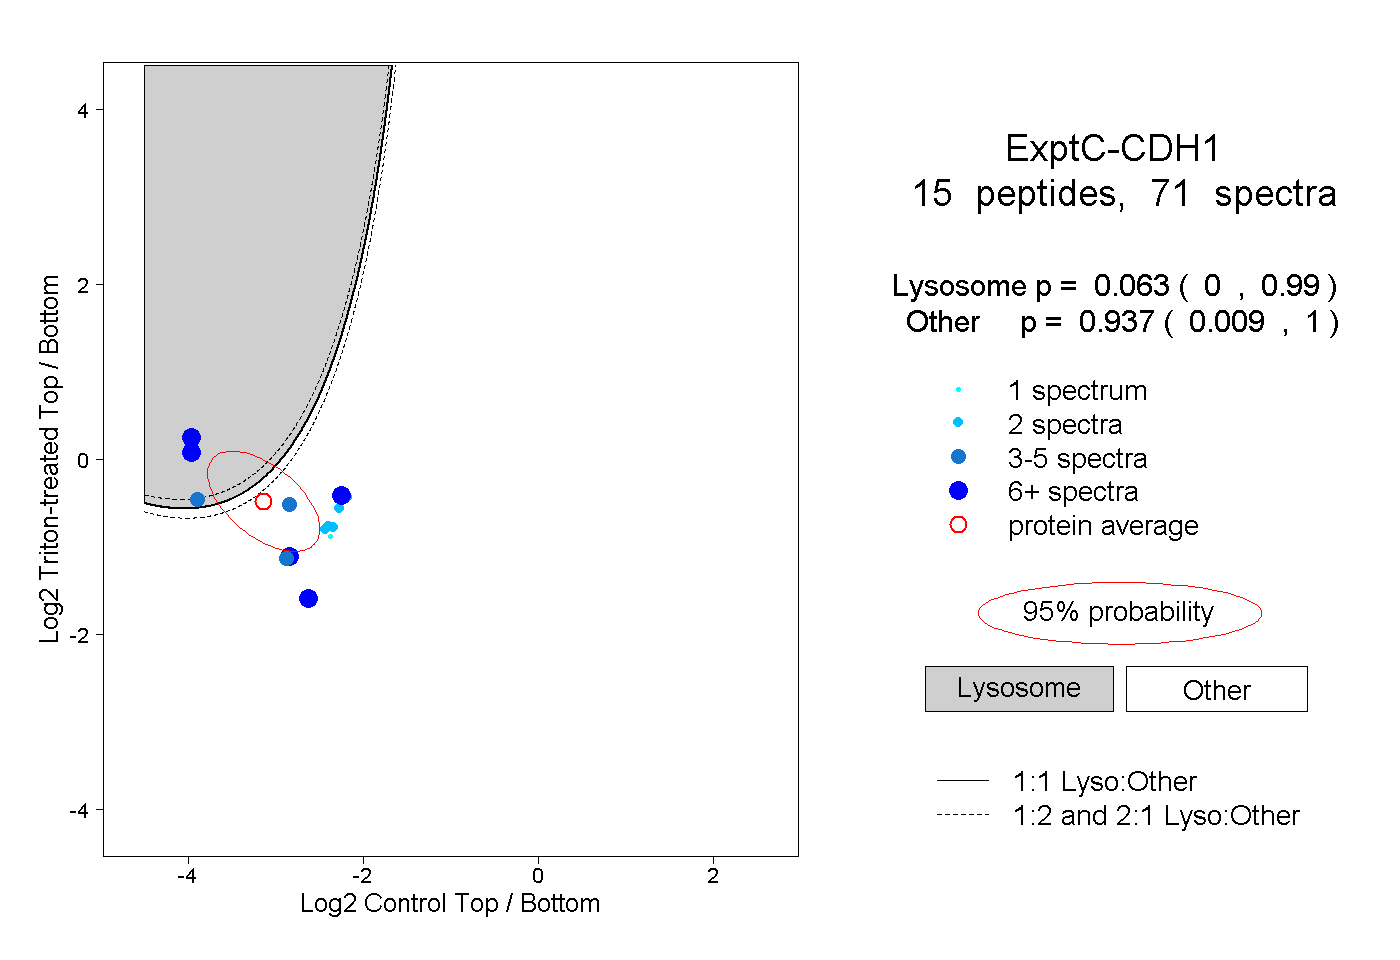
0.000 | 0.990
0.009 | 1.000
1peptide
spectrum
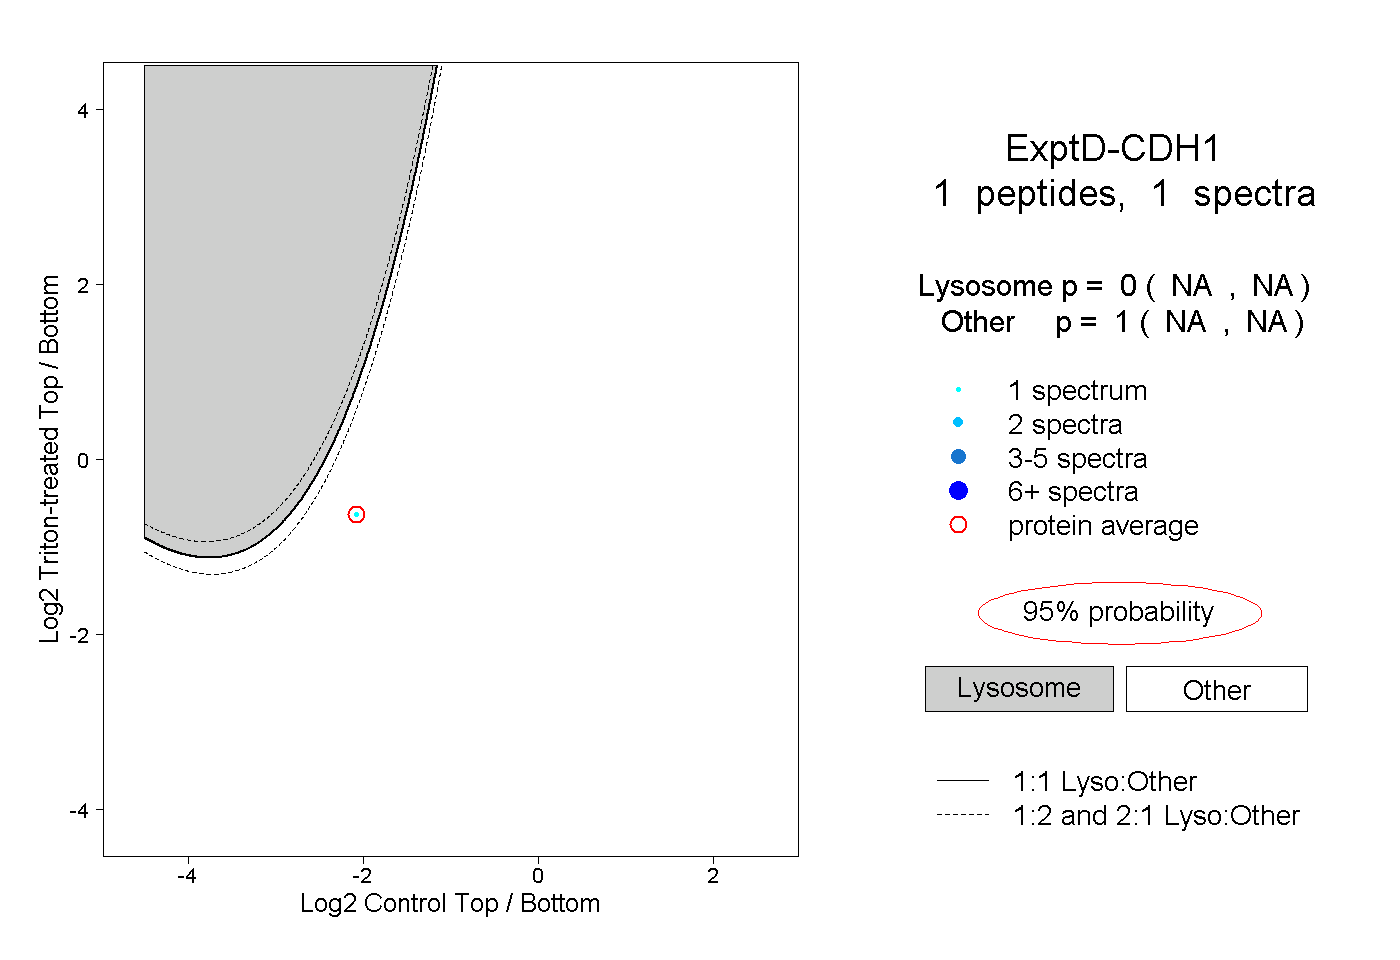
NA | NA
NA | NA