 10
10peptides
spectra
0.000 | 0.000
0.031 | 0.103
0.000 | 0.044
0.000 | 0.000
0.000 | 0.000
0.792 | 0.841
0.079 | 0.106
0.000 | 0.000
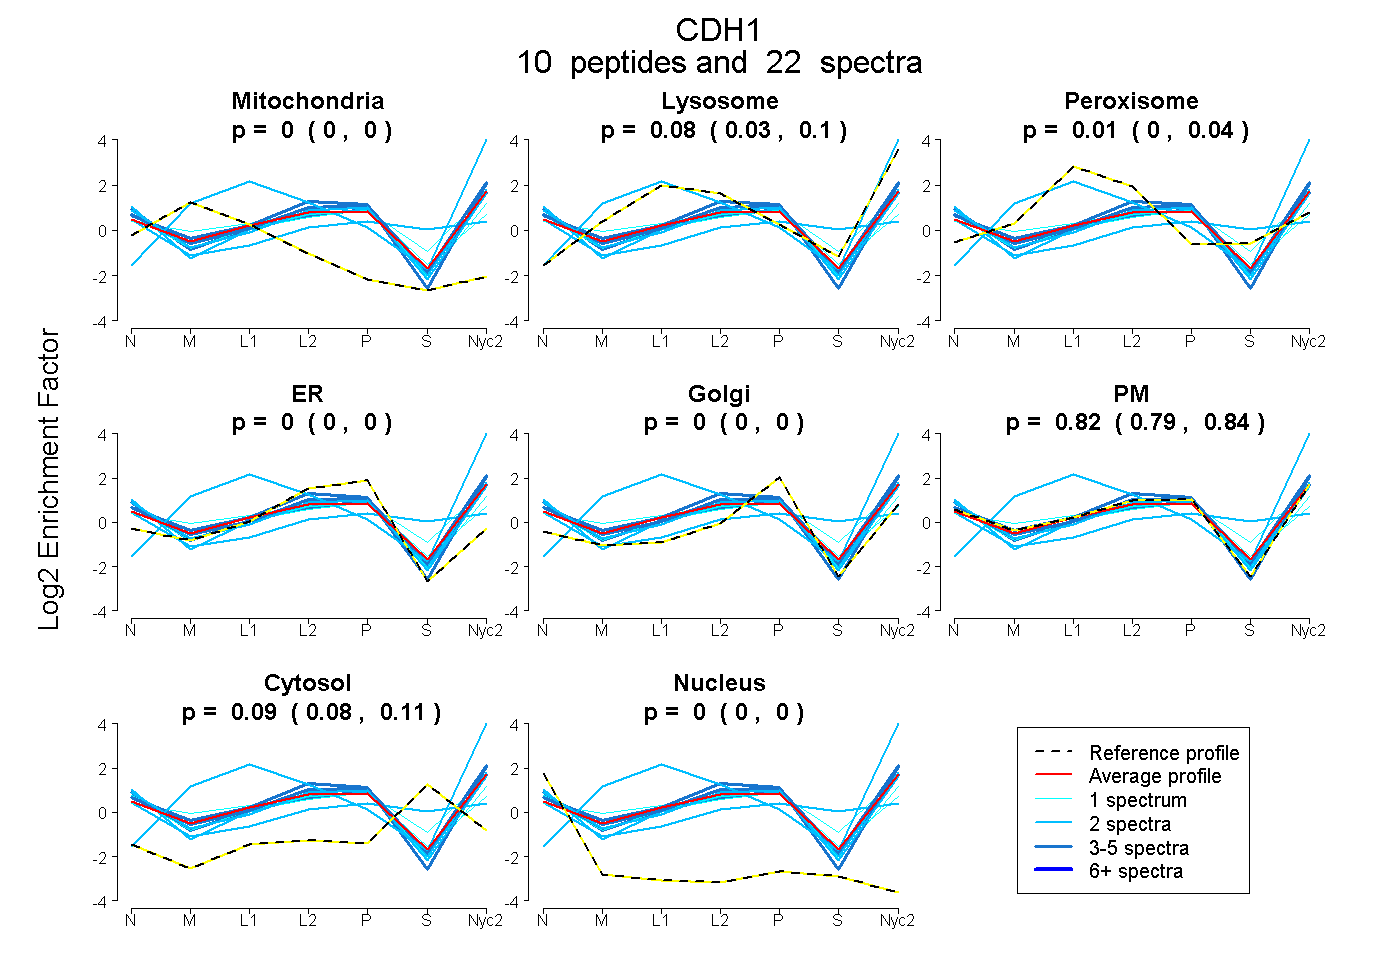
| Plot | Mito | Lyso | Perox | ER | Golgi | PM | Cytosol | Nucleus | |||||
| Expt A |
10 peptides |
22 spectra |
|
0.000 0.000 | 0.000 |
0.076 0.031 | 0.103 |
0.010 0.000 | 0.044 |
0.000 0.000 | 0.000 |
0.000 0.000 | 0.000 |
0.819 0.792 | 0.841 |
0.095 0.079 | 0.106 |
0.000 0.000 | 0.000 |
| 4 spectra, DTGVISVVTSGLDR | 0.000 | 0.000 | 0.000 | 0.000 | 0.000 | 0.914 | 0.082 | 0.005 | ||
| 2 spectra, VTQPLDR | 0.000 | 0.000 | 0.000 | 0.000 | 0.000 | 0.946 | 0.030 | 0.024 | ||
| 3 spectra, NMQFCQR | 0.000 | 0.035 | 0.000 | 0.000 | 0.000 | 0.965 | 0.000 | 0.000 | ||
| 1 spectrum, GLDFEAK | 0.041 | 0.000 | 0.110 | 0.019 | 0.171 | 0.659 | 0.000 | 0.000 | ||
| 2 spectra, TAFFSEDSR | 0.003 | 0.997 | 0.000 | 0.000 | 0.000 | 0.000 | 0.000 | 0.000 | ||
| 4 spectra, NMFTVNR | 0.000 | 0.066 | 0.000 | 0.000 | 0.000 | 0.896 | 0.039 | 0.000 | ||
| 2 spectra, EPDTFMEQK | 0.000 | 0.000 | 0.000 | 0.000 | 0.000 | 0.914 | 0.063 | 0.022 | ||
| 1 spectrum, ETGWLK | 0.000 | 0.065 | 0.015 | 0.000 | 0.000 | 0.740 | 0.180 | 0.000 | ||
| 1 spectrum, DWVIPPINCPENQK | 0.000 | 0.000 | 0.070 | 0.103 | 0.000 | 0.671 | 0.110 | 0.047 | ||
| 2 spectra, GLDARPEVIR | 0.000 | 0.000 | 0.002 | 0.000 | 0.000 | 0.546 | 0.452 | 0.000 |
| Plot | Mito | Lyso or Perox | ER | Golgi | PM | Cytosol | Nucleus | ||||||
| Expt B |
4 peptides |
6 spectra |
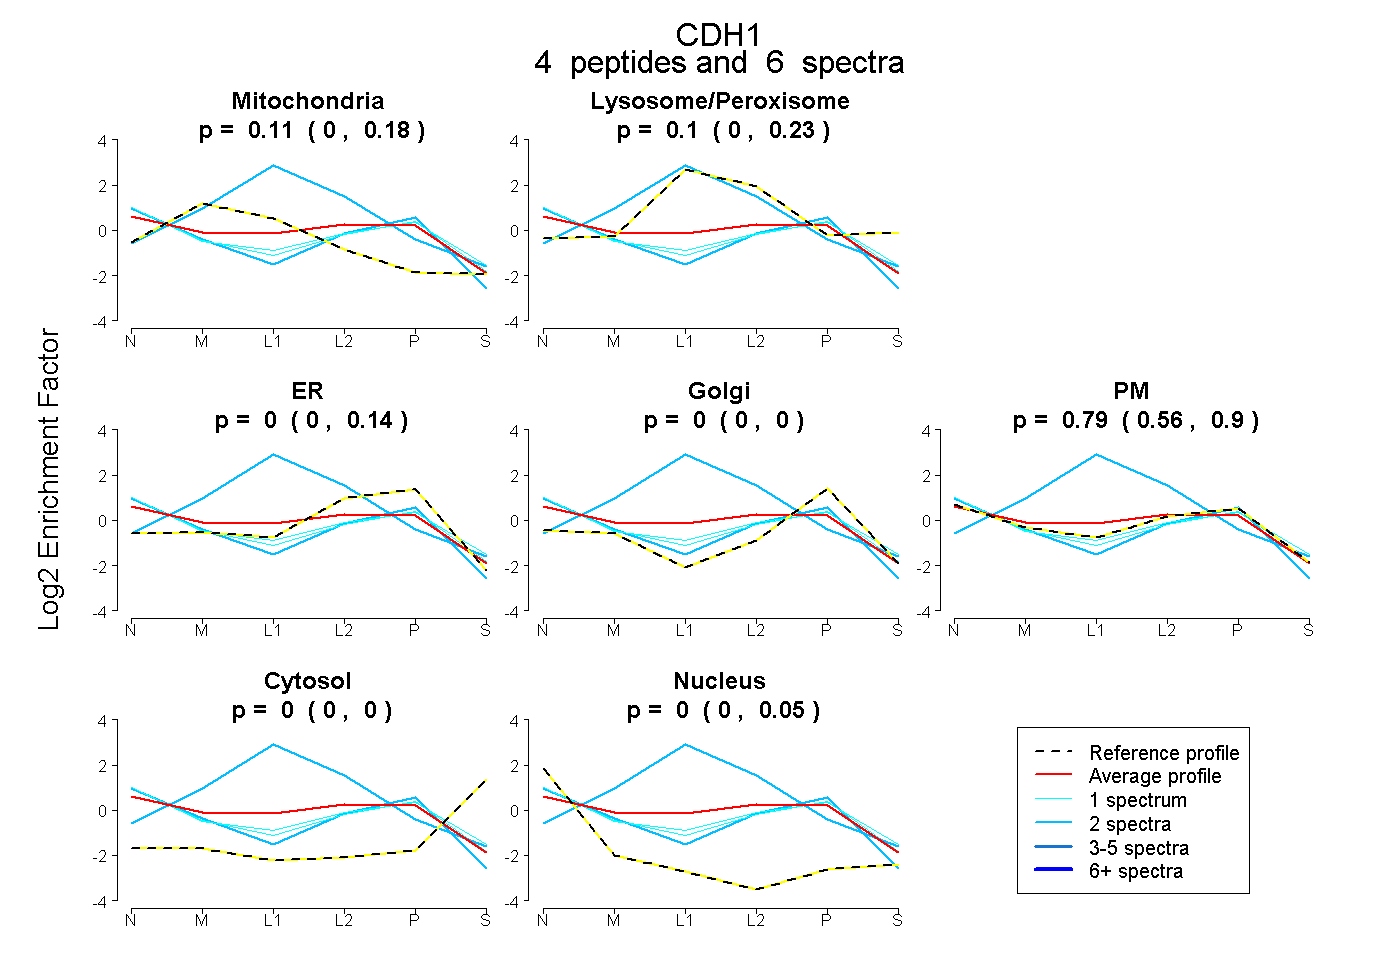 |
0.107 0.004 | 0.177 |
0.103 0.000 | 0.228 |
0.000 0.000 | 0.143 |
0.000 0.000 | 0.004 |
0.791 0.560 | 0.895 |
0.000 0.000 | 0.000 |
0.000 0.000 | 0.046 |
|||
| Plot | Lyso | Other | |||||||||||
| Expt C |
15 peptides |
71 spectra |
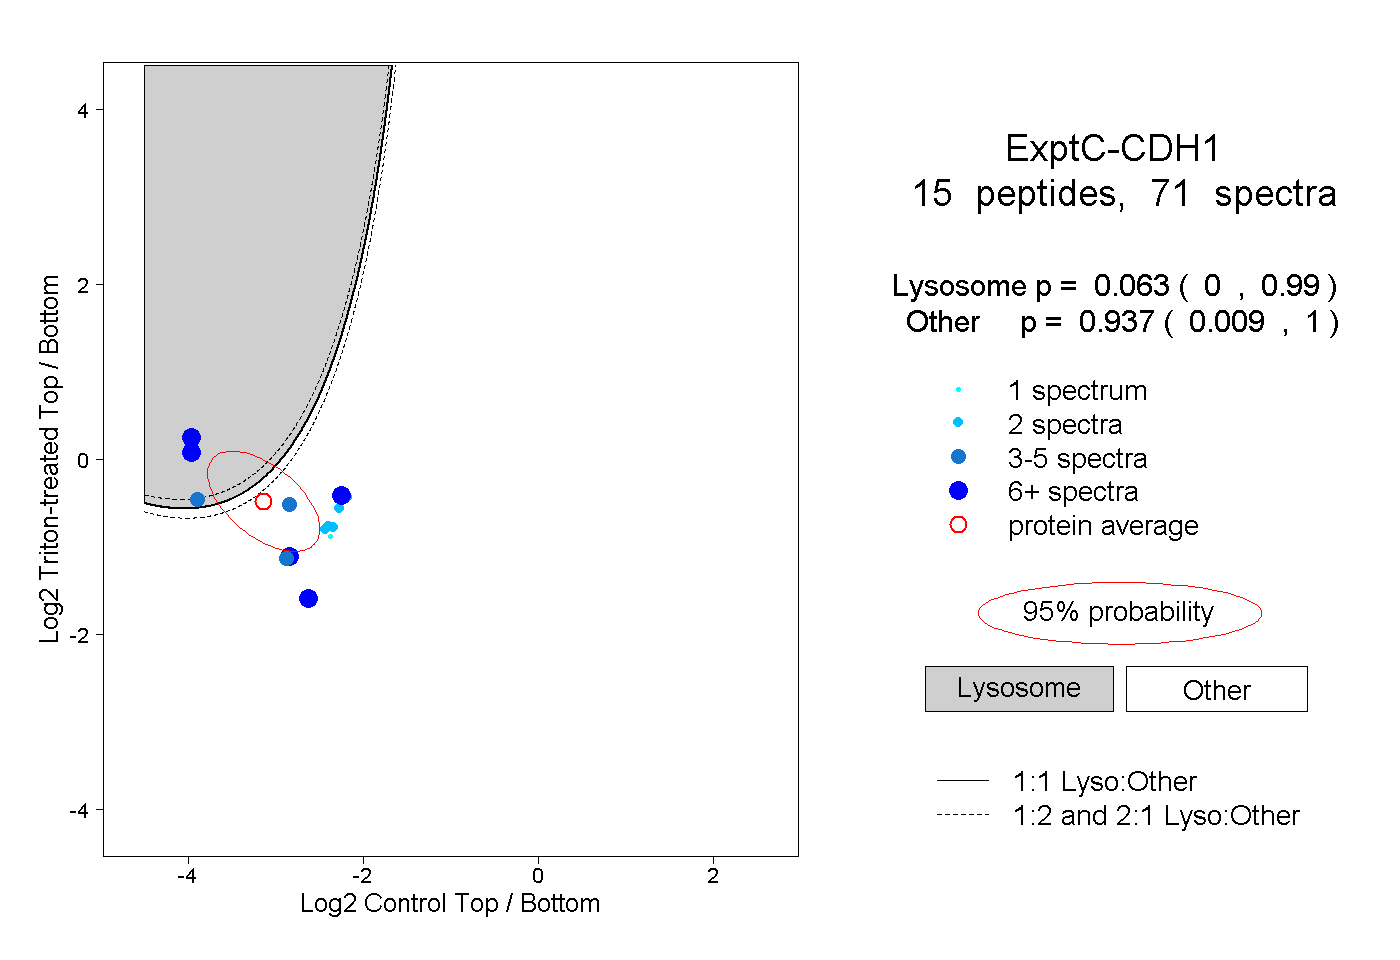 |
0.063 0.000 | 0.990 |
0.937 0.009 | 1.000 |
||||||||
| Plot | Lyso | Other | |||||||||||
| Expt D |
1 peptide |
1 spectrum |
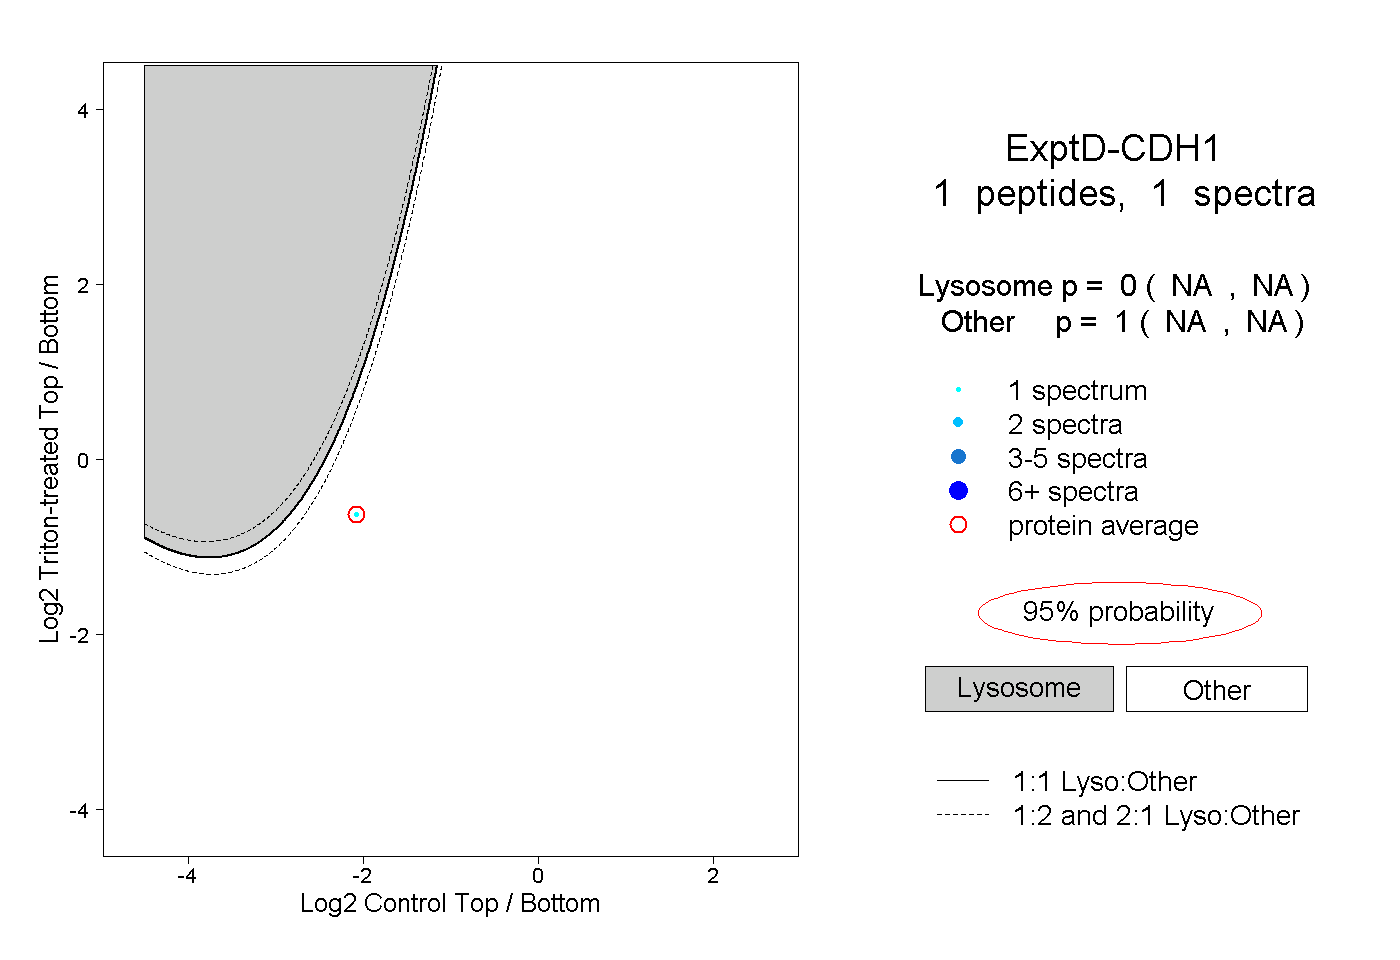 |
0.000 NA | NA |
1.000 NA | NA |