CDH1
[ENSRNOP00000027346]
Main page
| | | Plot |
Mito |
Lyso |
|
Perox |
ER |
Golgi |
PM |
Cytosol |
Nucleus |
|
| Expt A |
 10
10
peptides |
22
spectra |
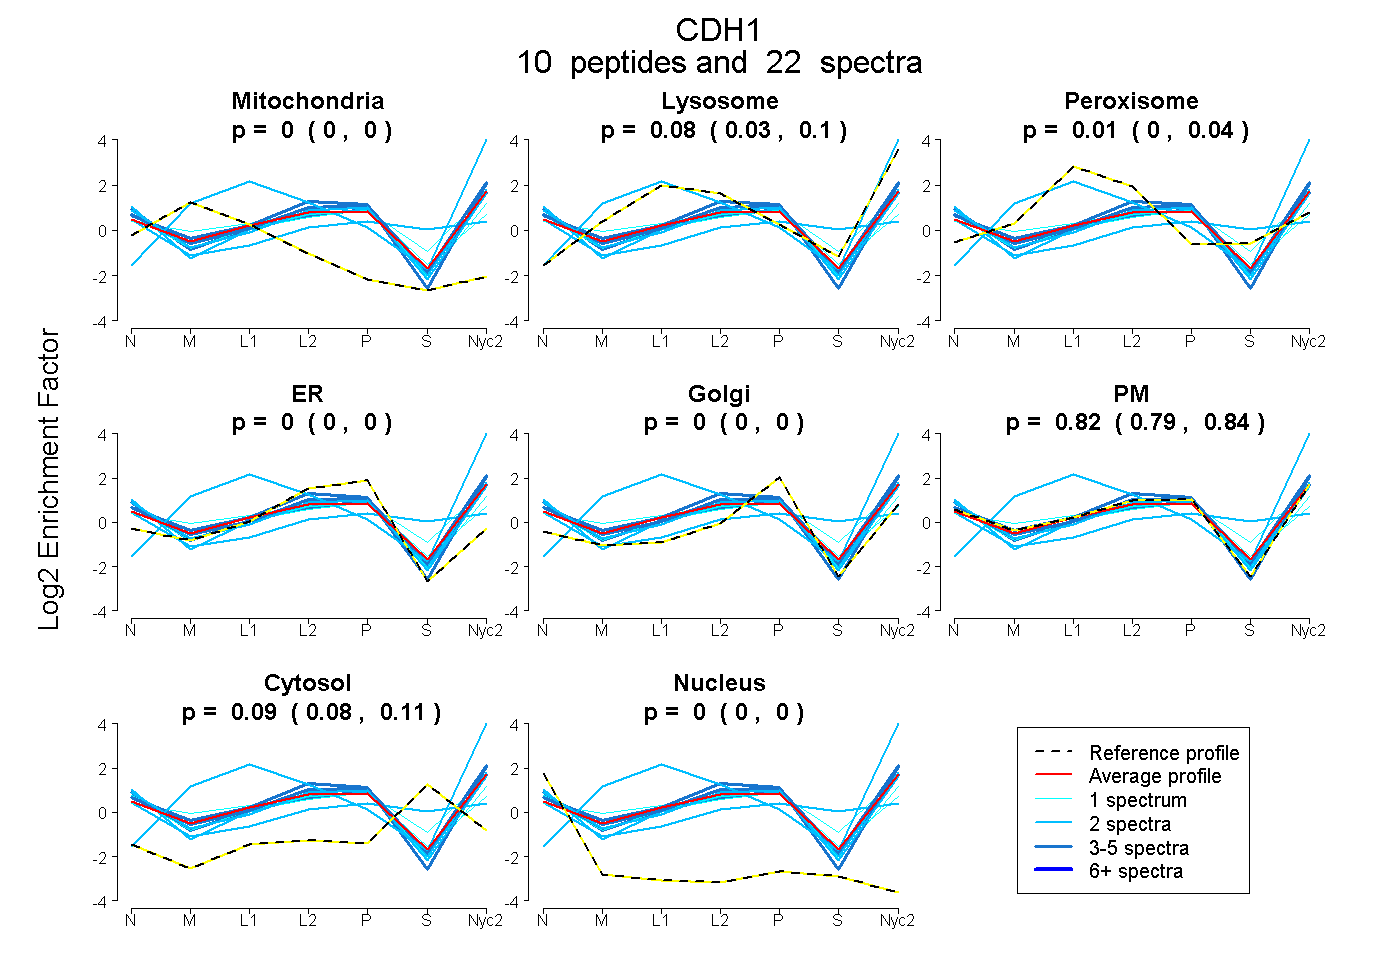 |
0.000
0.000 | 0.000 |
0.076
0.031 | 0.103 |
|
0.010
0.000 | 0.044 |
0.000
0.000 | 0.000 |
0.000
0.000 | 0.000 |
0.819
0.792 | 0.841 |
0.095
0.079 | 0.106 |
0.000
0.000 | 0.000 |
|
| | | Plot |
Mito |
|
Lyso or Perox |
|
ER |
Golgi |
PM |
Cytosol |
Nucleus |
|
| Expt B |
4
peptides |
6
spectra |
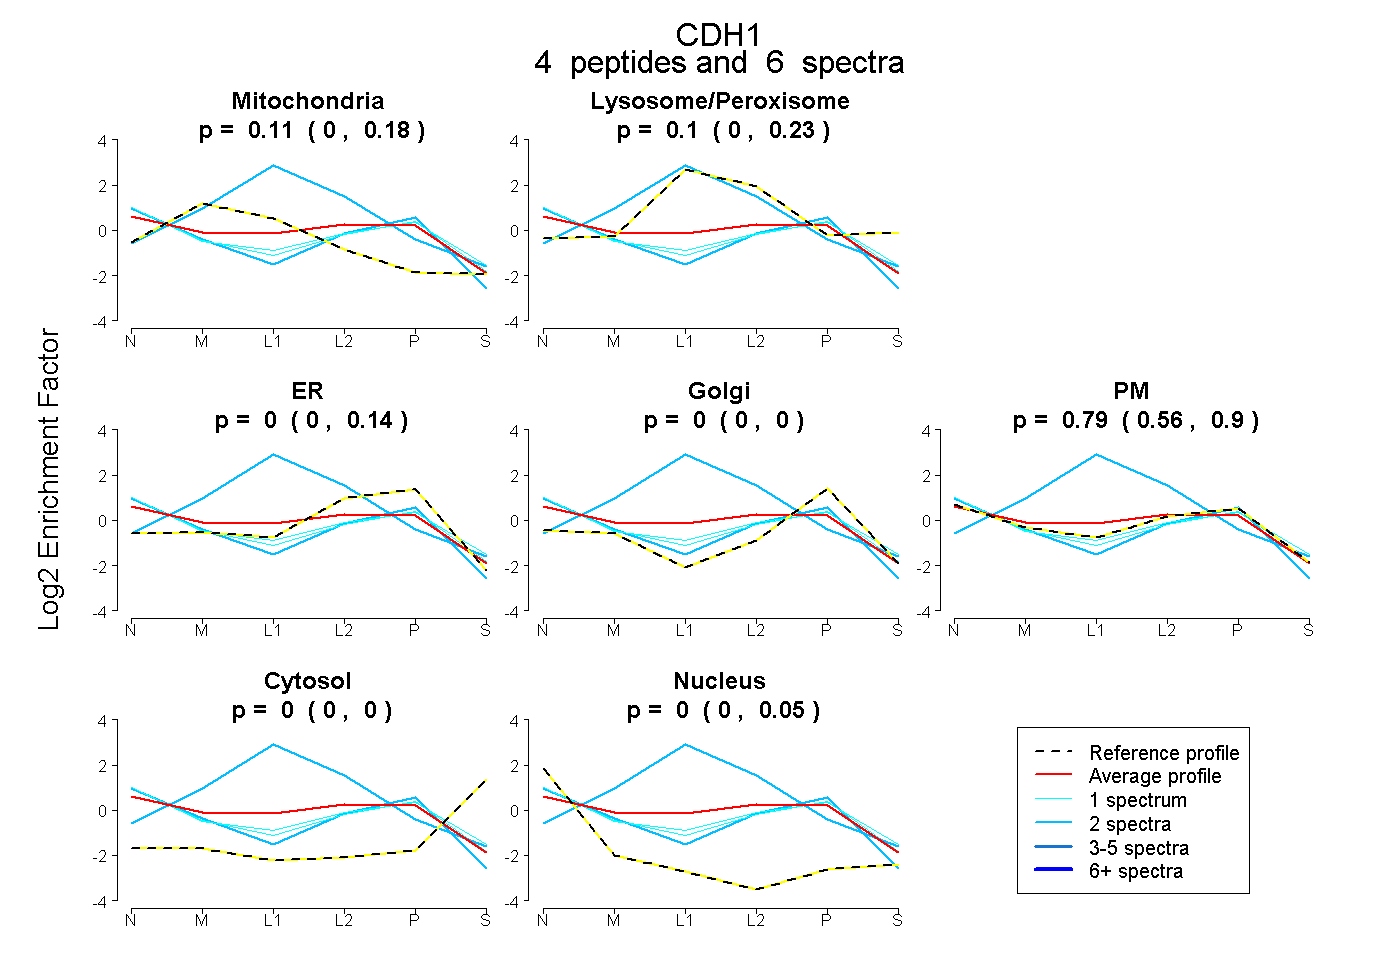 |
0.107
0.004 | 0.177 |
|
0.103
0.000 | 0.228 |
|
0.000
0.000 | 0.143 |
0.000
0.000 | 0.004 |
0.791
0.560 | 0.895 |
0.000
0.000 | 0.000 |
0.000
0.000 | 0.046 |
|
| 1 spectrum, VTQPLDR |
0.000 |
|
0.024 |
|
0.000 |
0.000 |
0.885 |
0.022 |
0.070 |
|
| 1 spectrum, GLDFEAK |
0.000 |
|
0.000 |
|
0.000 |
0.020 |
0.888 |
0.000 |
0.091 |
|
| 2 spectra, TAFFSEDSR |
0.278 |
|
0.722 |
|
0.000 |
0.000 |
0.000 |
0.000 |
0.000 |
|
| 2 spectra, GLDARPEVIR |
0.000 |
|
0.000 |
|
0.013 |
0.153 |
0.742 |
0.000 |
0.092 |
|
| | | Plot |
|
Lyso |
|
|
|
|
|
|
|
Other |
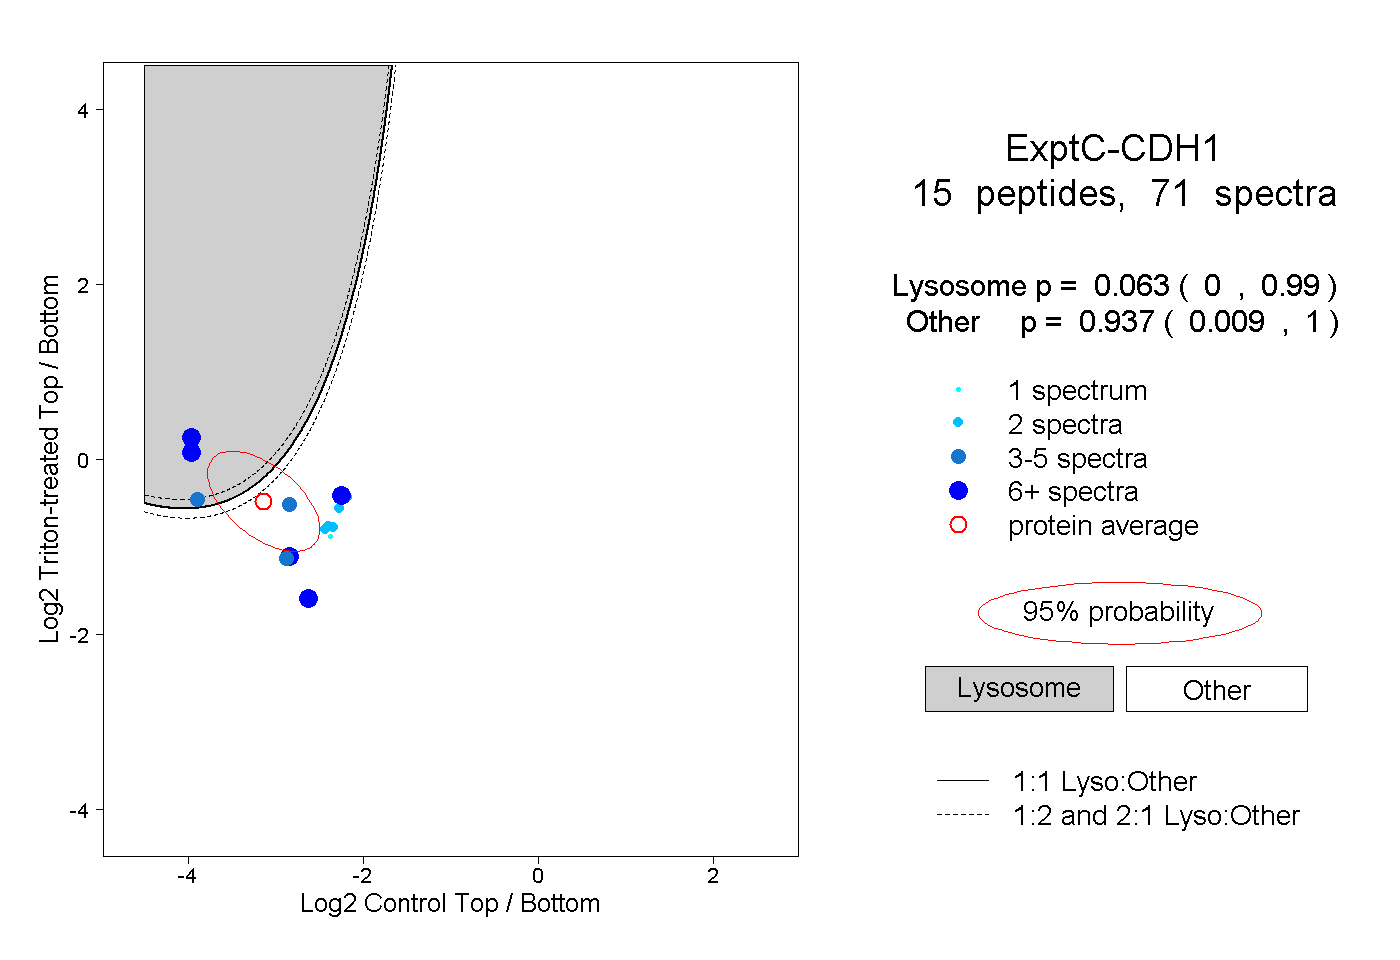
| Expt C |
15
peptides |
71
spectra |
 |
|
0.063
0.000 | 0.990 |
|
|
|
|
|
|
|
0.937
0.009 | 1.000 |
| | | Plot |
|
Lyso |
|
|
|
|
|
|
|
Other |
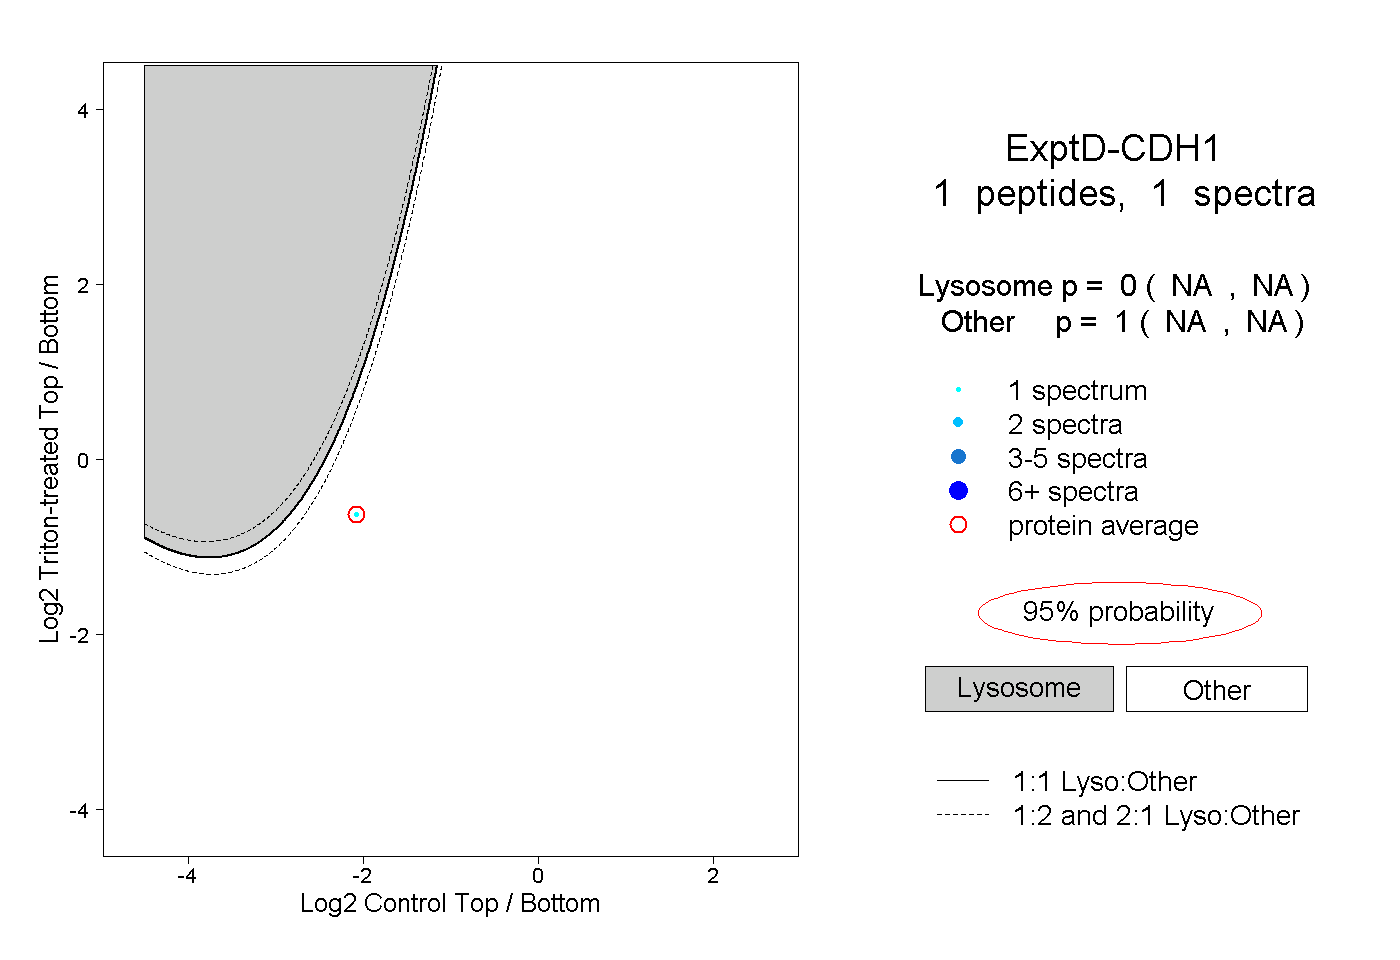
| Expt D |
1
peptide |
1
spectrum |
 |
|
0.000
NA | NA |
|
|
|
|
|
|
|
1.000
NA | NA |