 15
15peptides
spectra
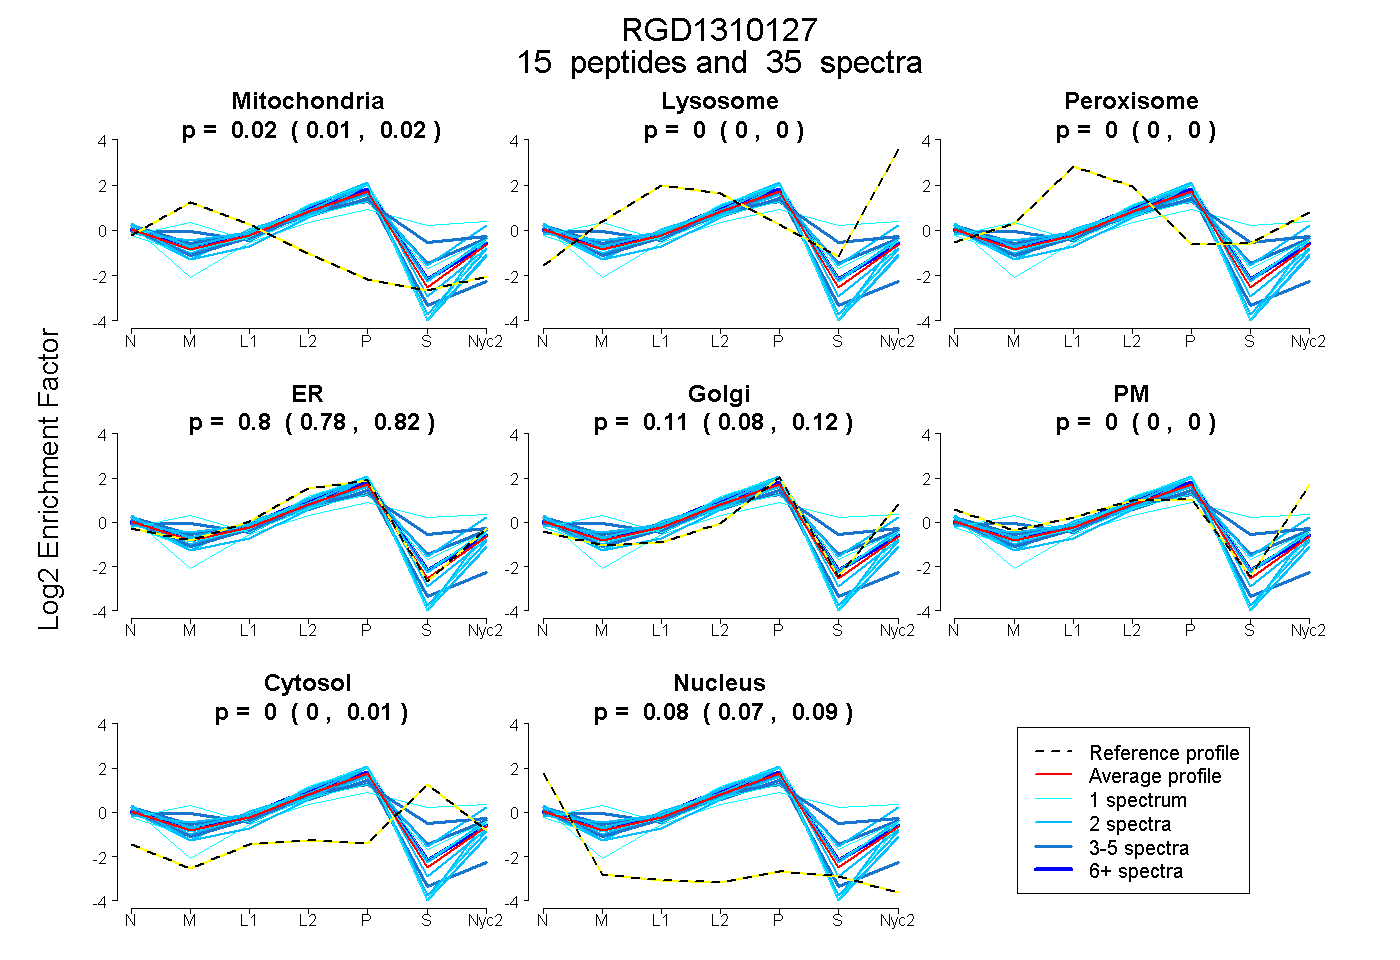
0.006 | 0.022
0.000 | 0.000
0.000 | 0.000
0.780 | 0.816
0.083 | 0.123
0.000 | 0.000
0.000 | 0.006
0.072 | 0.086
5peptides
spectra
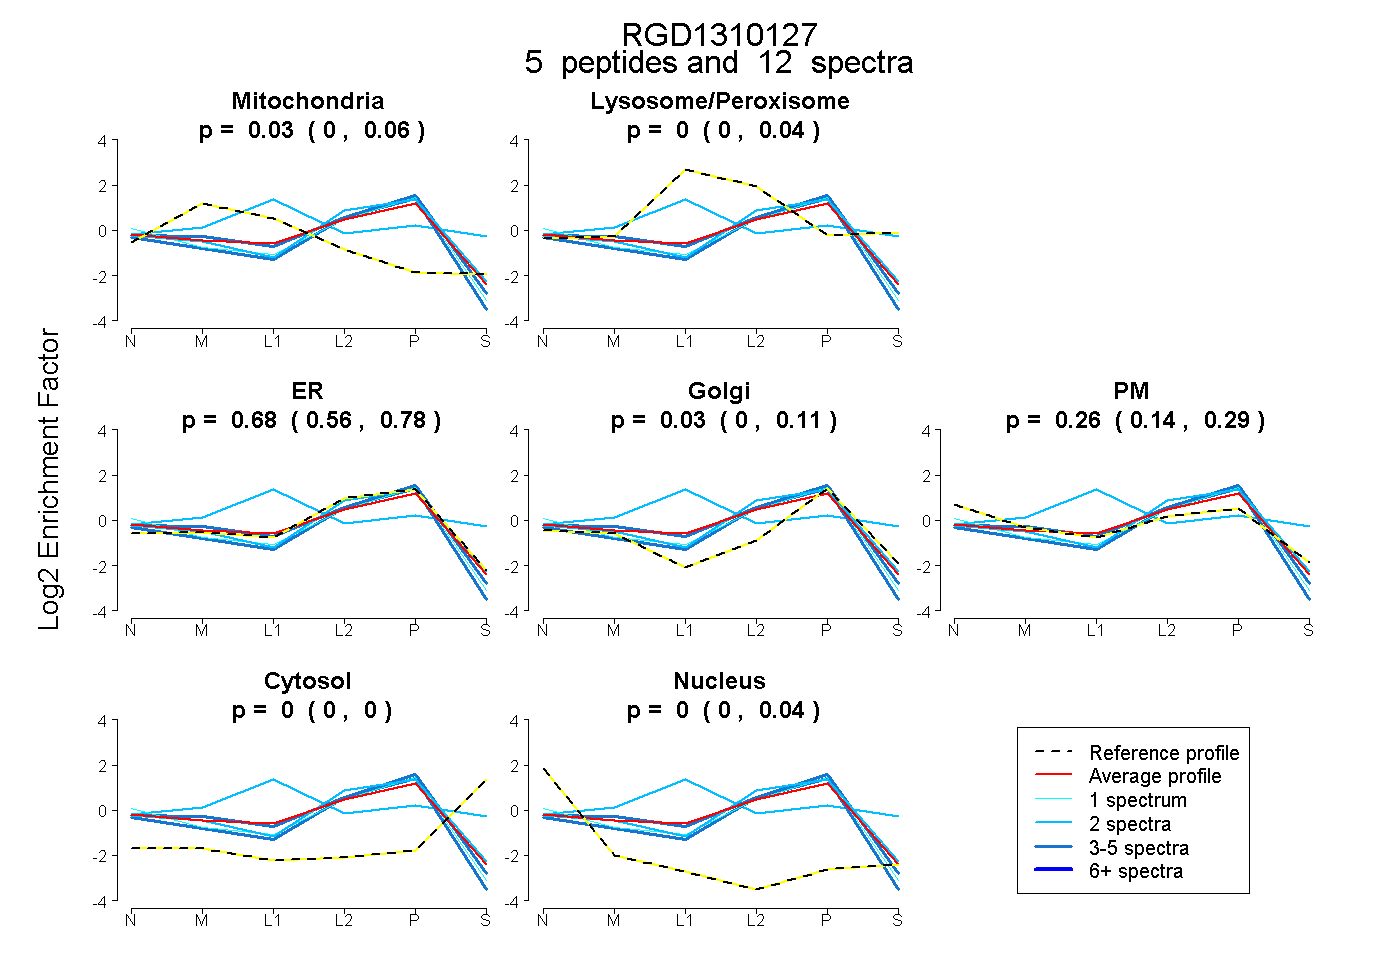
0.000 | 0.056
0.000 | 0.044
0.562 | 0.780
0.000 | 0.113
0.136 | 0.287
0.000 | 0.000
0.000 | 0.037
12peptides
spectra
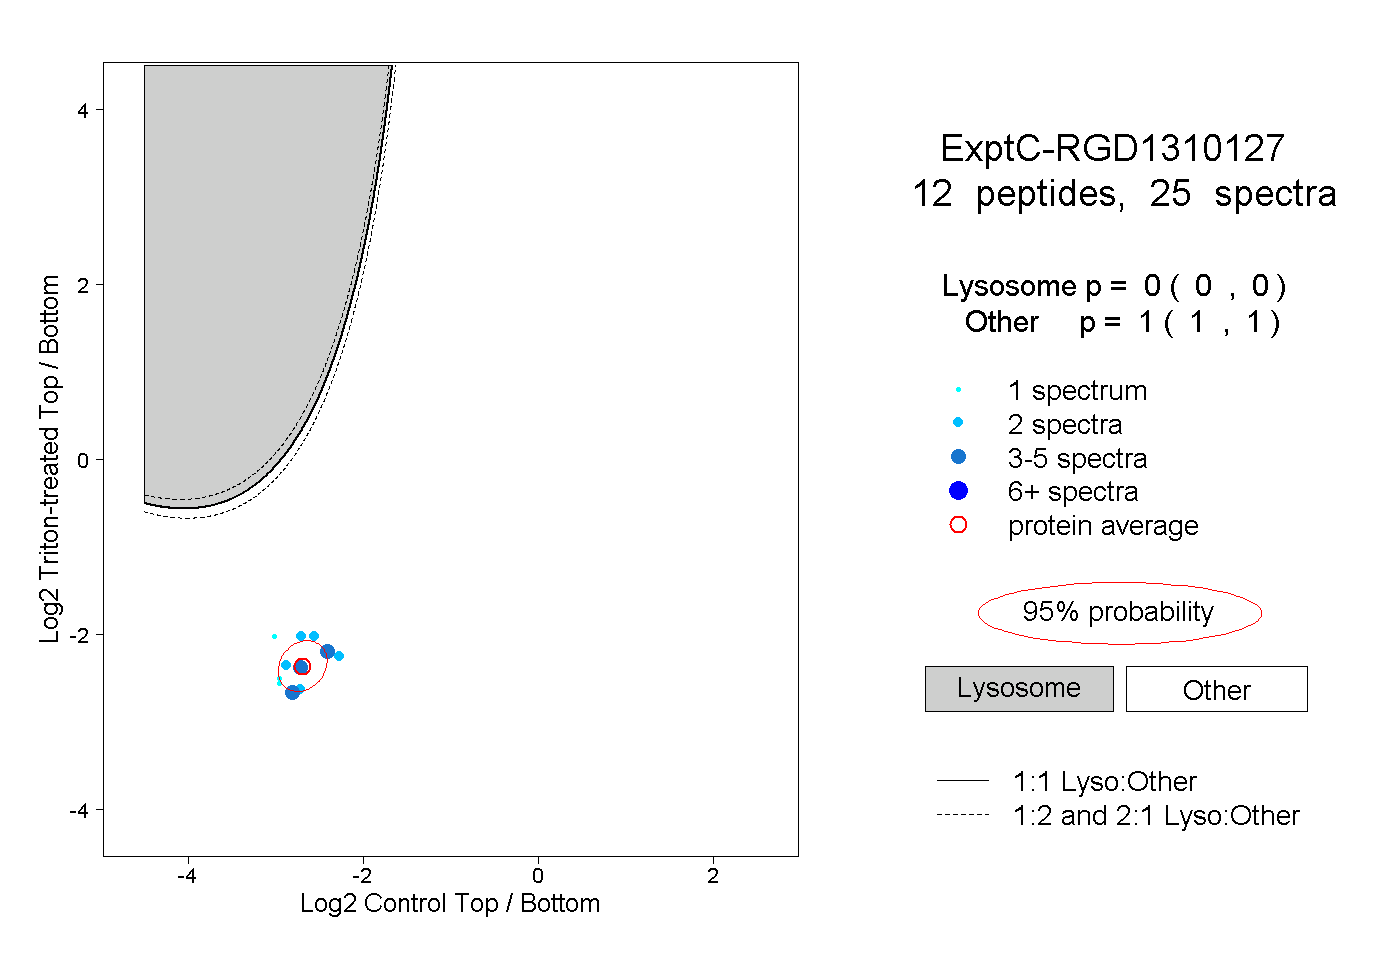
0.000 | 0.000
1.000 | 1.000
2peptides
spectra
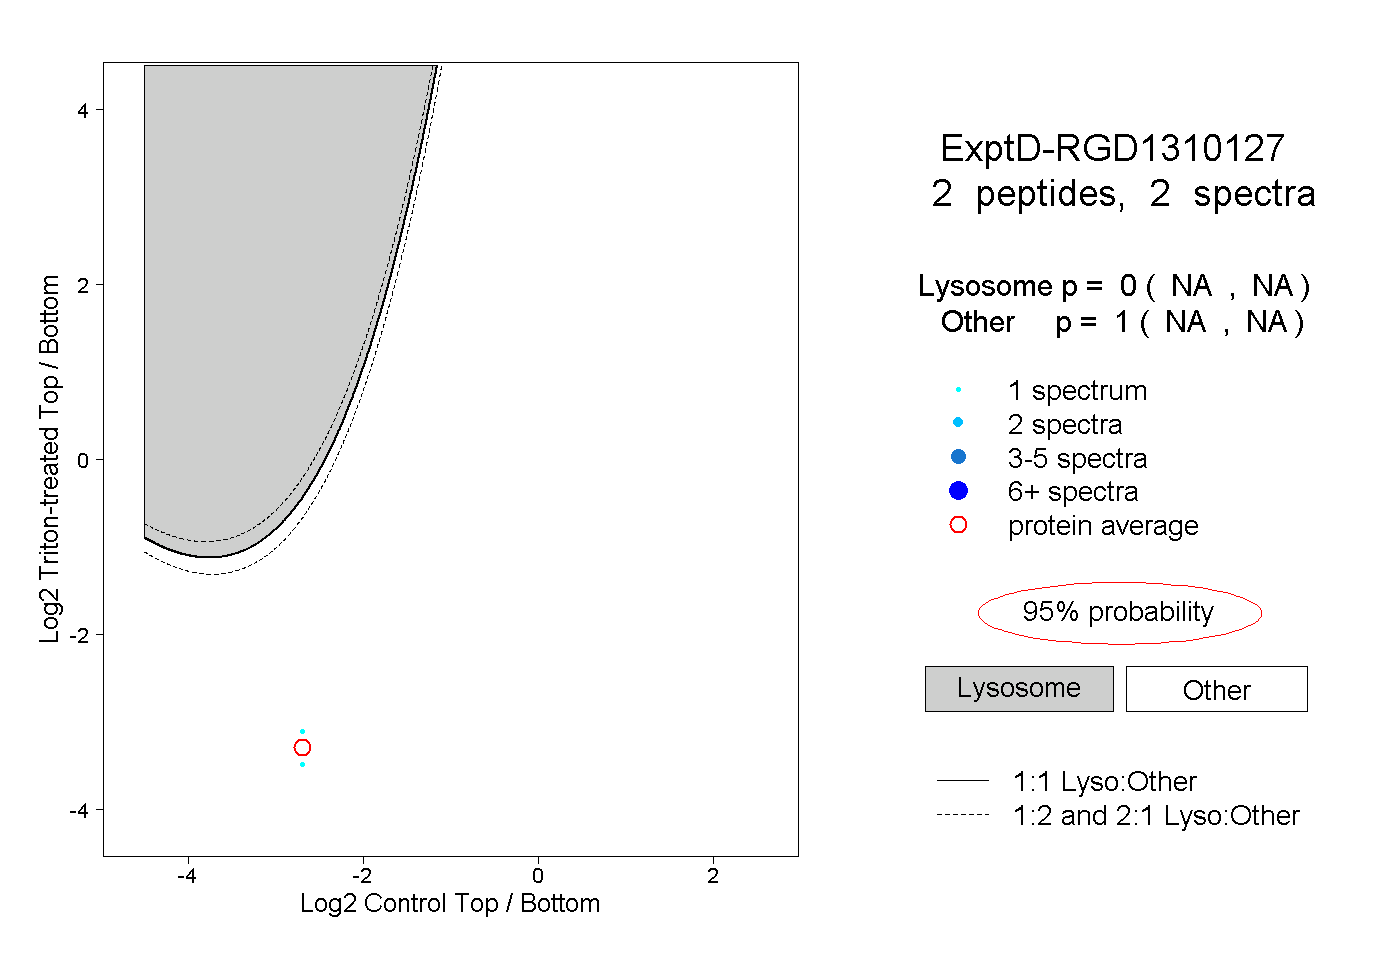
NA | NA
NA | NA