 15
15peptides
spectra
0.006 | 0.022
0.000 | 0.000
0.000 | 0.000
0.780 | 0.816
0.083 | 0.123
0.000 | 0.000
0.000 | 0.006
0.072 | 0.086
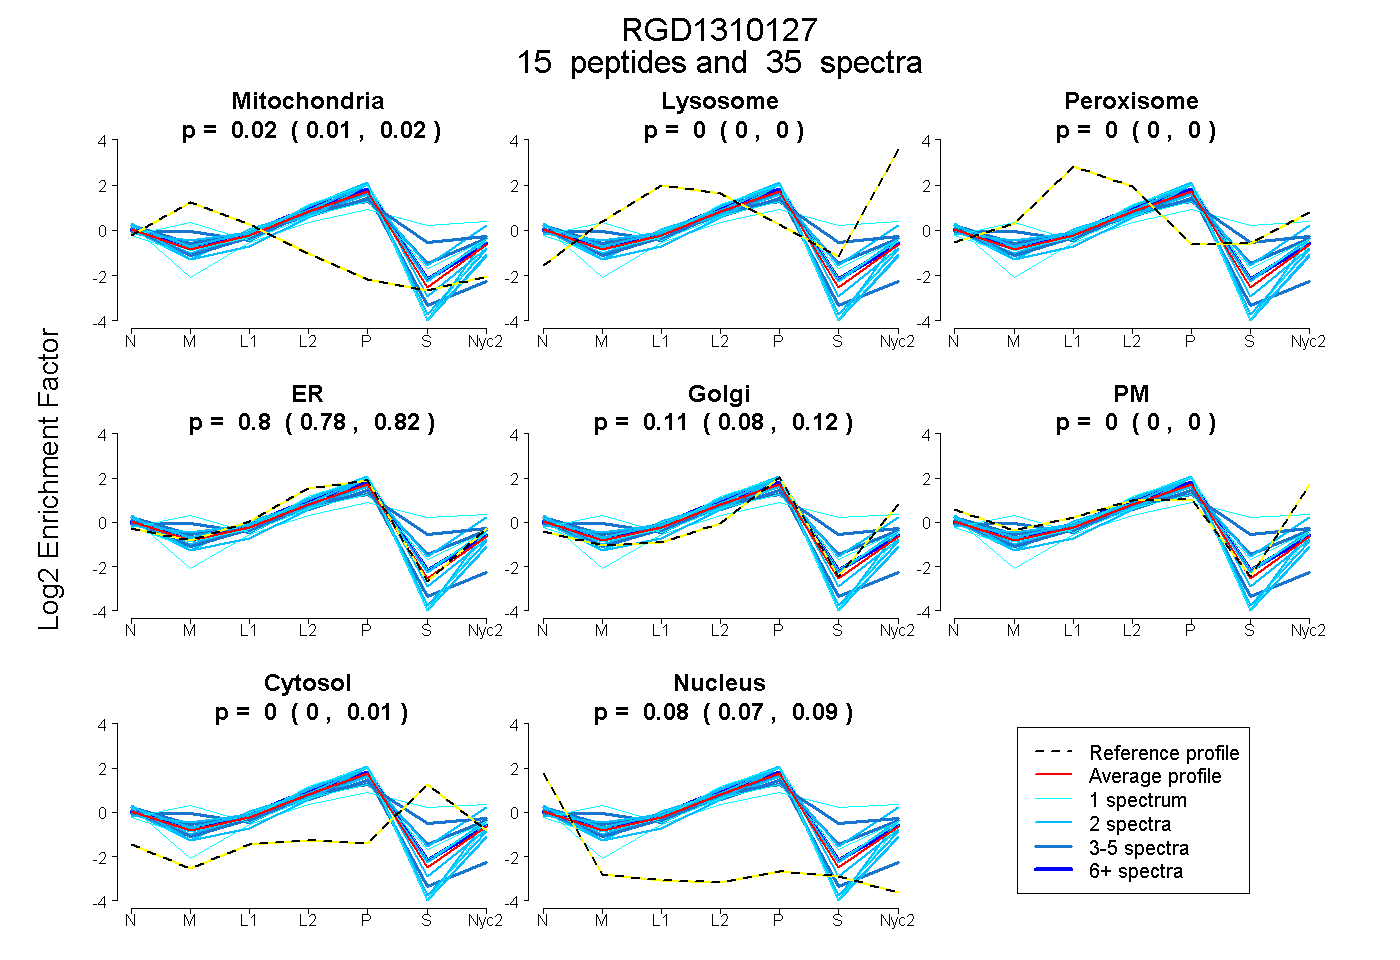
| Plot | Mito | Lyso | Perox | ER | Golgi | PM | Cytosol | Nucleus | |||||
| Expt A |
15 peptides |
35 spectra |
|
0.015 0.006 | 0.022 |
0.000 0.000 | 0.000 |
0.000 0.000 | 0.000 |
0.800 0.780 | 0.816 |
0.105 0.083 | 0.123 |
0.000 0.000 | 0.000 |
0.000 0.000 | 0.006 |
0.080 0.072 | 0.086 |
| 1 spectrum, WGWFSR | 0.000 | 0.000 | 0.000 | 0.937 | 0.000 | 0.000 | 0.000 | 0.063 | ||
| 1 spectrum, NNMADVSAK | 0.192 | 0.000 | 0.064 | 0.419 | 0.285 | 0.000 | 0.039 | 0.000 | ||
| 2 spectra, APLCTEQFGSGAPR | 0.016 | 0.000 | 0.006 | 0.670 | 0.226 | 0.000 | 0.034 | 0.048 | ||
| 3 spectra, HHLEVDEWR | 0.000 | 0.000 | 0.053 | 0.551 | 0.000 | 0.093 | 0.302 | 0.000 | ||
| 1 spectrum, GLQAAGWK | 0.000 | 0.000 | 0.000 | 0.161 | 0.003 | 0.364 | 0.472 | 0.000 | ||
| 2 spectra, ASITKPGQHEGGGR | 0.000 | 0.000 | 0.000 | 0.903 | 0.012 | 0.000 | 0.000 | 0.086 | ||
| 2 spectra, DSTGMLGR | 0.000 | 0.000 | 0.060 | 0.391 | 0.229 | 0.206 | 0.113 | 0.000 | ||
| 2 spectra, ALVLETLNESR | 0.000 | 0.000 | 0.000 | 0.854 | 0.109 | 0.000 | 0.000 | 0.037 | ||
| 7 spectra, AALTMHQAR | 0.013 | 0.000 | 0.001 | 0.861 | 0.036 | 0.000 | 0.051 | 0.039 | ||
| 2 spectra, IQLVLK | 0.000 | 0.000 | 0.000 | 0.829 | 0.009 | 0.000 | 0.000 | 0.162 | ||
| 4 spectra, ASVSAATSTWLVK | 0.019 | 0.000 | 0.103 | 0.521 | 0.172 | 0.037 | 0.108 | 0.040 | ||
| 1 spectrum, ATWPLSPEK | 0.000 | 0.000 | 0.000 | 0.777 | 0.136 | 0.000 | 0.077 | 0.010 | ||
| 2 spectra, SCSAAADGSLQWDR | 0.054 | 0.000 | 0.000 | 0.890 | 0.000 | 0.000 | 0.000 | 0.056 | ||
| 3 spectra, CIVGVAGGATR | 0.159 | 0.000 | 0.000 | 0.745 | 0.000 | 0.000 | 0.000 | 0.096 | ||
| 2 spectra, GPWAALTTLSGLR | 0.000 | 0.000 | 0.000 | 0.924 | 0.000 | 0.000 | 0.000 | 0.076 |
| Plot | Mito | Lyso or Perox | ER | Golgi | PM | Cytosol | Nucleus | ||||||
| Expt B |
5 peptides |
12 spectra |
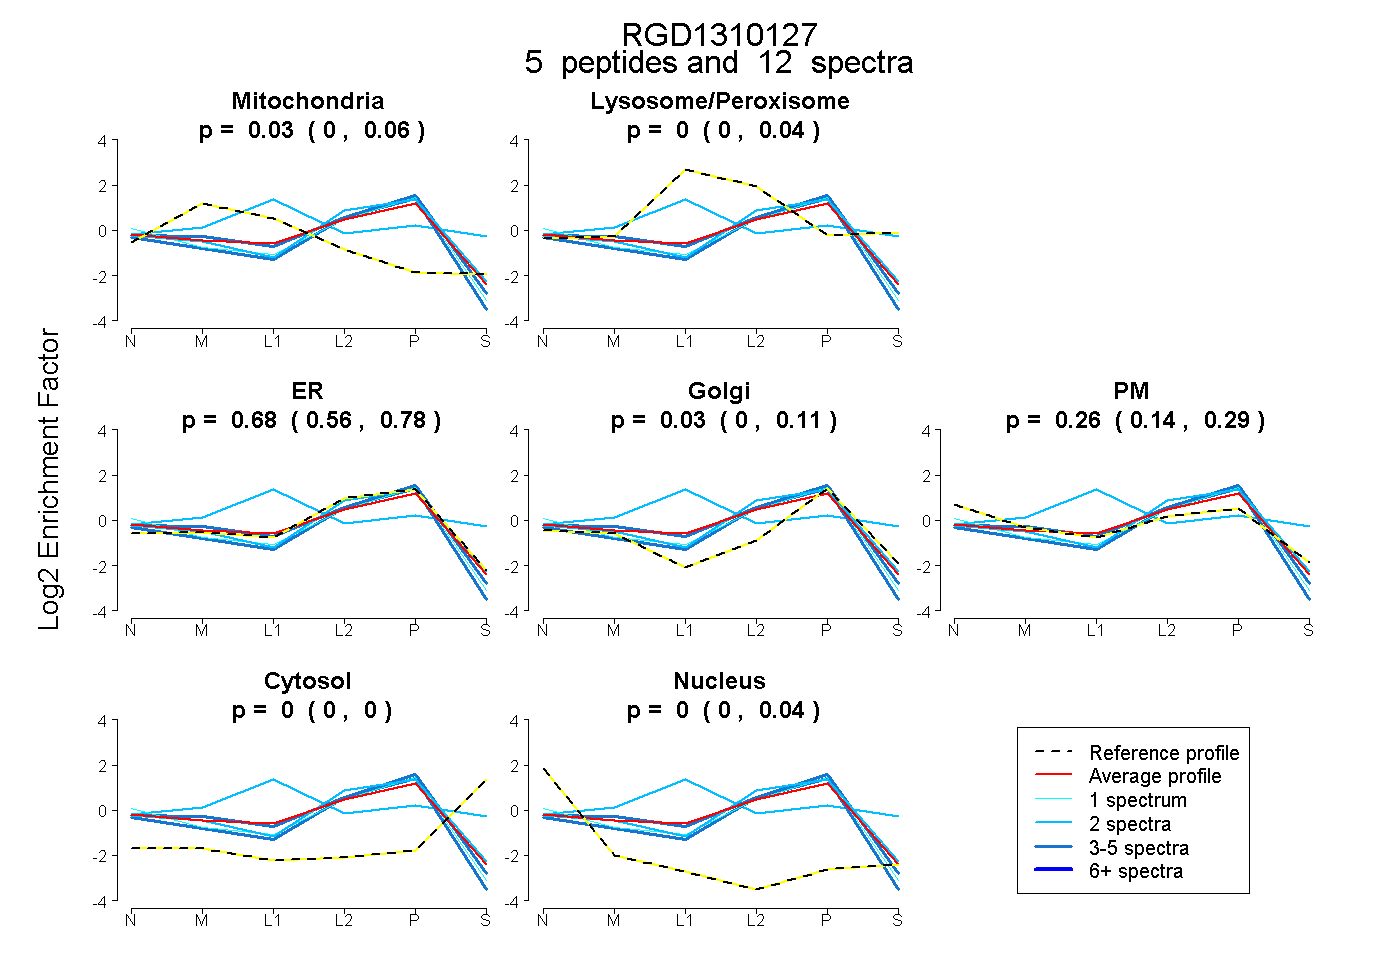 |
0.029 0.000 | 0.056 |
0.000 0.000 | 0.044 |
0.676 0.562 | 0.780 |
0.032 0.000 | 0.113 |
0.261 0.136 | 0.287 |
0.000 0.000 | 0.000 |
0.001 0.000 | 0.037 |
|||
| Plot | Lyso | Other | |||||||||||
| Expt C |
12 peptides |
25 spectra |
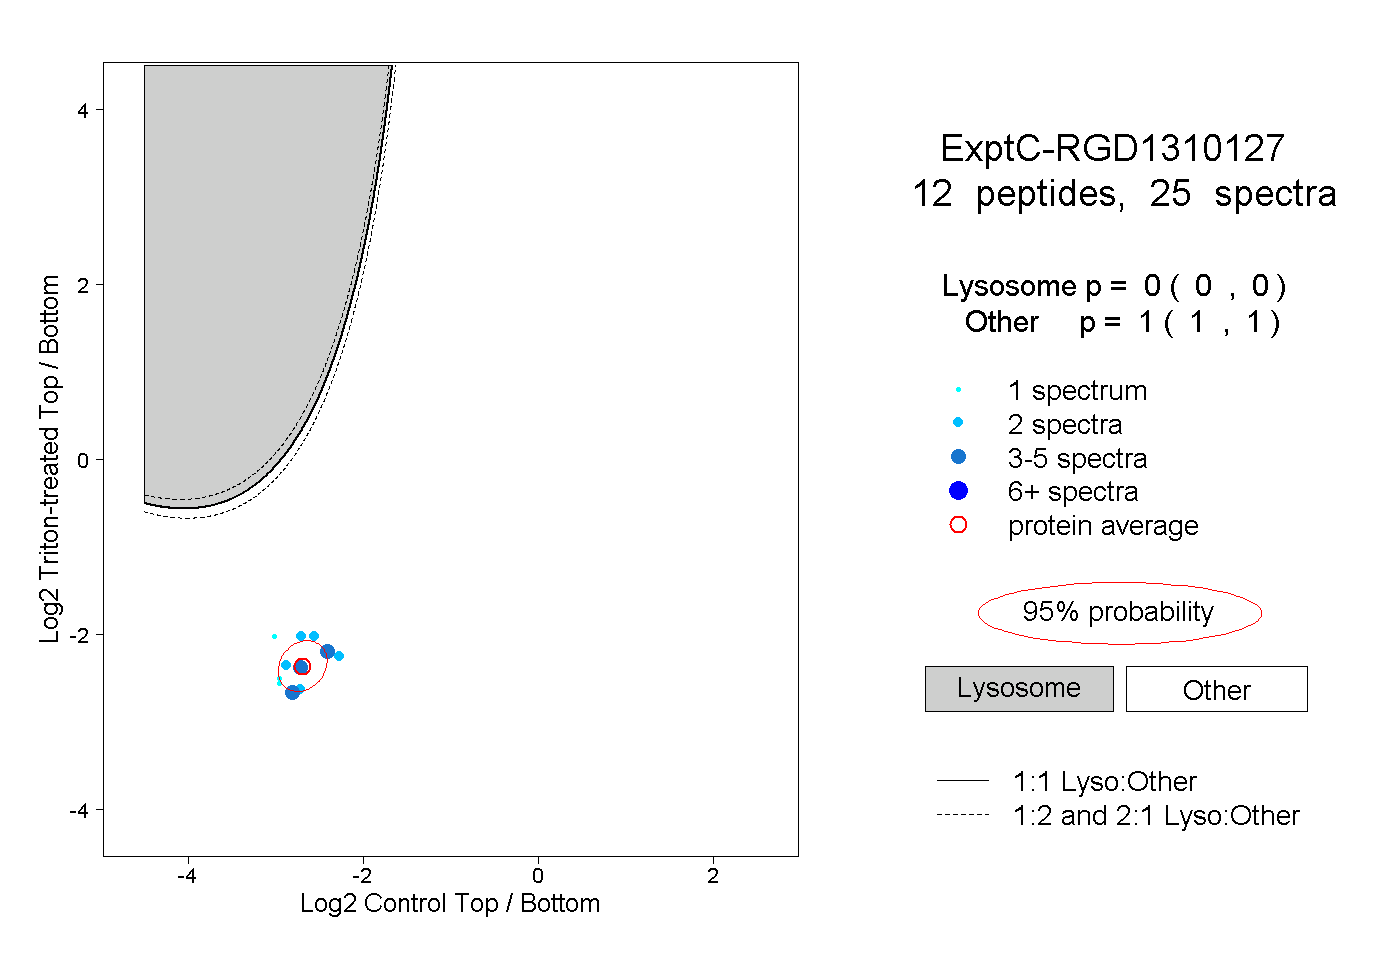 |
0.000 0.000 | 0.000 |
1.000 1.000 | 1.000 |
||||||||
| Plot | Lyso | Other | |||||||||||
| Expt D |
2 peptides |
2 spectra |
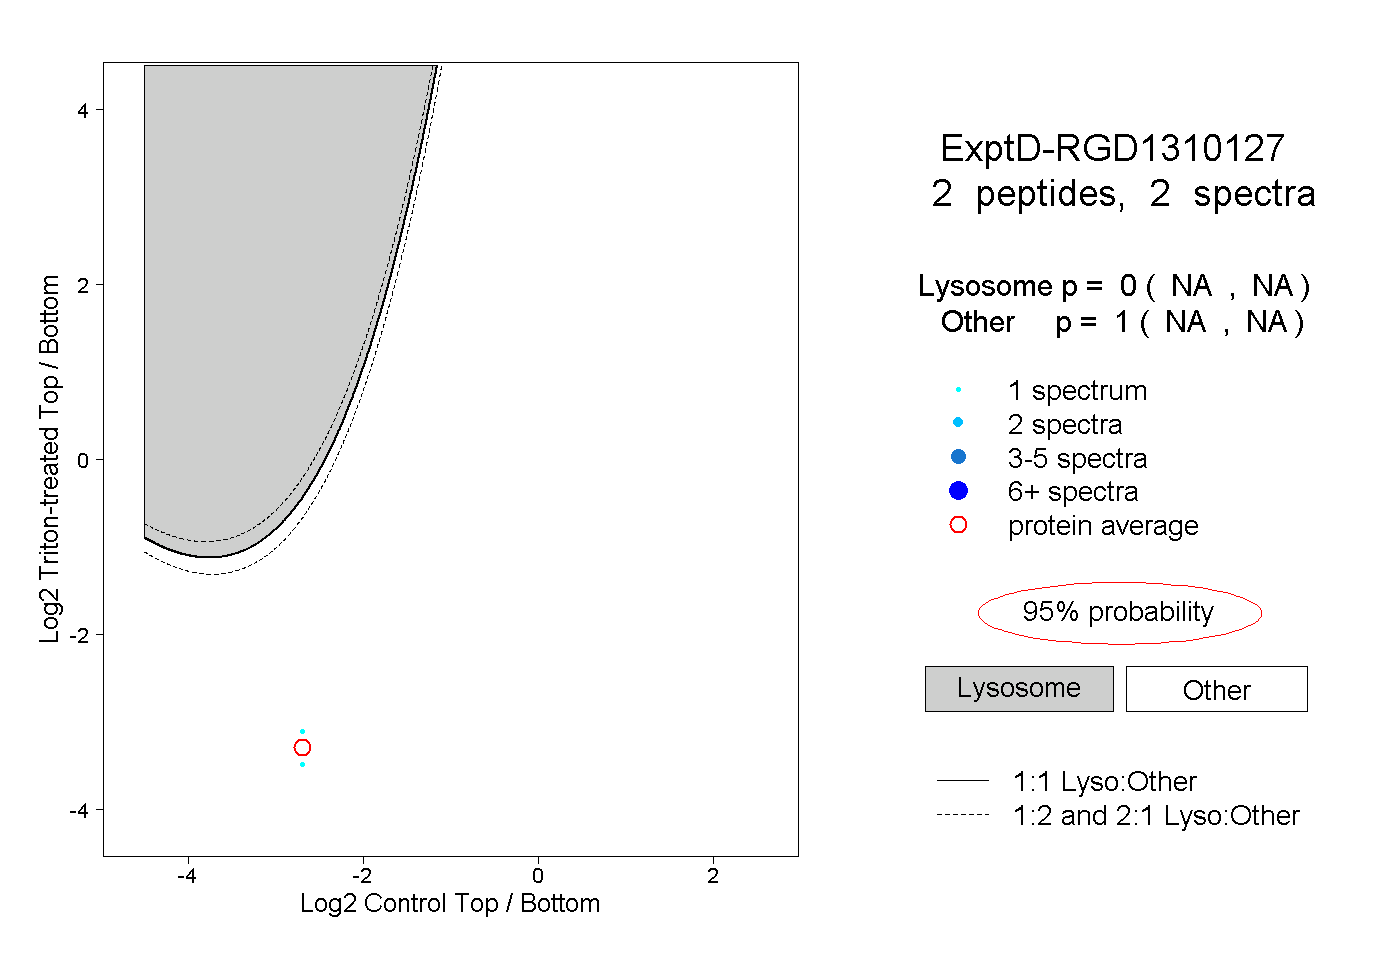 |
0.000 NA | NA |
1.000 NA | NA |