RGD1310127
[ENSRNOP00000027290]
Main page
| | | Plot |
Mito |
Lyso |
|
Perox |
ER |
Golgi |
PM |
Cytosol |
Nucleus |
|
| Expt A |
 15
15
peptides |
35
spectra |
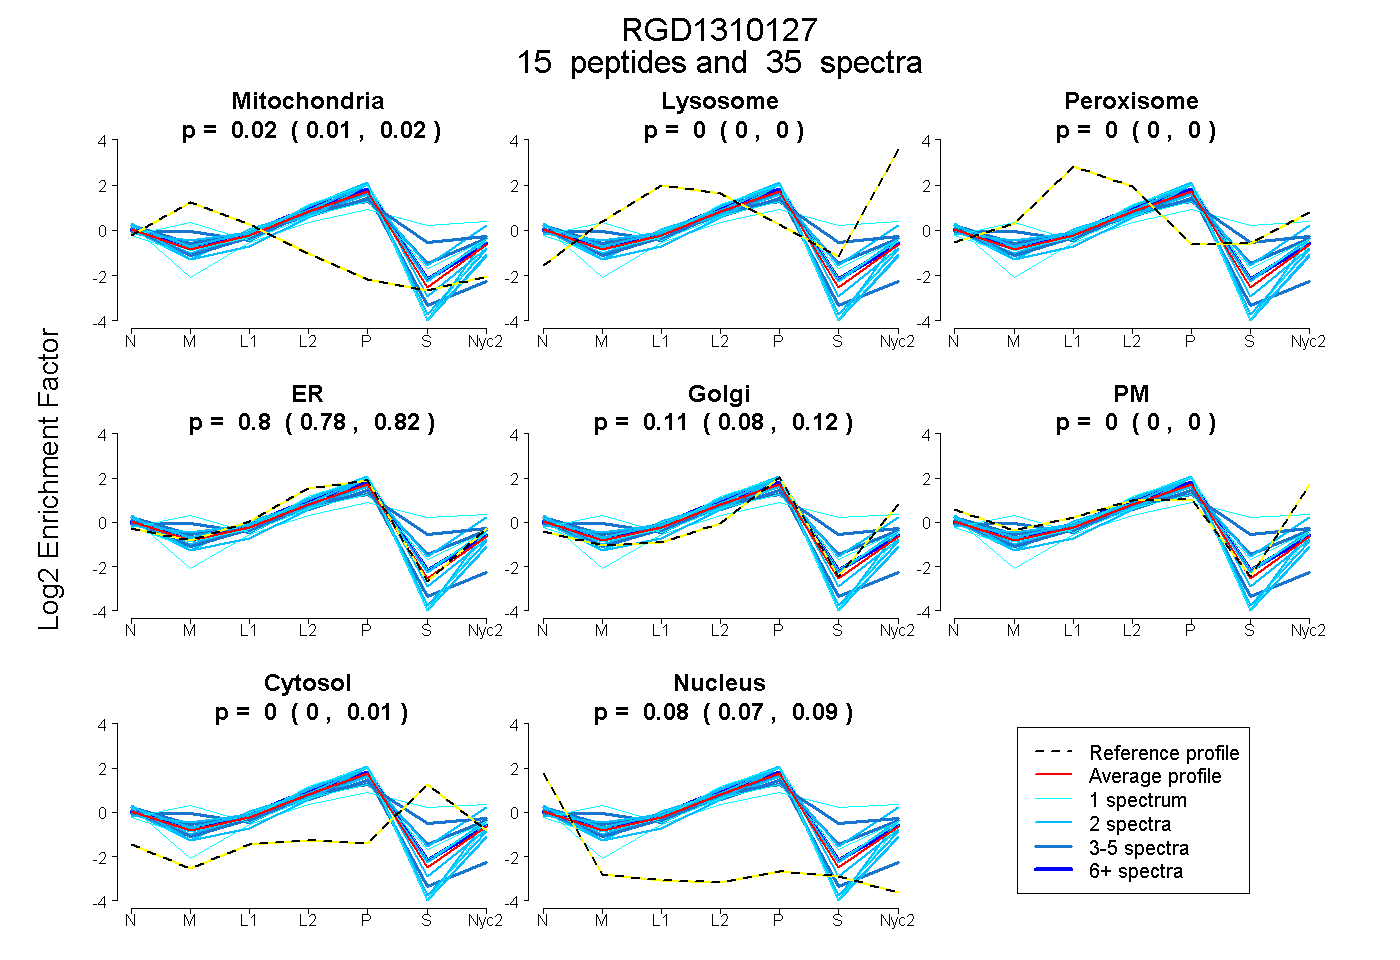 |
0.015
0.006 | 0.022 |
0.000
0.000 | 0.000 |
|
0.000
0.000 | 0.000 |
0.800
0.780 | 0.816 |
0.105
0.083 | 0.123 |
0.000
0.000 | 0.000 |
0.000
0.000 | 0.006 |
0.080
0.072 | 0.086 |
|
| | | Plot |
Mito |
|
Lyso or Perox |
|
ER |
Golgi |
PM |
Cytosol |
Nucleus |
|
| Expt B |
5
peptides |
12
spectra |
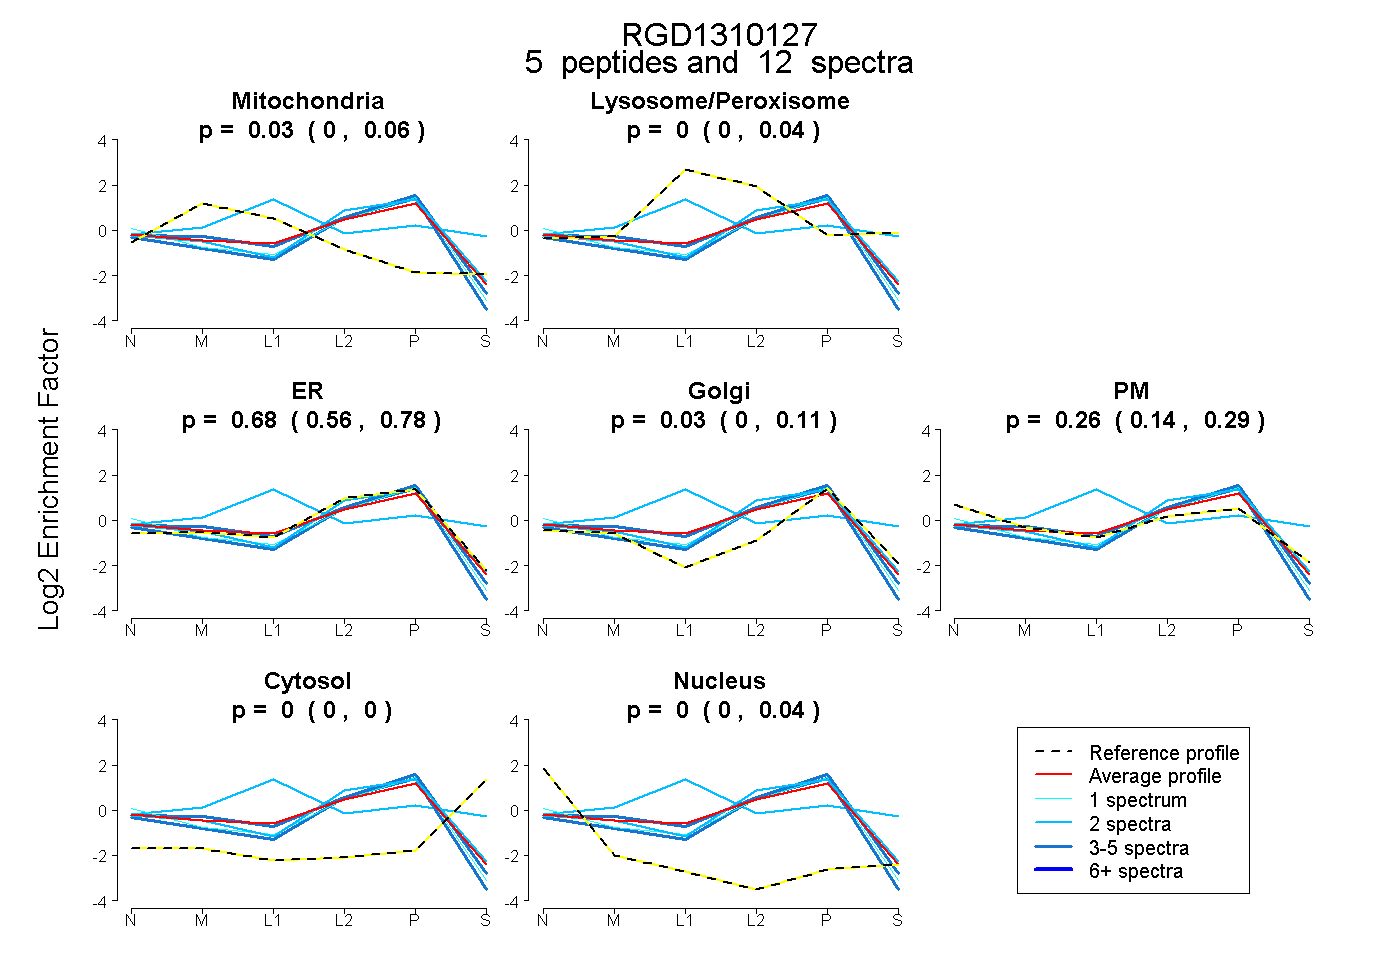 |
0.029
0.000 | 0.056 |
|
0.000
0.000 | 0.044 |
|
0.676
0.562 | 0.780 |
0.032
0.000 | 0.113 |
0.261
0.136 | 0.287 |
0.000
0.000 | 0.000 |
0.001
0.000 | 0.037 |
|
| 2 spectra, NESWILVR |
0.000 |
|
0.000 |
|
0.782 |
0.103 |
0.115 |
0.000 |
0.000 |
|
| 4 spectra, ALVLETLNESR |
0.000 |
|
0.000 |
|
0.764 |
0.219 |
0.000 |
0.000 |
0.017 |
|
| 2 spectra, AALTMHQAR |
0.167 |
|
0.546 |
|
0.000 |
0.217 |
0.000 |
0.070 |
0.000 |
|
| 1 spectrum, IQLVLK |
0.000 |
|
0.000 |
|
0.873 |
0.037 |
0.000 |
0.000 |
0.089 |
|
| 3 spectra, CIVGVAGGATR |
0.003 |
|
0.000 |
|
0.950 |
0.000 |
0.000 |
0.000 |
0.048 |
|
| | | Plot |
|
Lyso |
|
|
|
|
|
|
|
Other |
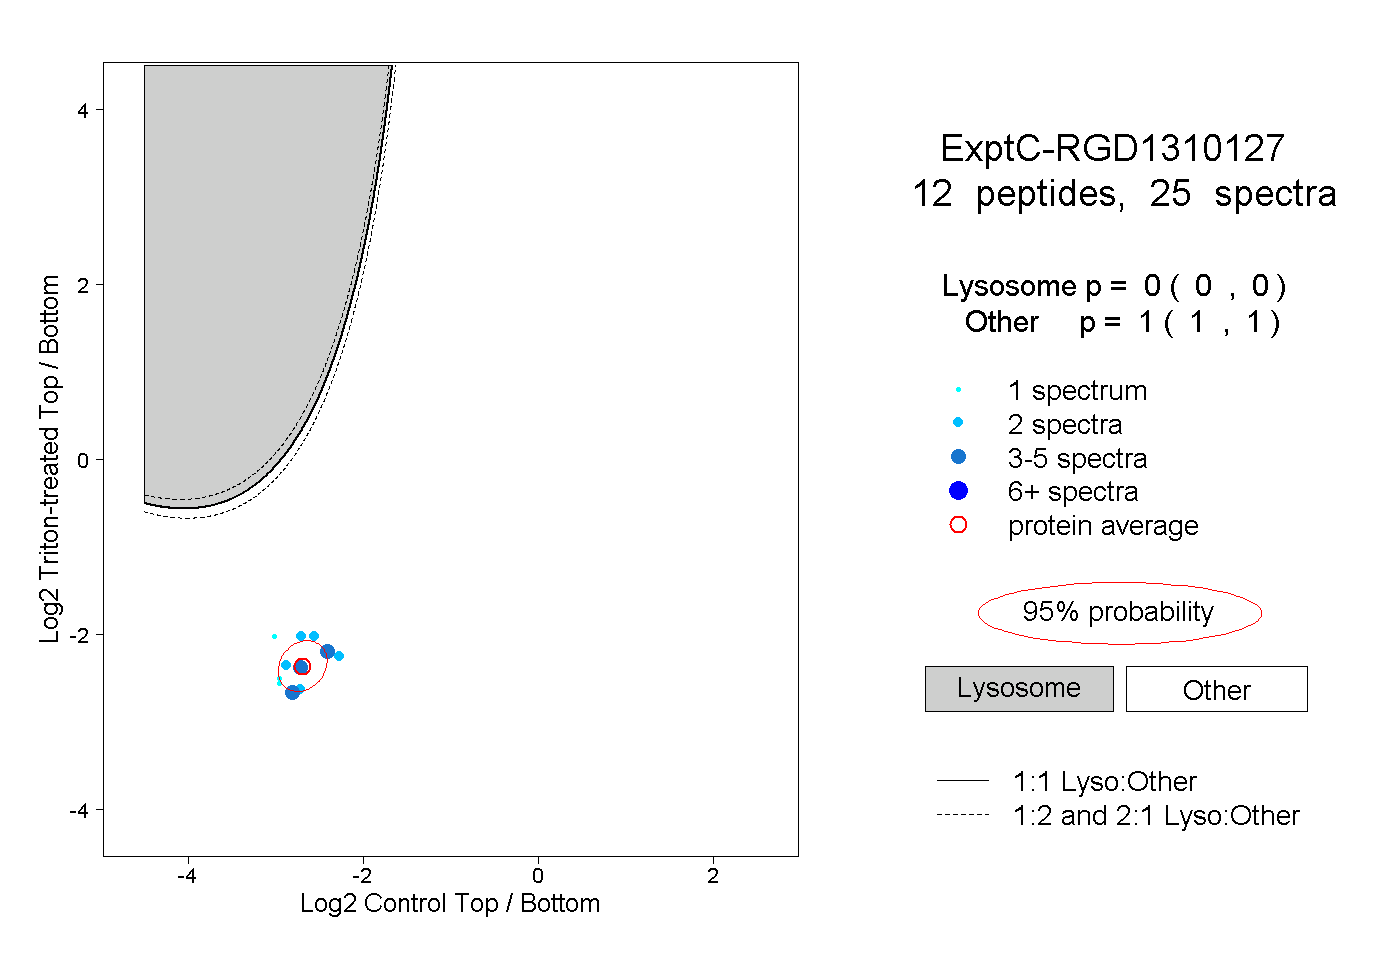
| Expt C |
12
peptides |
25
spectra |
 |
|
0.000
0.000 | 0.000 |
|
|
|
|
|
|
|
1.000
1.000 | 1.000 |
| | | Plot |
|
Lyso |
|
|
|
|
|
|
|
Other |
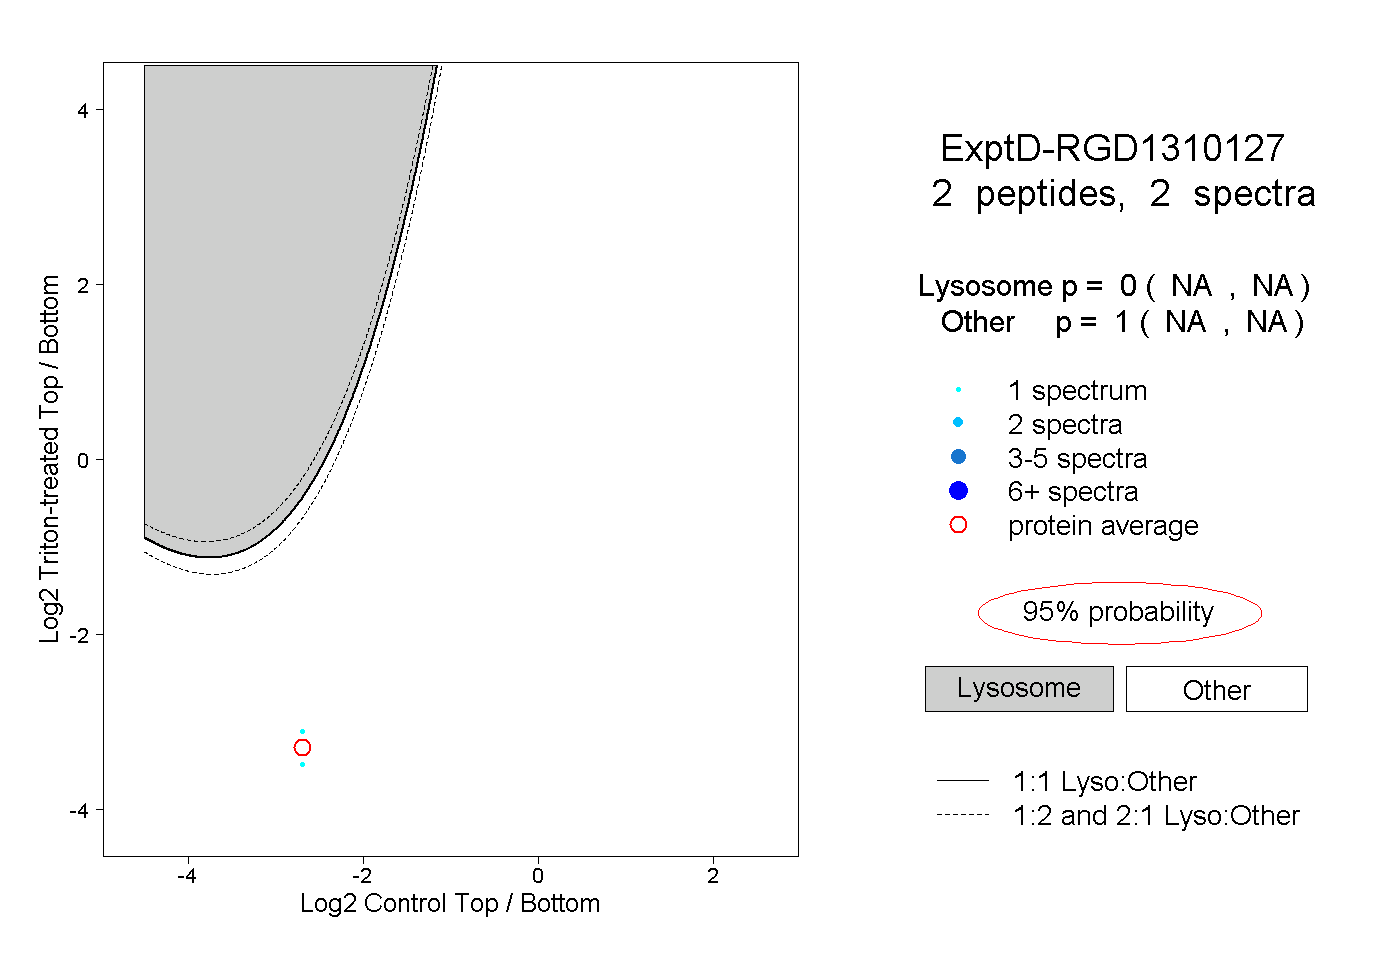
| Expt D |
2
peptides |
2
spectra |
 |
|
0.000
NA | NA |
|
|
|
|
|
|
|
1.000
NA | NA |