 8
8peptides
spectra
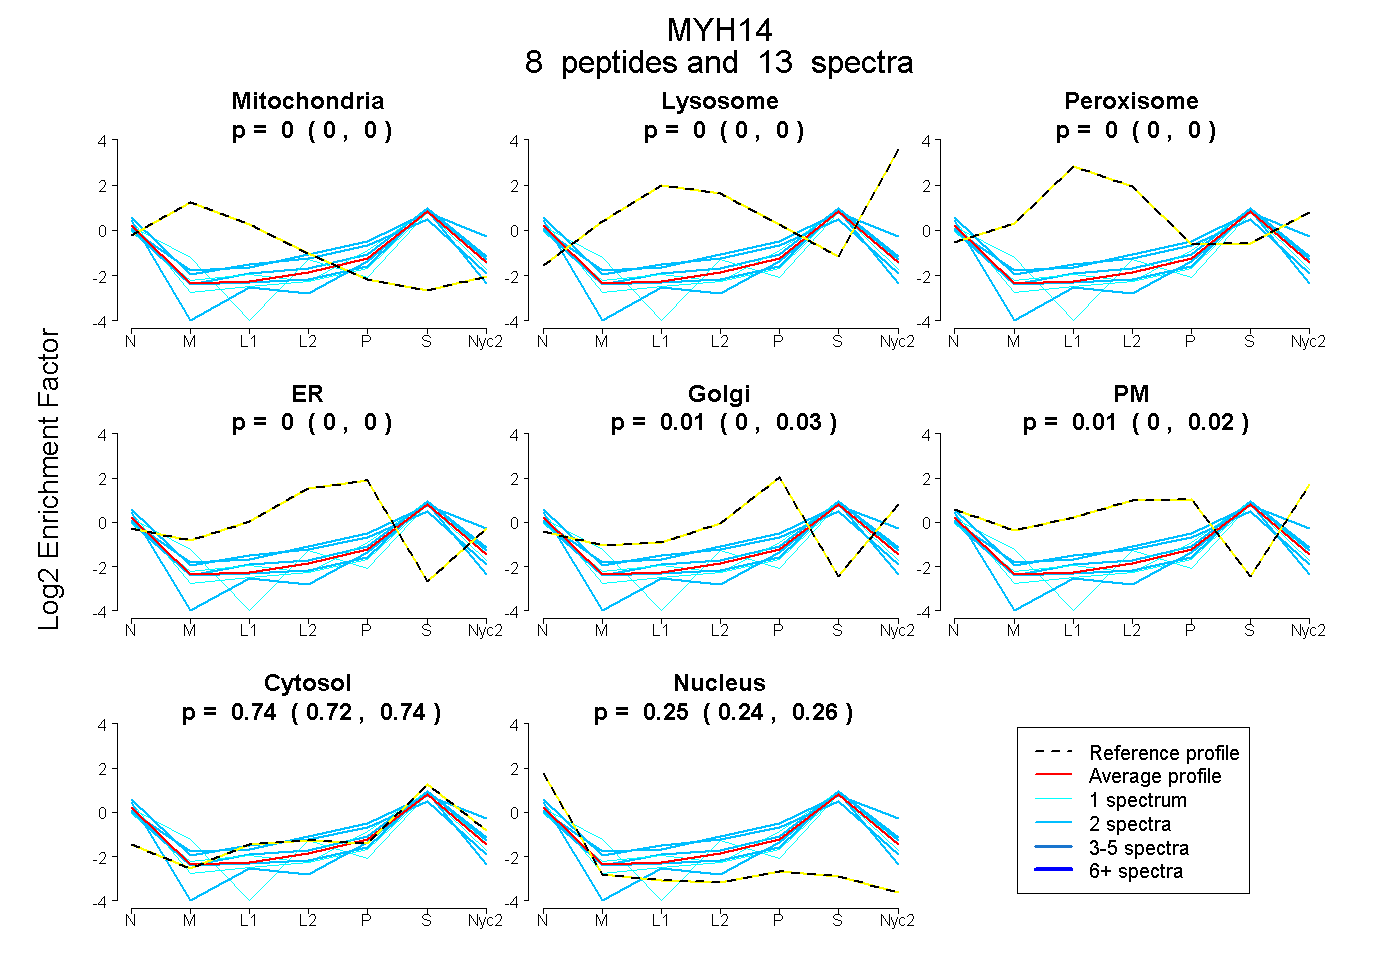
0.000 | 0.000
0.000 | 0.000
0.000 | 0.000
0.000 | 0.000
0.000 | 0.025
0.000 | 0.024
0.723 | 0.742
0.236 | 0.263
4peptides
spectra
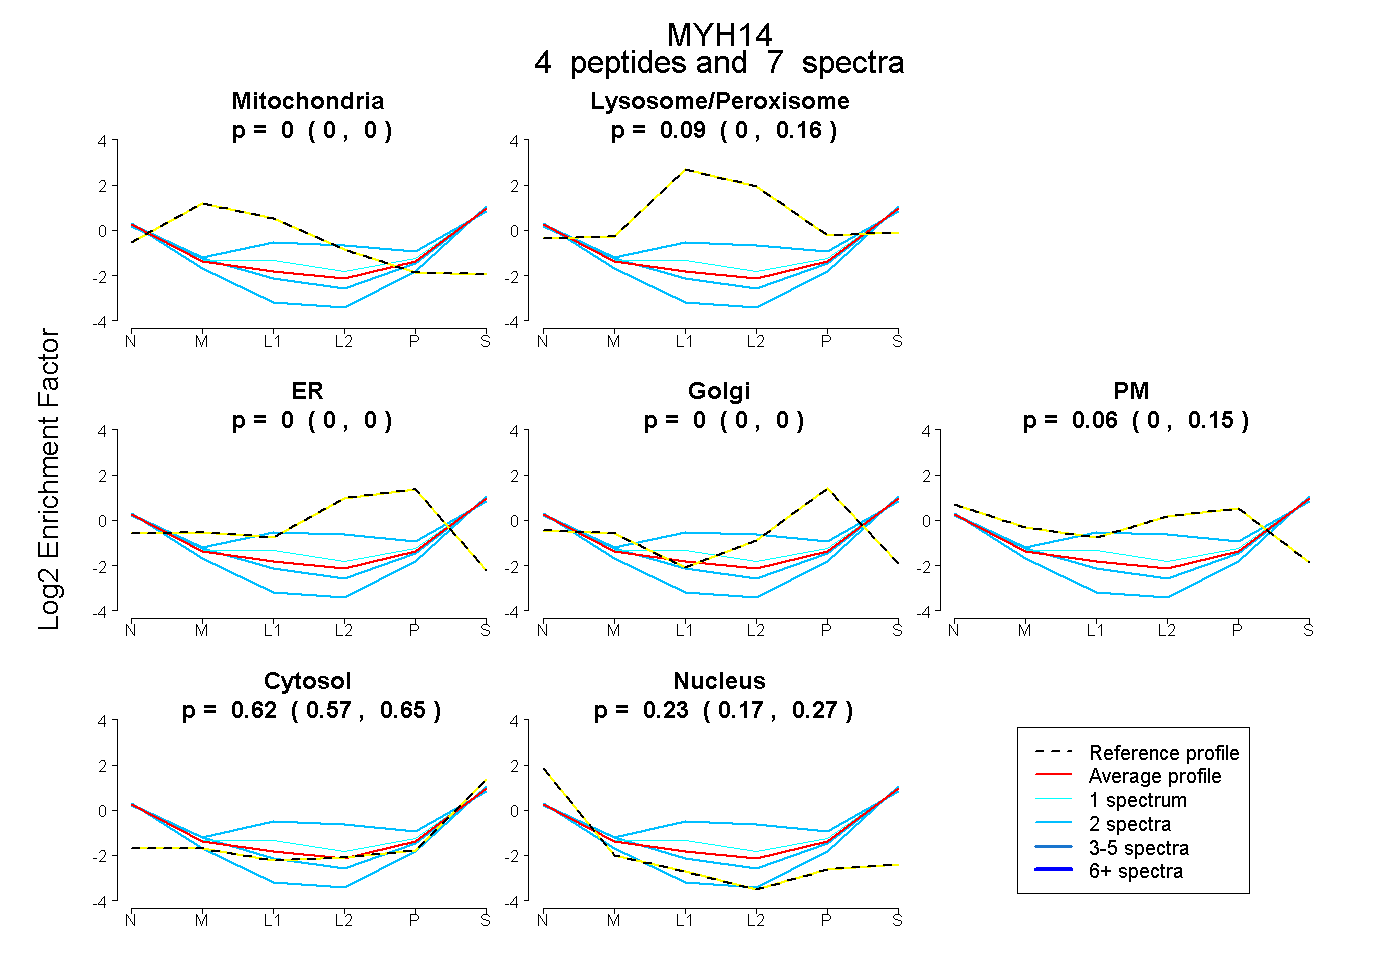
0.000 | 0.000
0.000 | 0.164
0.000 | 0.000
0.000 | 0.000
0.000 | 0.153
0.571 | 0.654
0.171 | 0.269
8peptides
spectra
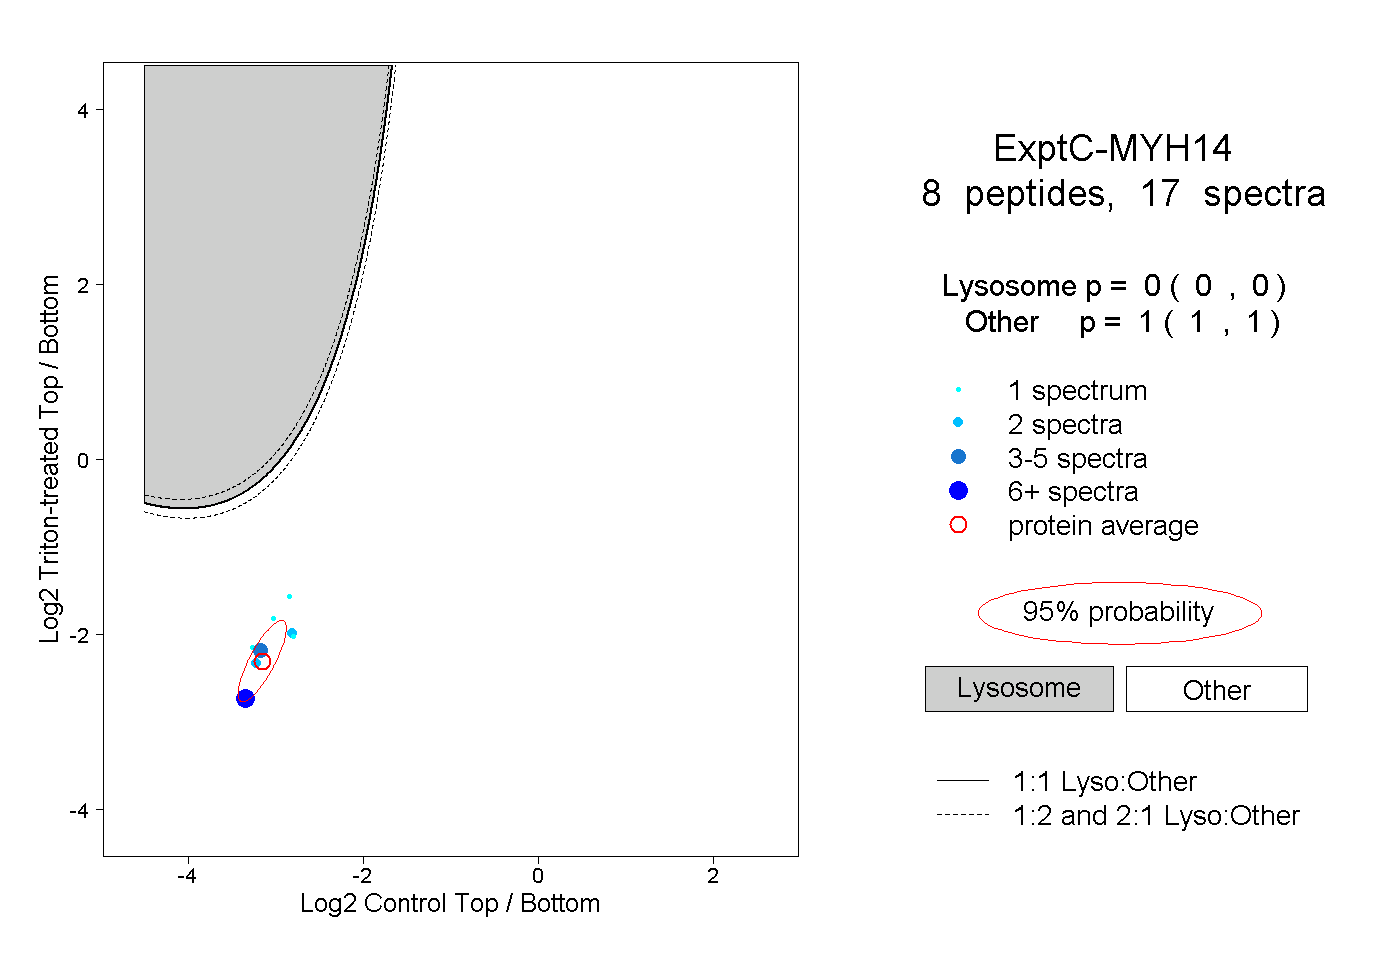
0.000 | 0.000
1.000 | 1.000
2peptides
spectra
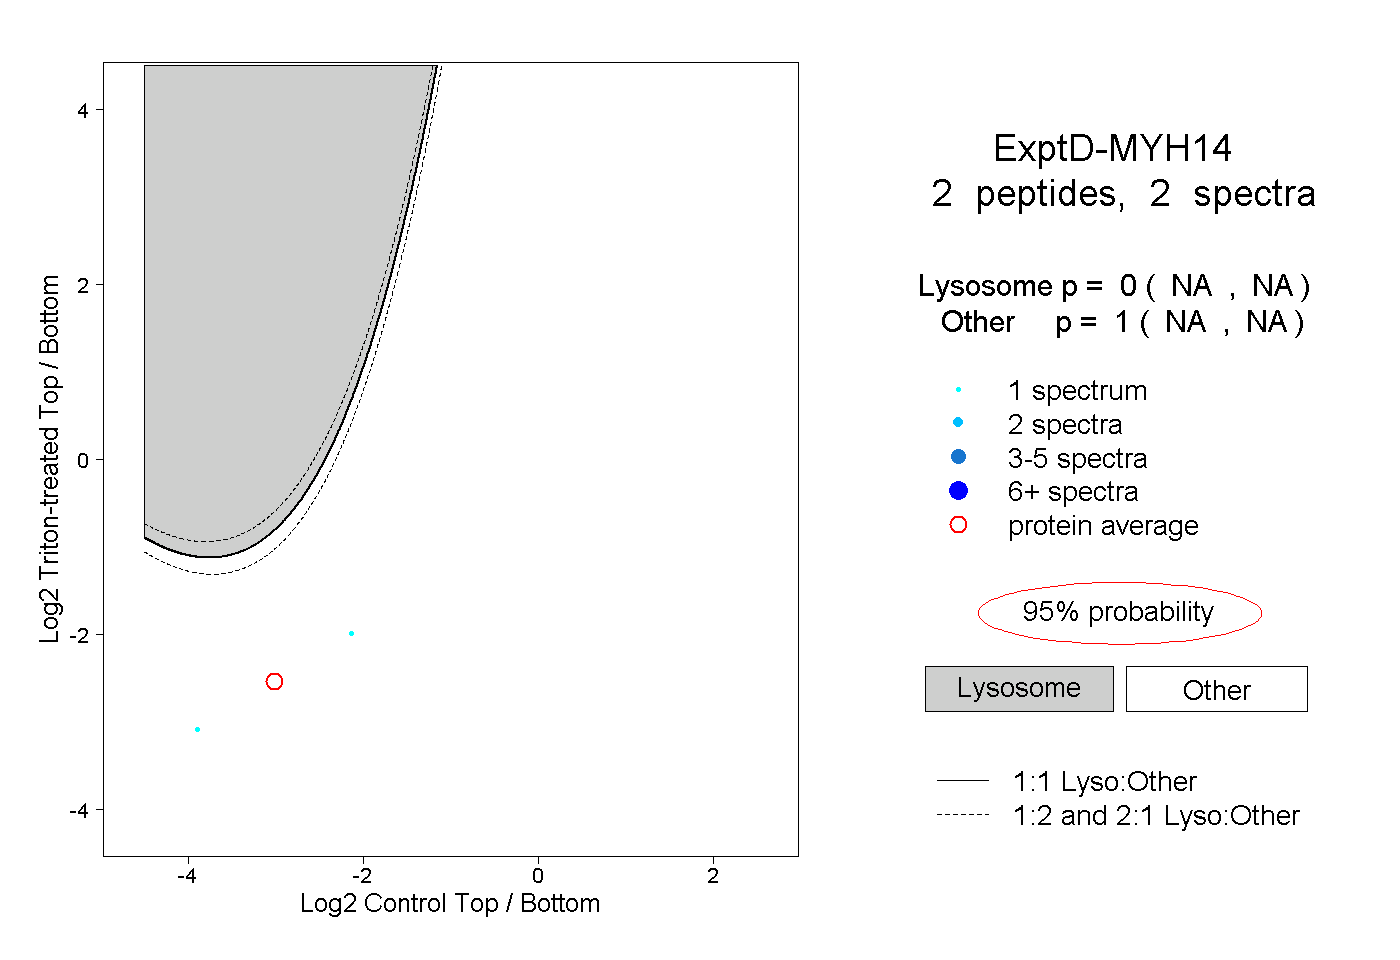
NA | NA
NA | NA