MYH14
[ENSRNOP00000027132]
Main page
| | | Plot |
Mito |
Lyso |
|
Perox |
ER |
Golgi |
PM |
Cytosol |
Nucleus |
|
| Expt A |
 8
8
peptides |
13
spectra |
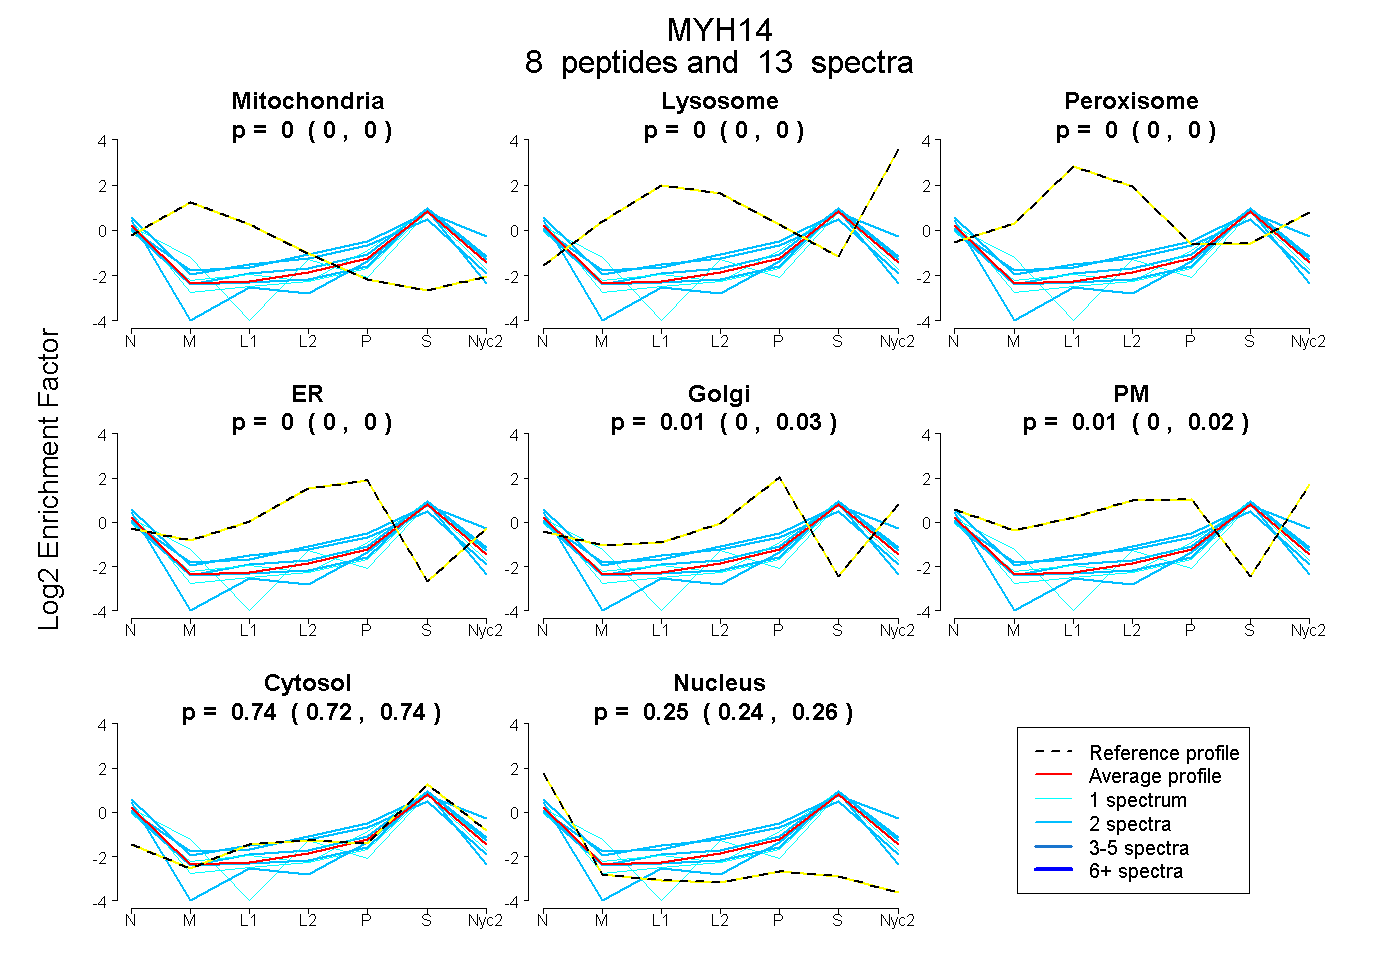 |
0.000
0.000 | 0.000 |
0.000
0.000 | 0.000 |
|
0.000
0.000 | 0.000 |
0.000
0.000 | 0.000 |
0.008
0.000 | 0.025 |
0.006
0.000 | 0.024 |
0.735
0.723 | 0.742 |
0.251
0.236 | 0.263 |
|
| | | Plot |
Mito |
|
Lyso or Perox |
|
ER |
Golgi |
PM |
Cytosol |
Nucleus |
|
| Expt B |
4
peptides |
7
spectra |
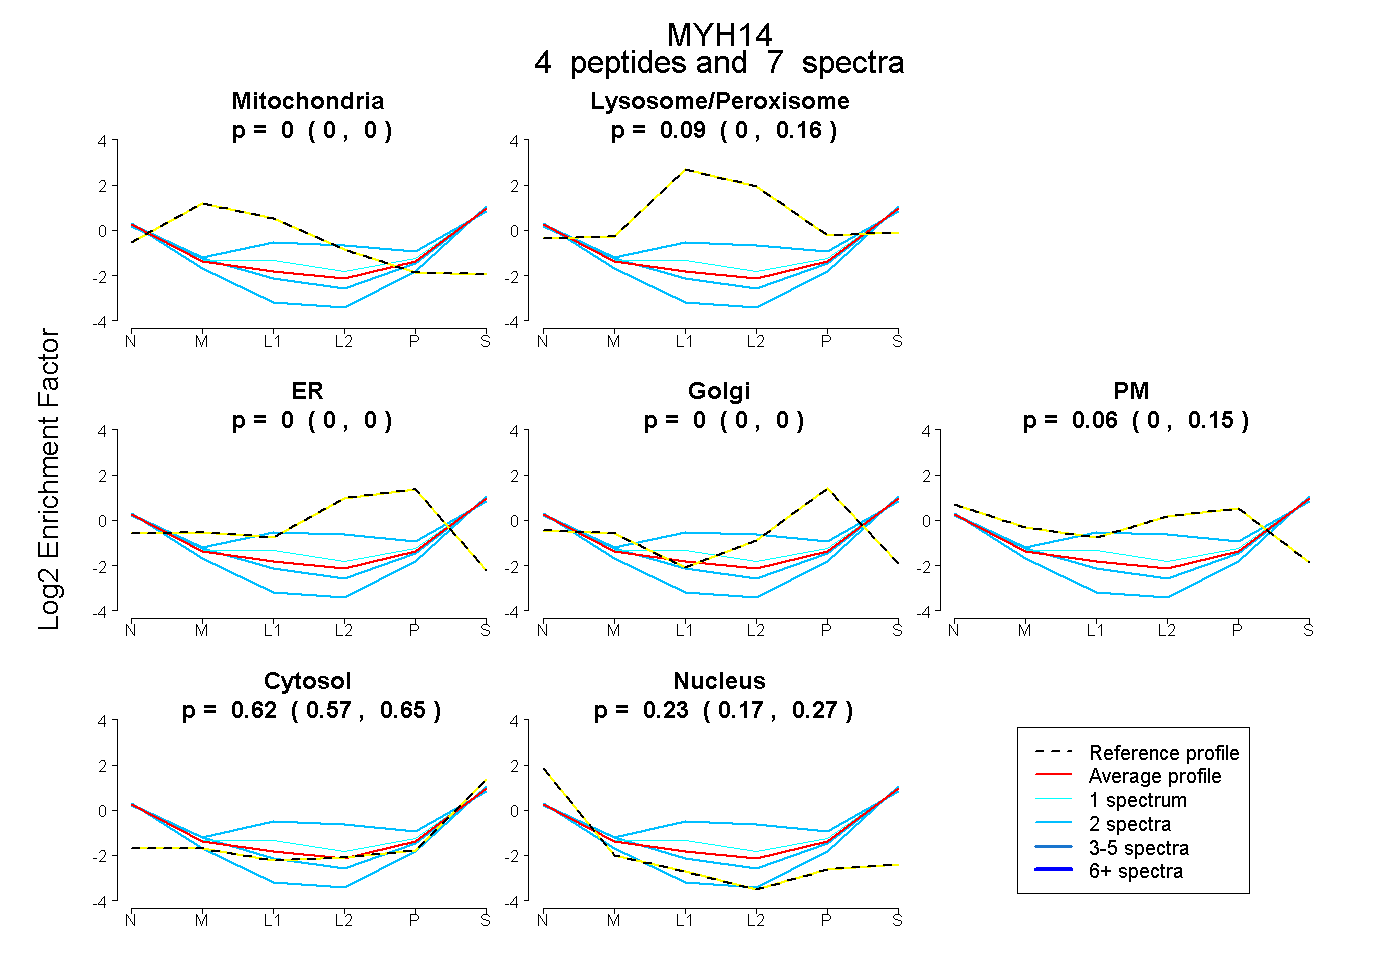 |
0.000
0.000 | 0.000 |
|
0.085
0.000 | 0.164 |
|
0.000
0.000 | 0.000 |
0.000
0.000 | 0.000 |
0.065
0.000 | 0.153 |
0.619
0.571 | 0.654 |
0.231
0.171 | 0.269 |
|
| 2 spectra, LQEELAASDR |
0.000 |
|
0.004 |
|
0.000 |
0.000 |
0.079 |
0.671 |
0.246 |
|
| 1 spectrum, TLEEEAR |
0.000 |
|
0.183 |
|
0.000 |
0.000 |
0.030 |
0.568 |
0.220 |
|
| 2 spectra, ELFQETLESLR |
0.000 |
|
0.000 |
|
0.000 |
0.000 |
0.000 |
0.643 |
0.357 |
|
| 2 spectra, VAQLEEER |
0.000 |
|
0.357 |
|
0.000 |
0.000 |
0.068 |
0.441 |
0.134 |
|
| | | Plot |
|
Lyso |
|
|
|
|
|
|
|
Other |
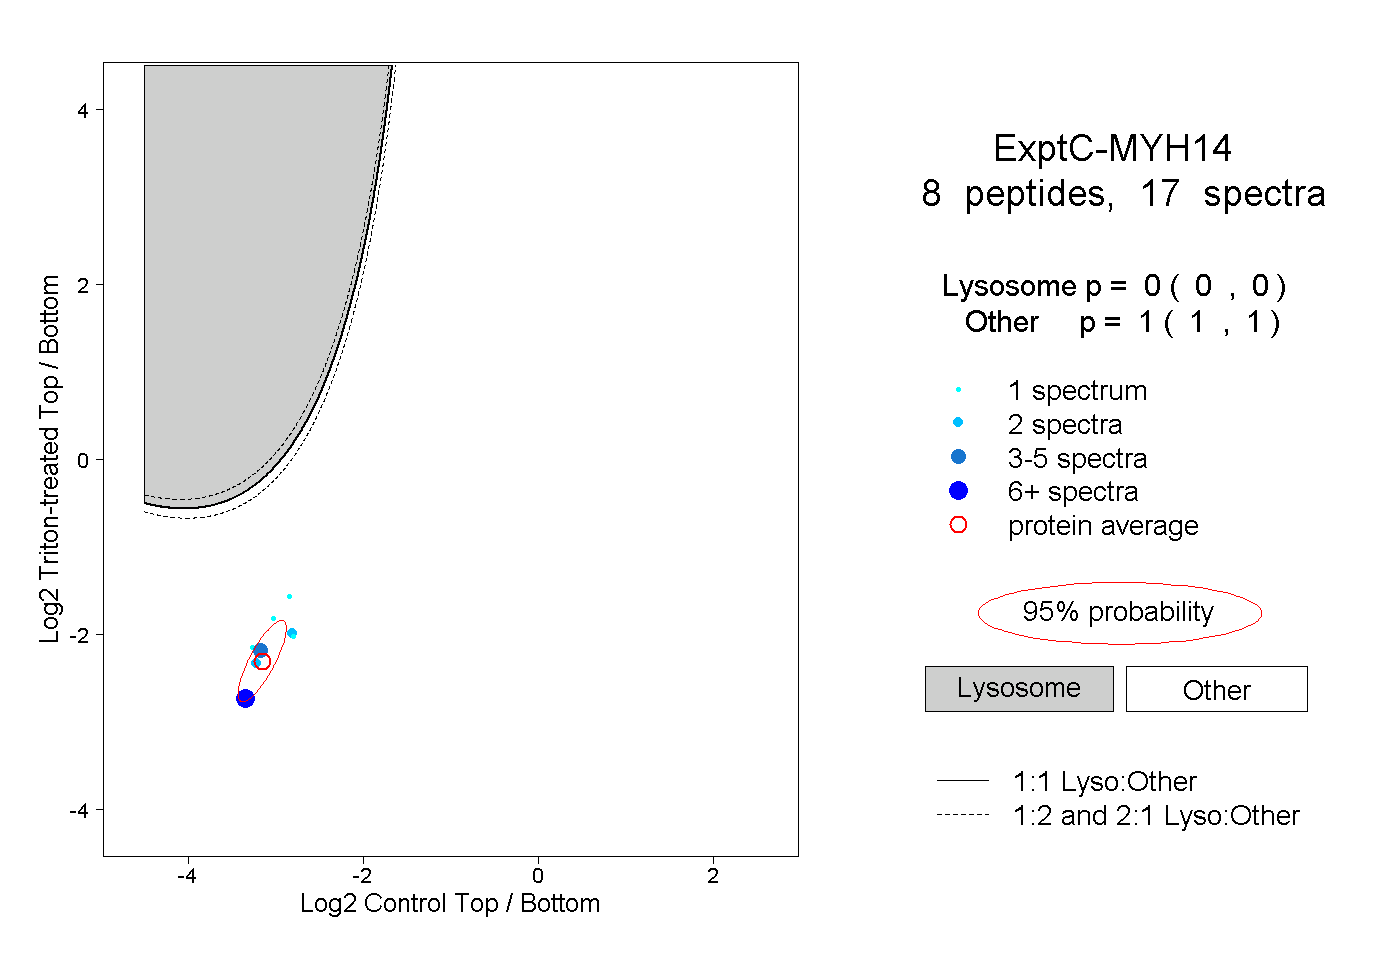
| Expt C |
8
peptides |
17
spectra |
 |
|
0.000
0.000 | 0.000 |
|
|
|
|
|
|
|
1.000
1.000 | 1.000 |
| | | Plot |
|
Lyso |
|
|
|
|
|
|
|
Other |
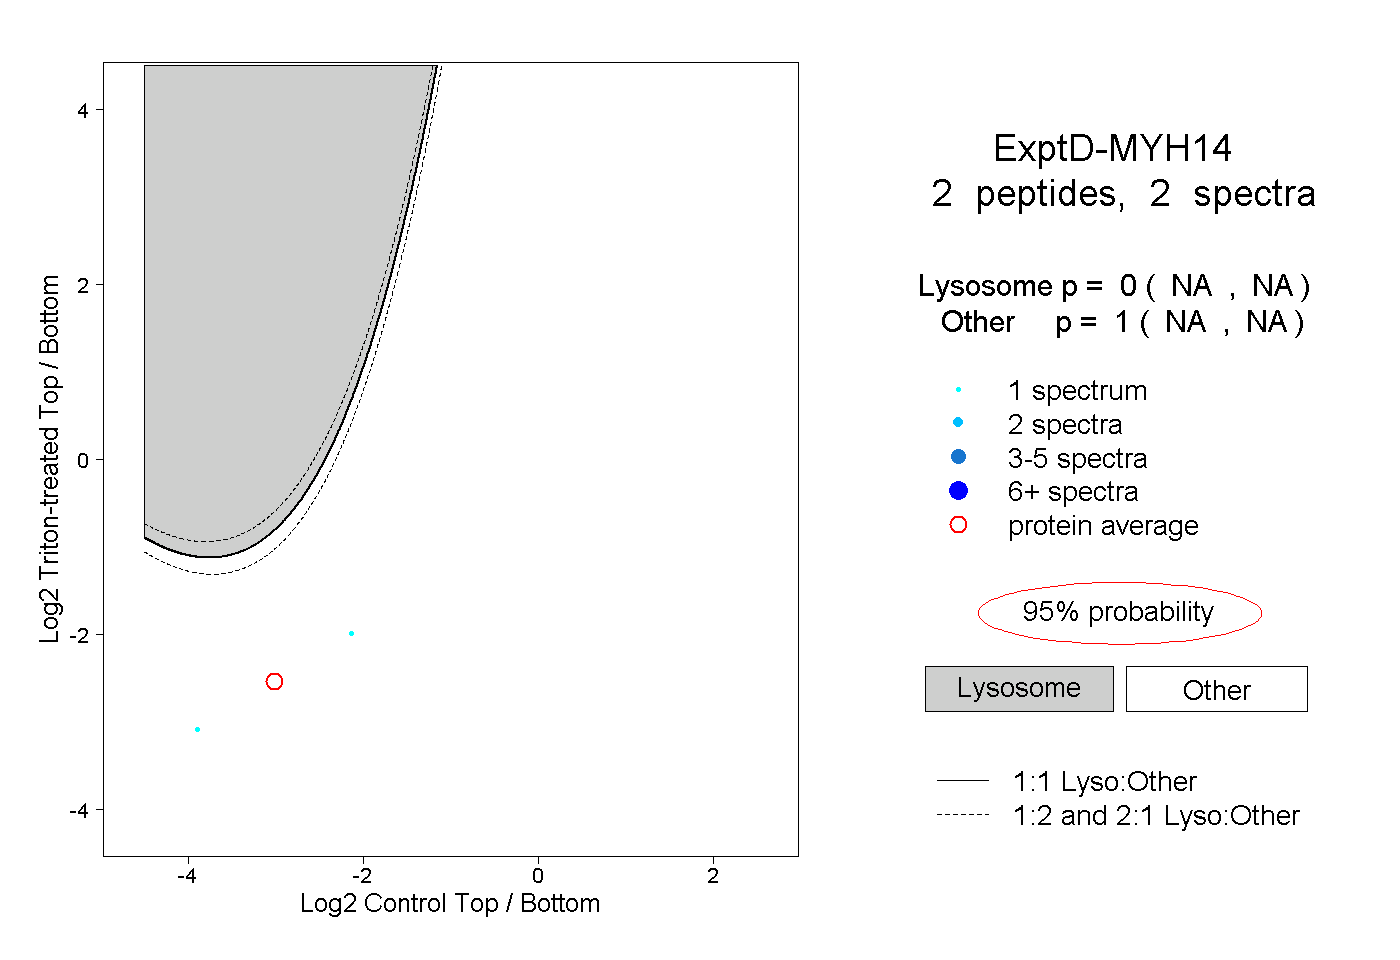
| Expt D |
2
peptides |
2
spectra |
 |
|
0.000
NA | NA |
|
|
|
|
|
|
|
1.000
NA | NA |