 8
8peptides
spectra
0.000 | 0.000
0.000 | 0.000
0.000 | 0.000
0.000 | 0.000
0.000 | 0.025
0.000 | 0.024
0.723 | 0.742
0.236 | 0.263
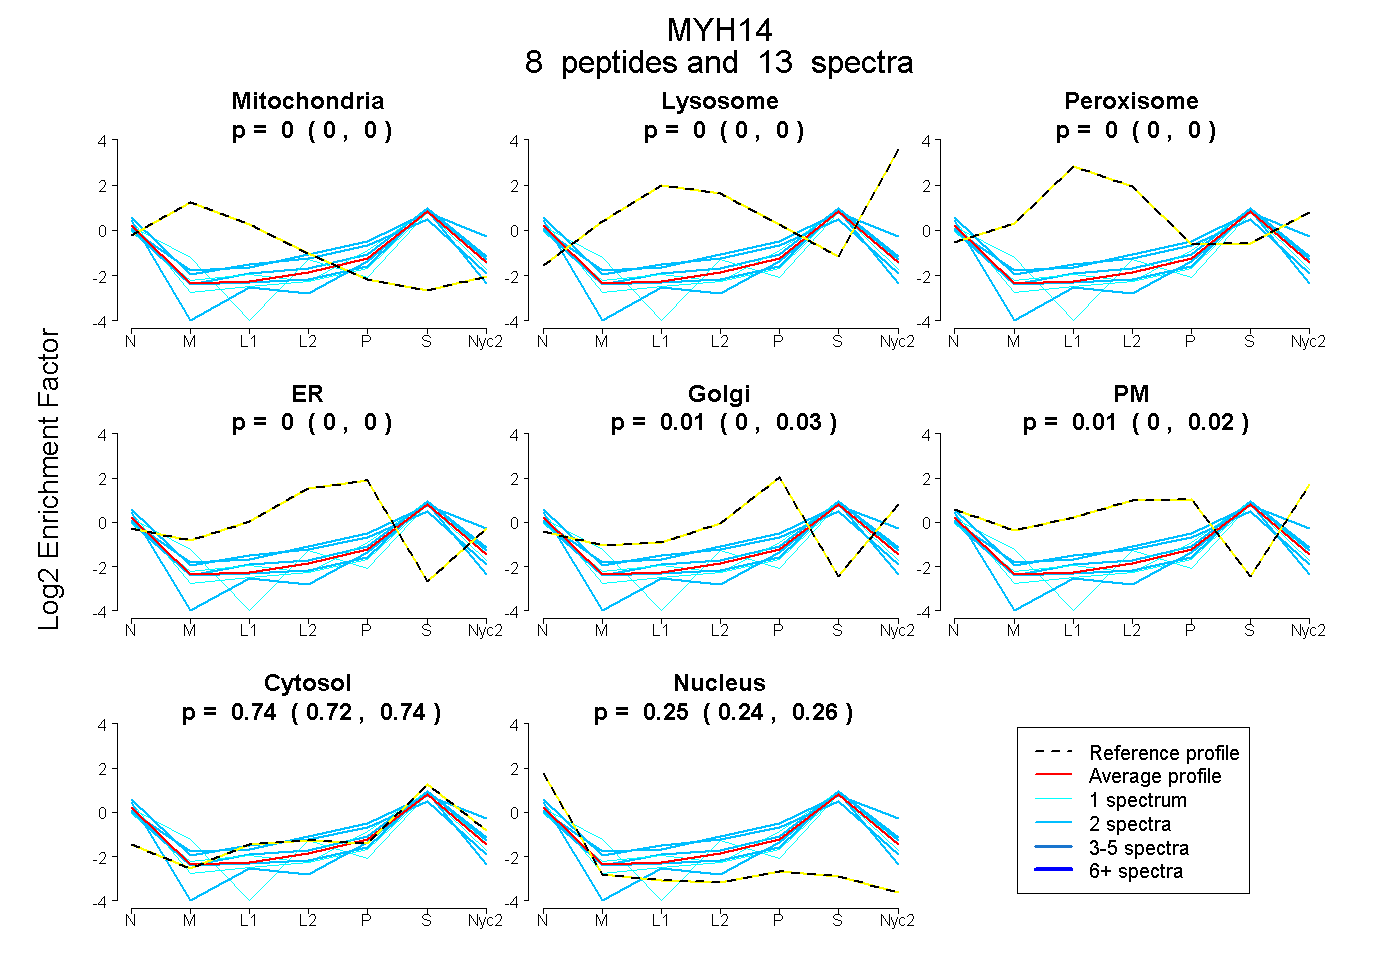
| Plot | Mito | Lyso | Perox | ER | Golgi | PM | Cytosol | Nucleus | |||||
| Expt A |
8 peptides |
13 spectra |
|
0.000 0.000 | 0.000 |
0.000 0.000 | 0.000 |
0.000 0.000 | 0.000 |
0.000 0.000 | 0.000 |
0.008 0.000 | 0.025 |
0.006 0.000 | 0.024 |
0.735 0.723 | 0.742 |
0.251 0.236 | 0.263 |
| 2 spectra, VASRPGPVPEAAQPFLFAPR | 0.000 | 0.000 | 0.000 | 0.000 | 0.000 | 0.000 | 0.610 | 0.390 | ||
| 2 spectra, VAQEQGSHPK | 0.000 | 0.000 | 0.038 | 0.130 | 0.000 | 0.000 | 0.574 | 0.258 | ||
| 2 spectra, LVLDQLR | 0.000 | 0.000 | 0.000 | 0.000 | 0.009 | 0.223 | 0.703 | 0.065 | ||
| 1 spectrum, ELFQETLESLR | 0.000 | 0.000 | 0.000 | 0.000 | 0.000 | 0.000 | 0.672 | 0.328 | ||
| 2 spectra, EQMEEEVVAR | 0.000 | 0.000 | 0.000 | 0.000 | 0.000 | 0.000 | 0.752 | 0.248 | ||
| 1 spectrum, ALSLTR | 0.000 | 0.000 | 0.000 | 0.000 | 0.035 | 0.000 | 0.755 | 0.210 | ||
| 2 spectra, ALEEEQEAR | 0.000 | 0.000 | 0.000 | 0.000 | 0.000 | 0.042 | 0.782 | 0.176 | ||
| 1 spectrum, AQVELESVSTALSEAESK | 0.000 | 0.000 | 0.000 | 0.000 | 0.000 | 0.000 | 0.686 | 0.314 |
| Plot | Mito | Lyso or Perox | ER | Golgi | PM | Cytosol | Nucleus | ||||||
| Expt B |
4 peptides |
7 spectra |
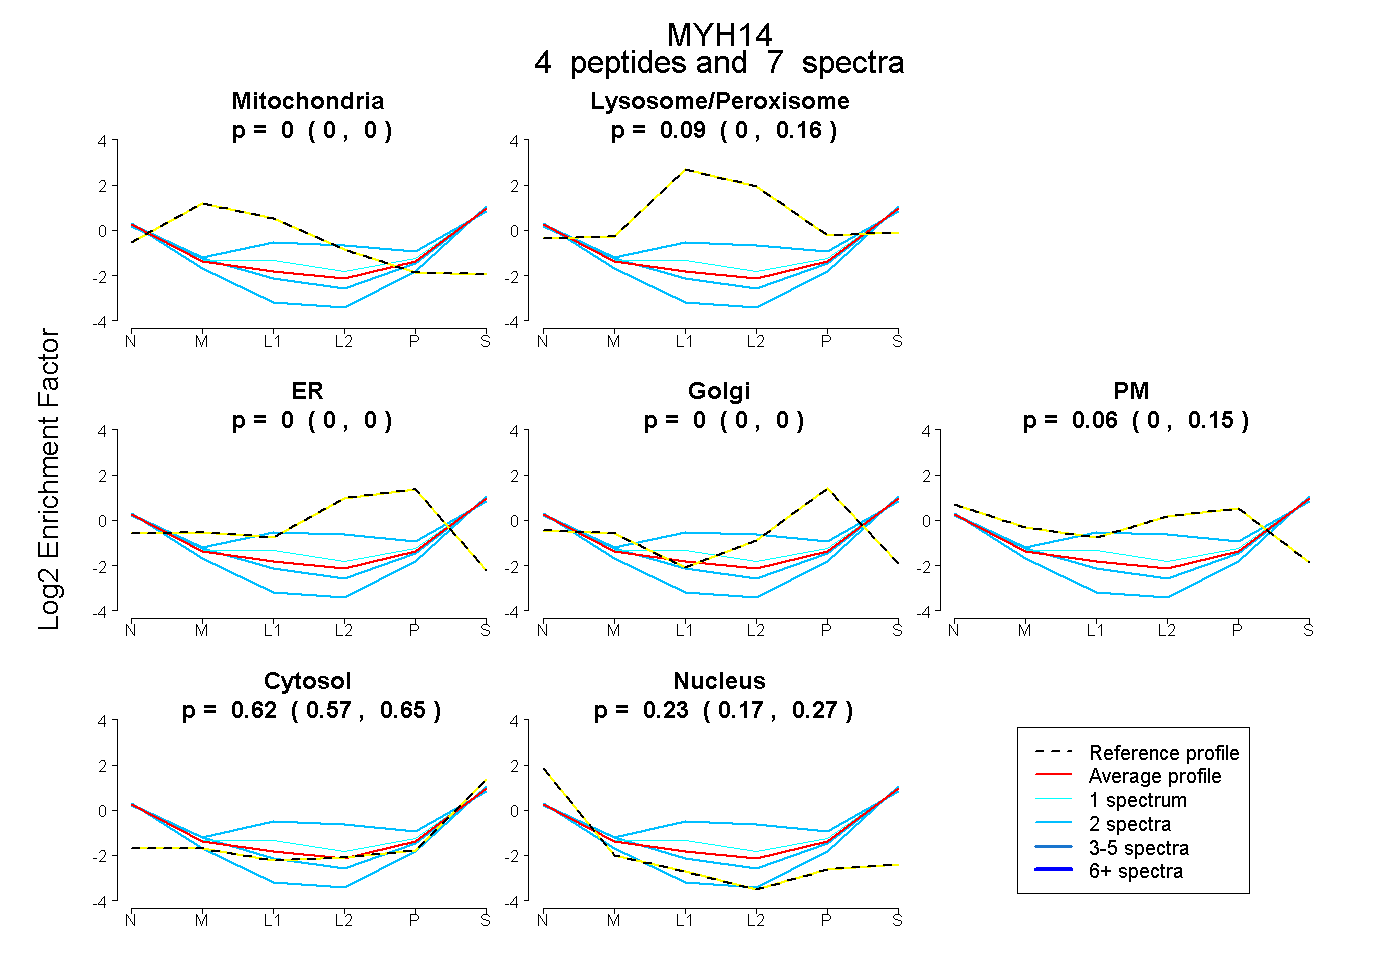 |
0.000 0.000 | 0.000 |
0.085 0.000 | 0.164 |
0.000 0.000 | 0.000 |
0.000 0.000 | 0.000 |
0.065 0.000 | 0.153 |
0.619 0.571 | 0.654 |
0.231 0.171 | 0.269 |
|||
| Plot | Lyso | Other | |||||||||||
| Expt C |
8 peptides |
17 spectra |
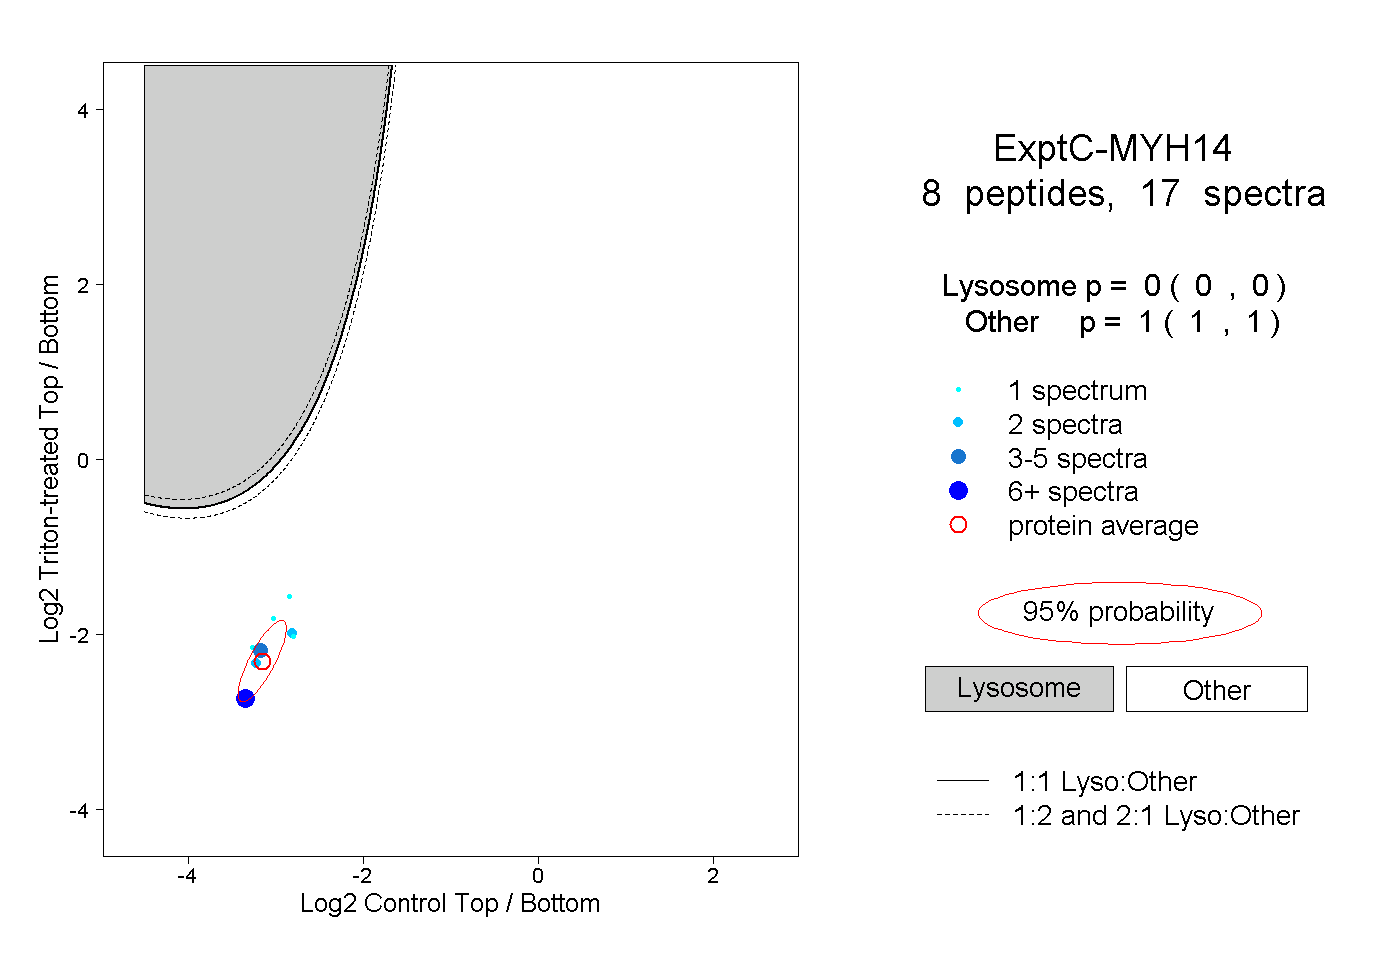 |
0.000 0.000 | 0.000 |
1.000 1.000 | 1.000 |
||||||||
| Plot | Lyso | Other | |||||||||||
| Expt D |
2 peptides |
2 spectra |
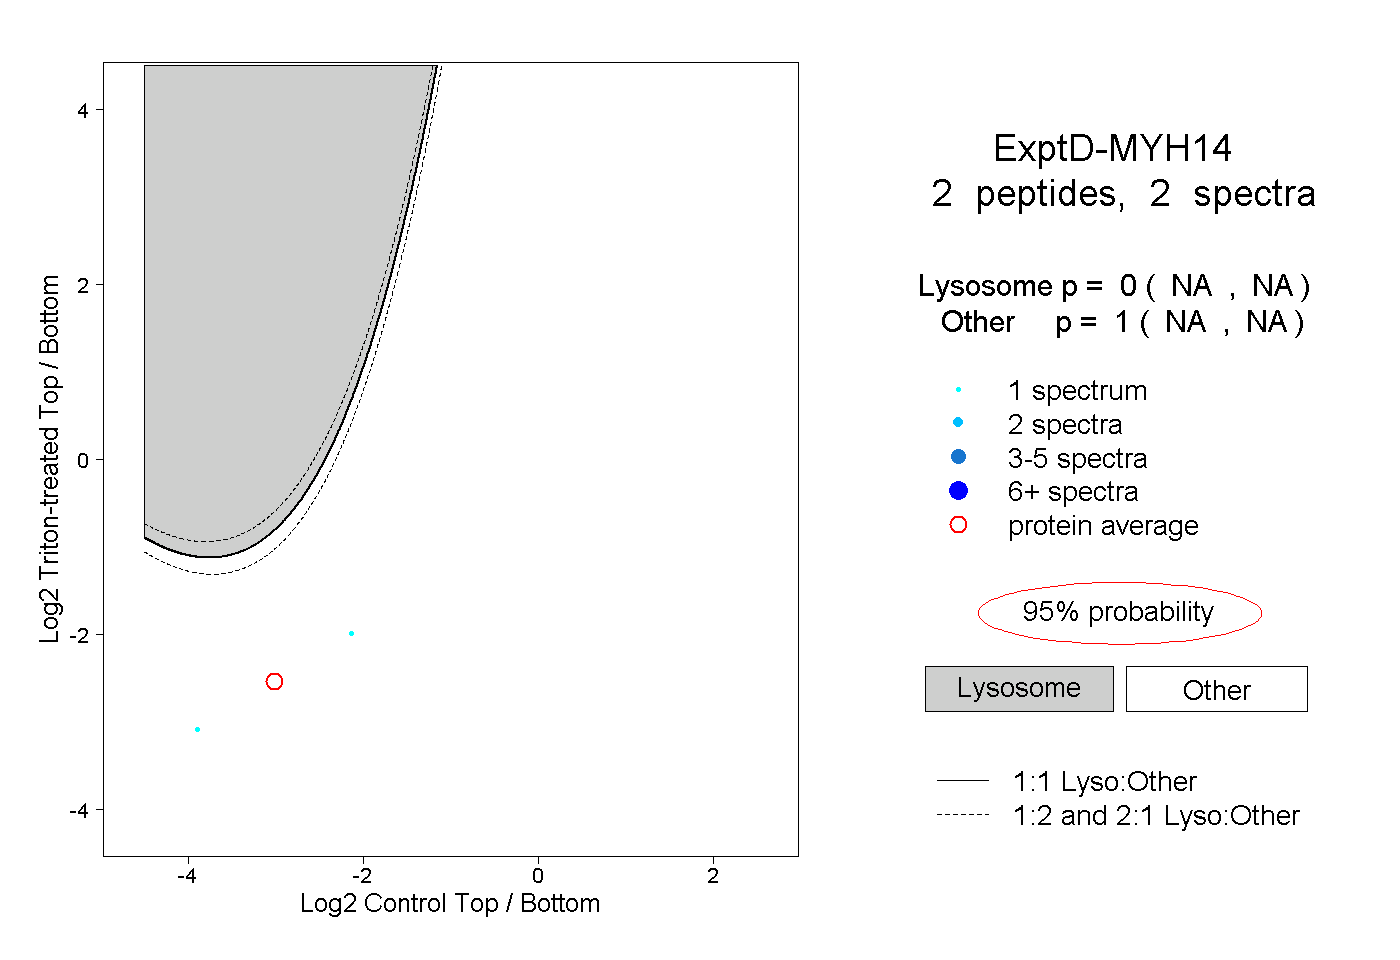 |
0.000 NA | NA |
1.000 NA | NA |