 13
13peptides
spectra
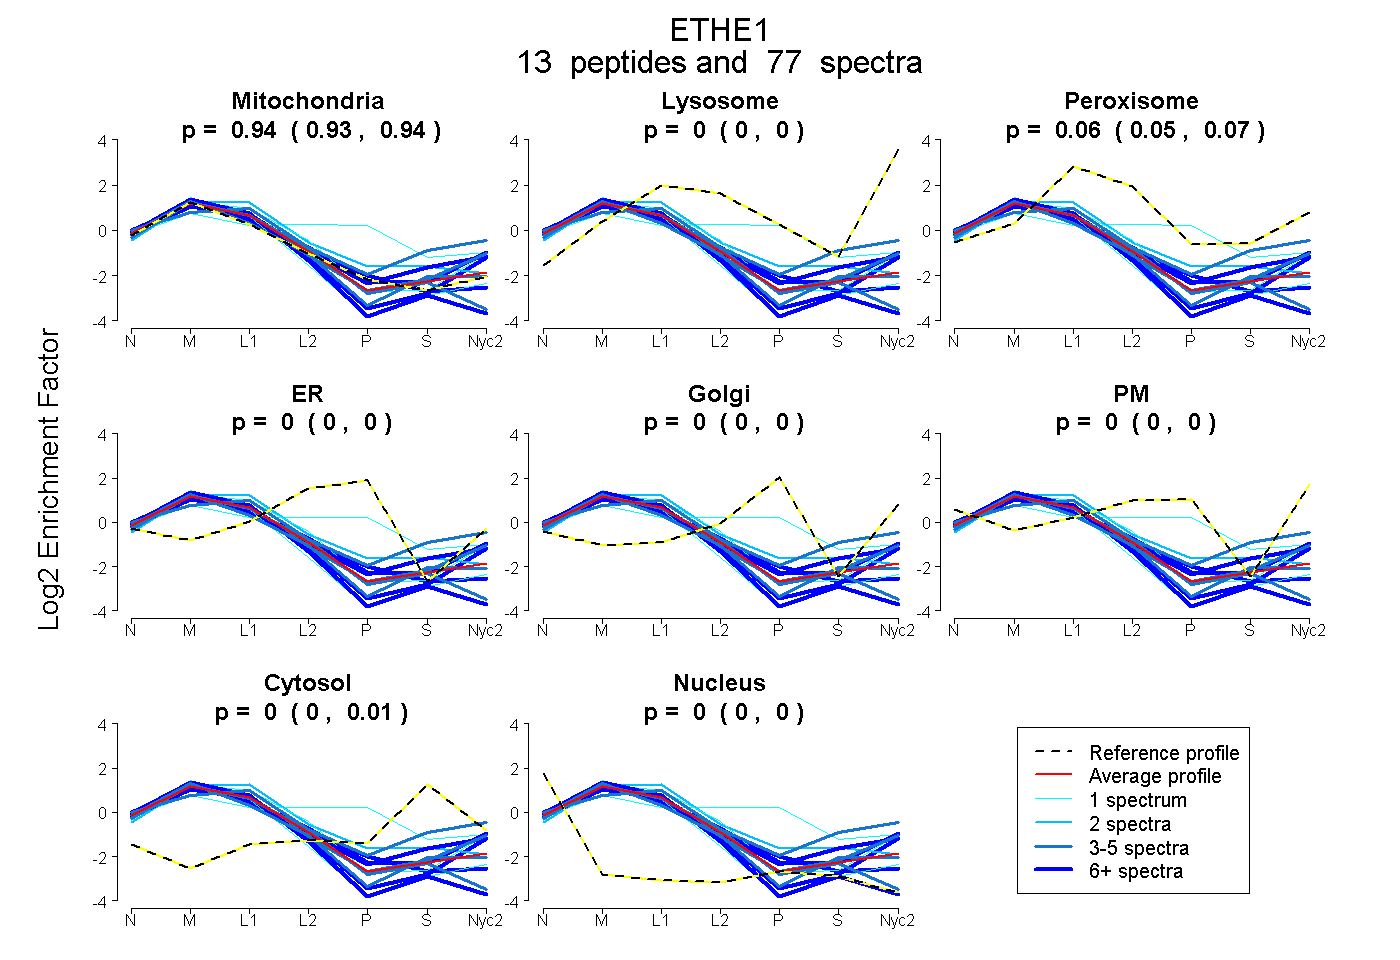
0.926 | 0.942
0.000 | 0.000
0.053 | 0.067
0.000 | 0.000
0.000 | 0.000
0.000 | 0.000
0.000 | 0.008
0.000 | 0.000
9peptides
spectra
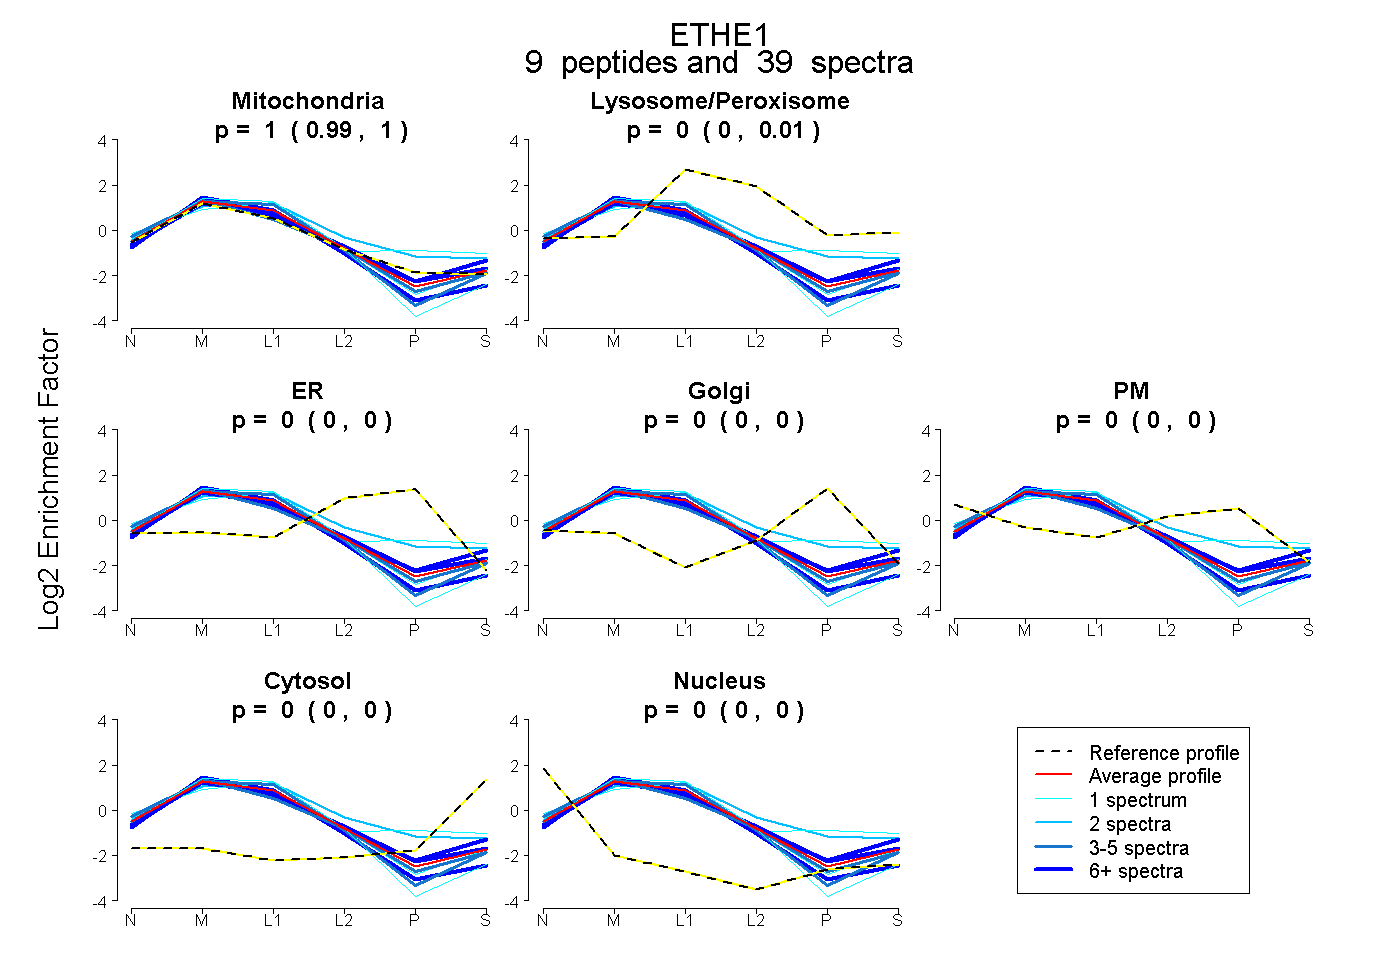
0.988 | 1.000
0.000 | 0.010
0.000 | 0.000
0.000 | 0.000
0.000 | 0.000
0.000 | 0.000
0.000 | 0.000
10peptides
spectra
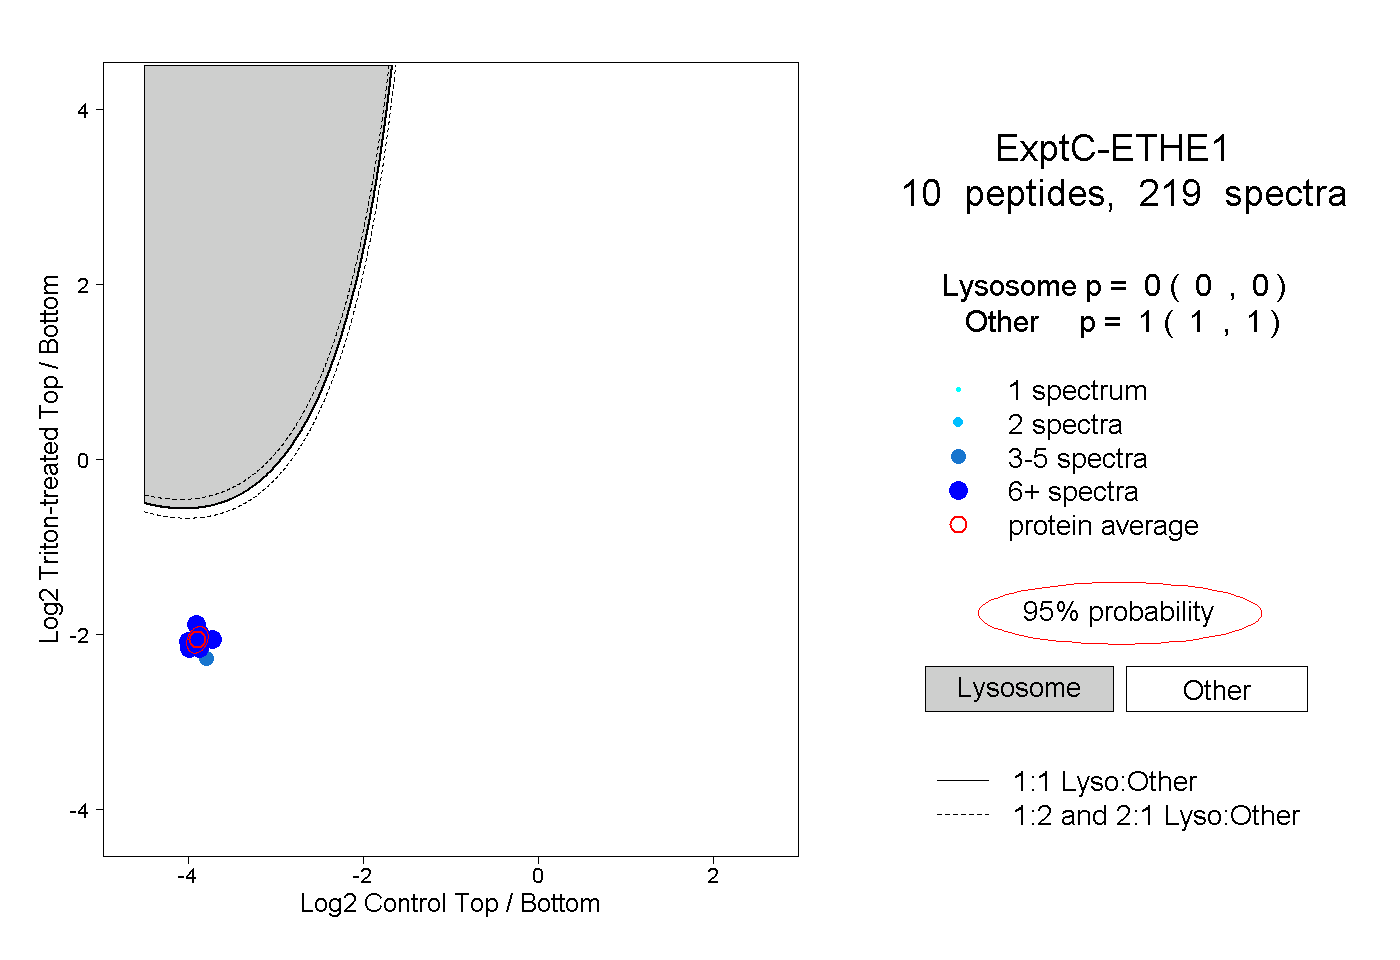
0.000 | 0.000
1.000 | 1.000
5peptides
spectra
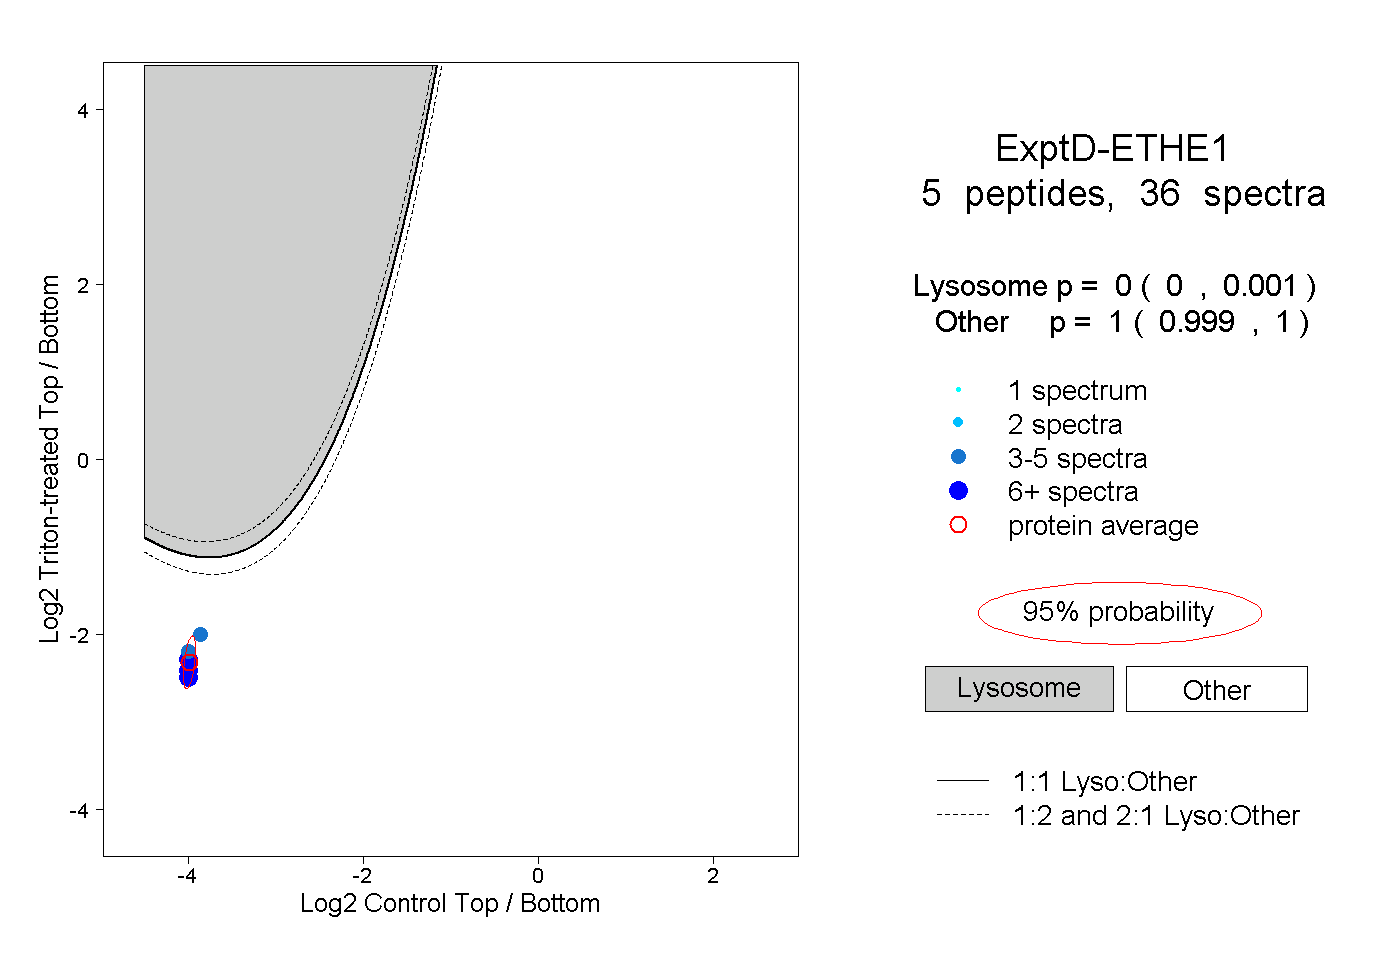
0.000 | 0.001
0.999 | 1.000