 13
13peptides
spectra
0.926 | 0.942
0.000 | 0.000
0.053 | 0.067
0.000 | 0.000
0.000 | 0.000
0.000 | 0.000
0.000 | 0.008
0.000 | 0.000
| Plot | Mito | Lyso | Perox | ER | Golgi | PM | Cytosol | Nucleus | |||||
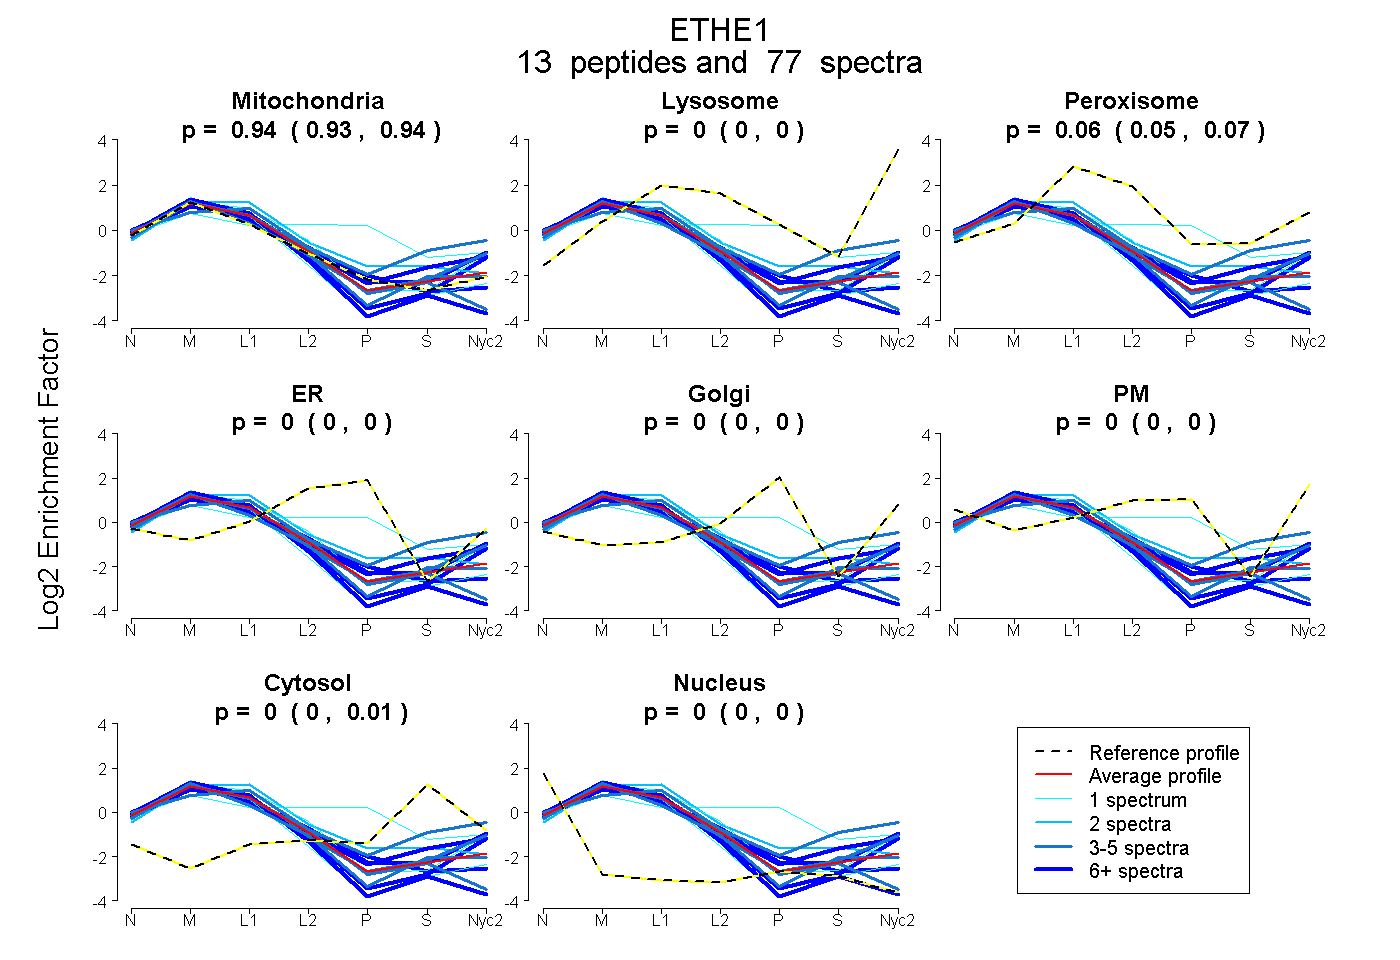
| Expt A |
13 peptides |
77 spectra |
|
0.935 0.926 | 0.942 |
0.000 0.000 | 0.000 |
0.061 0.053 | 0.067 |
0.000 0.000 | 0.000 |
0.000 0.000 | 0.000 |
0.000 0.000 | 0.000 |
0.004 0.000 | 0.008 |
0.000 0.000 | 0.000 |
| 1 spectrum, DAQLIK | 0.369 | 0.000 | 0.178 | 0.292 | 0.072 | 0.000 | 0.088 | 0.000 | ||
| 5 spectra, TDFQQGCAK | 0.970 | 0.000 | 0.000 | 0.000 | 0.000 | 0.000 | 0.030 | 0.000 | ||
| 11 spectra, EAILIDPVLETAHR | 0.972 | 0.000 | 0.000 | 0.017 | 0.000 | 0.000 | 0.000 | 0.011 | ||
| 5 spectra, VMDNLNLPKPHQIDIAVPANMR | 0.977 | 0.000 | 0.000 | 0.000 | 0.000 | 0.000 | 0.000 | 0.023 | ||
| 8 spectra, LSGAQADLHIGEGDSIPFGR | 0.818 | 0.129 | 0.032 | 0.000 | 0.000 | 0.000 | 0.000 | 0.021 | ||
| 2 spectra, LLYAVNTHCHADHITGSGVLR | 0.747 | 0.000 | 0.235 | 0.000 | 0.000 | 0.000 | 0.017 | 0.000 | ||
| 1 spectrum, SCTYTYLLGDR | 0.990 | 0.000 | 0.000 | 0.000 | 0.000 | 0.000 | 0.000 | 0.010 | ||
| 8 spectra, LTLSCEEFIK | 0.761 | 0.005 | 0.149 | 0.000 | 0.000 | 0.000 | 0.085 | 0.000 | ||
| 1 spectrum, LSQQSASGAPVLLR | 0.827 | 0.039 | 0.133 | 0.000 | 0.000 | 0.000 | 0.000 | 0.000 | ||
| 7 spectra, FALETR | 0.973 | 0.027 | 0.000 | 0.000 | 0.000 | 0.000 | 0.000 | 0.000 | ||
| 3 spectra, QMFEPK | 0.893 | 0.106 | 0.000 | 0.000 | 0.000 | 0.000 | 0.002 | 0.000 | ||
| 3 spectra, TLYHSVHEK | 0.543 | 0.037 | 0.269 | 0.000 | 0.000 | 0.000 | 0.151 | 0.000 | ||
| 22 spectra, SLLPGCQSVISR | 0.938 | 0.000 | 0.000 | 0.000 | 0.000 | 0.000 | 0.000 | 0.062 |
| Plot | Mito | Lyso or Perox | ER | Golgi | PM | Cytosol | Nucleus | ||||||
| Expt B |
9 peptides |
39 spectra |
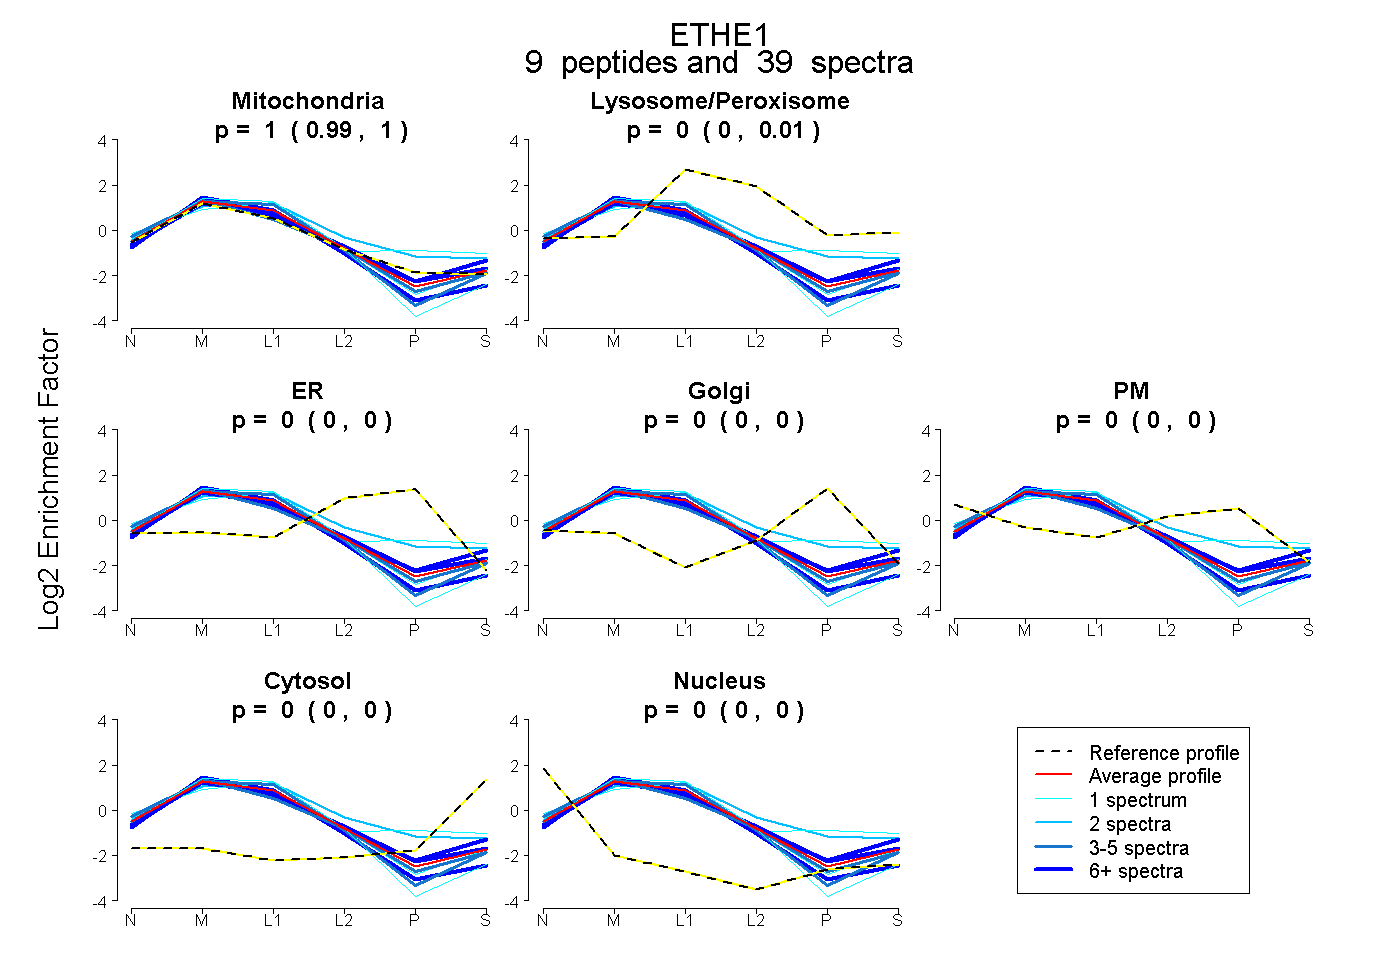 |
0.997 0.988 | 1.000 |
0.003 0.000 | 0.010 |
0.000 0.000 | 0.000 |
0.000 0.000 | 0.000 |
0.000 0.000 | 0.000 |
0.000 0.000 | 0.000 |
0.000 0.000 | 0.000 |
|||
| Plot | Lyso | Other | |||||||||||
| Expt C |
10 peptides |
219 spectra |
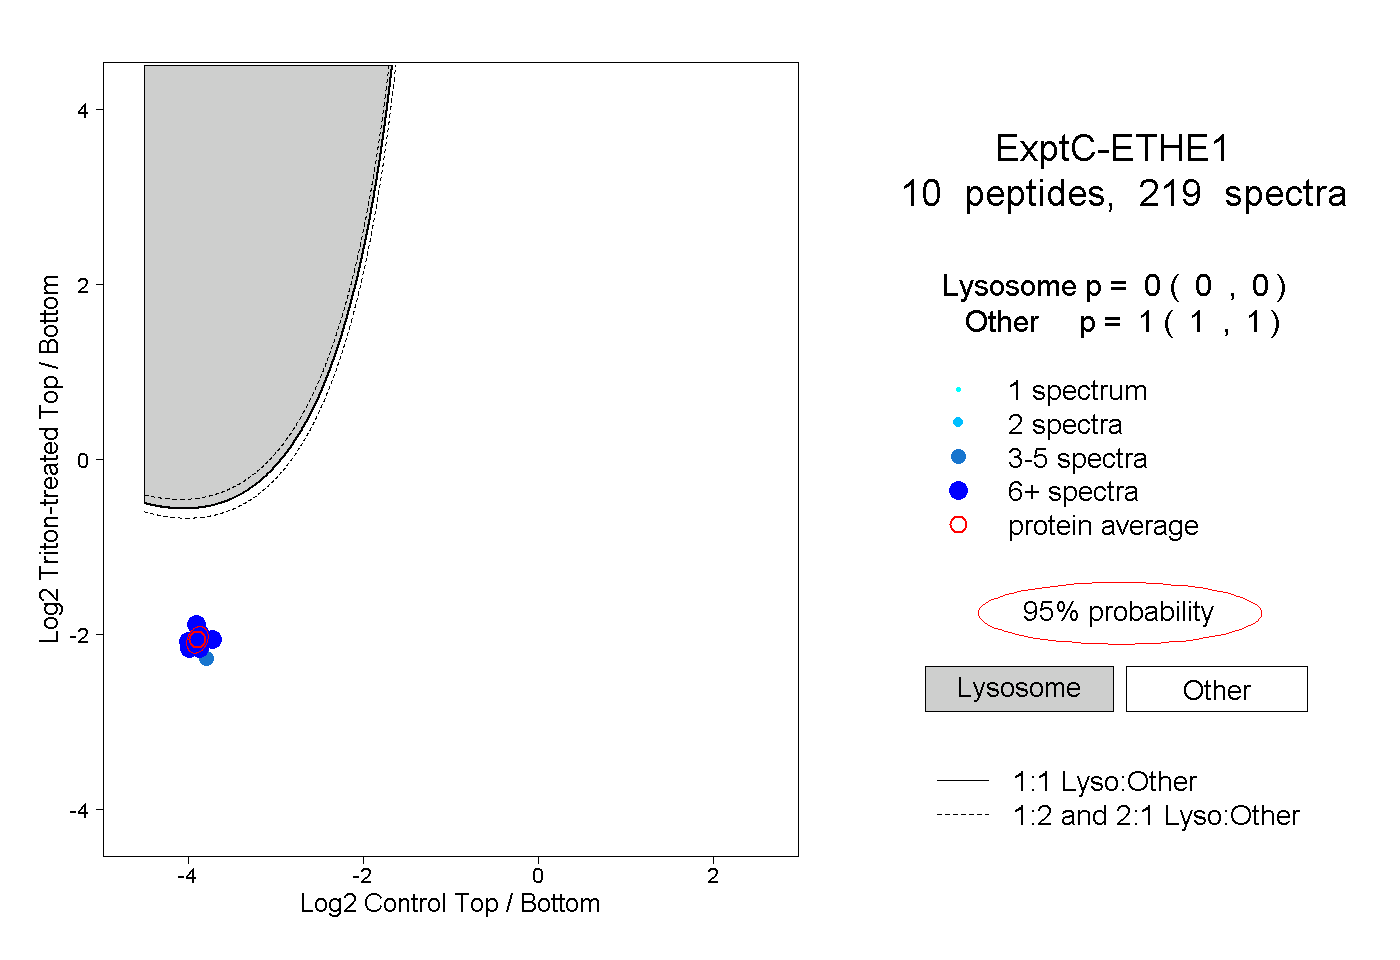 |
0.000 0.000 | 0.000 |
1.000 1.000 | 1.000 |
||||||||
| Plot | Lyso | Other | |||||||||||
| Expt D |
5 peptides |
36 spectra |
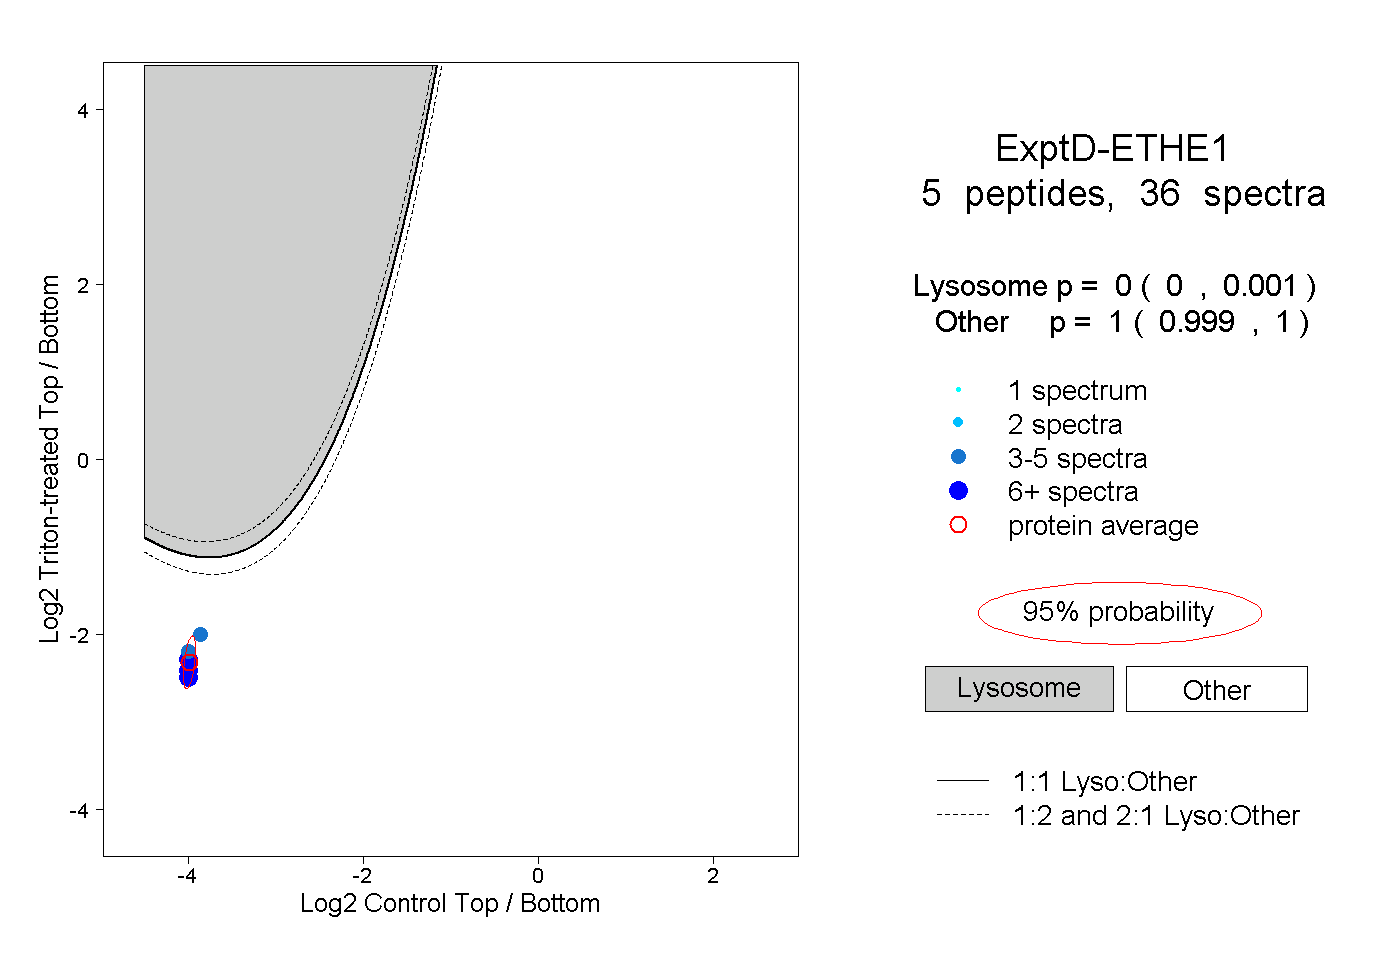 |
0.000 0.000 | 0.001 |
1.000 0.999 | 1.000 |