 14
14peptides
spectra
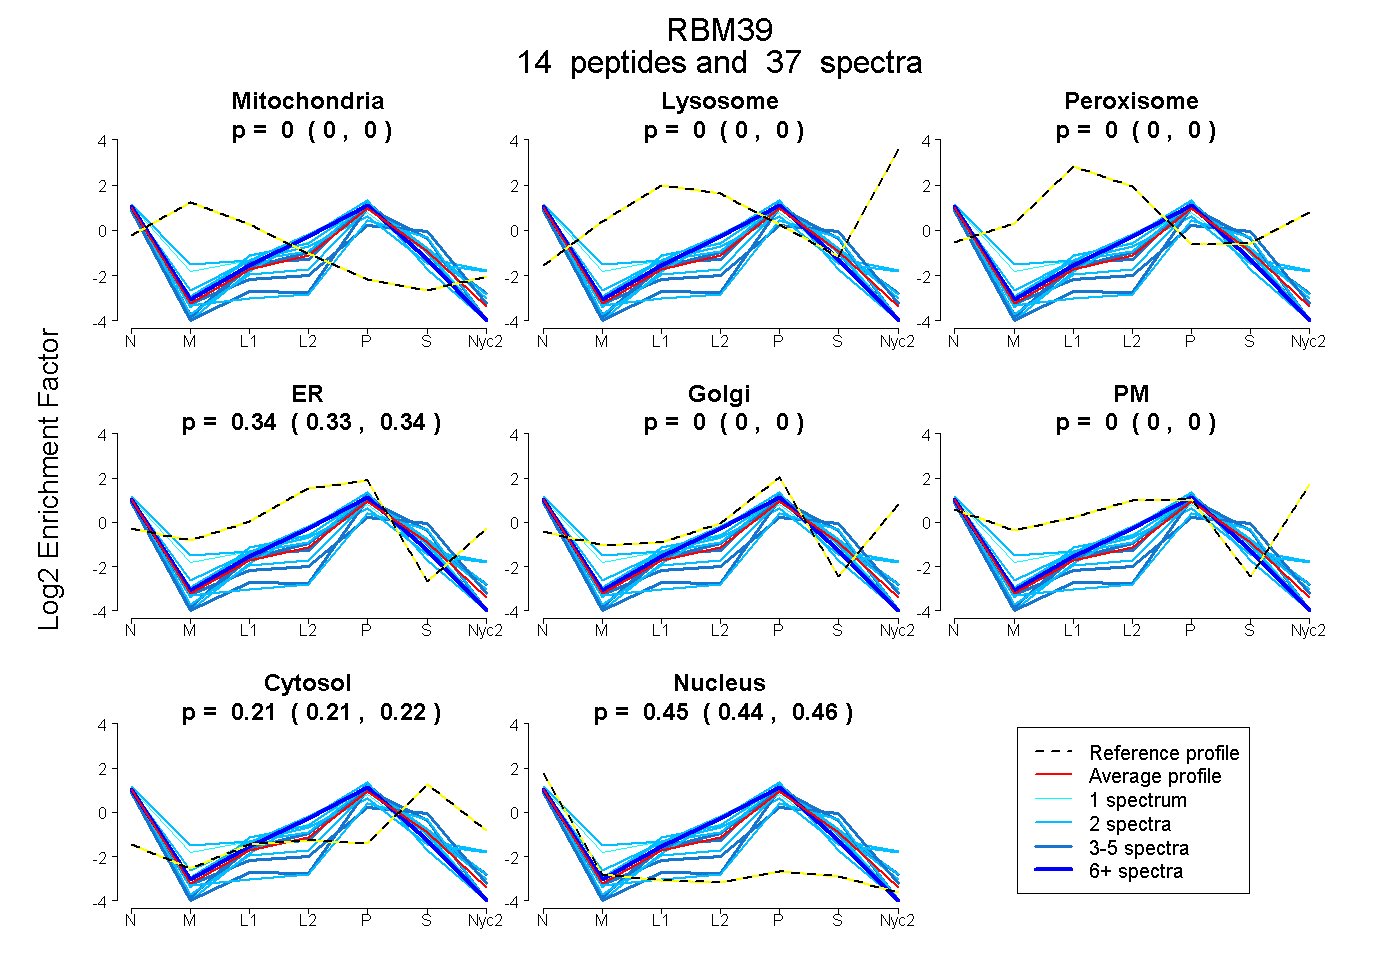
0.000 | 0.000
0.000 | 0.000
0.000 | 0.000
0.327 | 0.342
0.000 | 0.000
0.000 | 0.000
0.207 | 0.222
0.442 | 0.456
5peptides
spectra
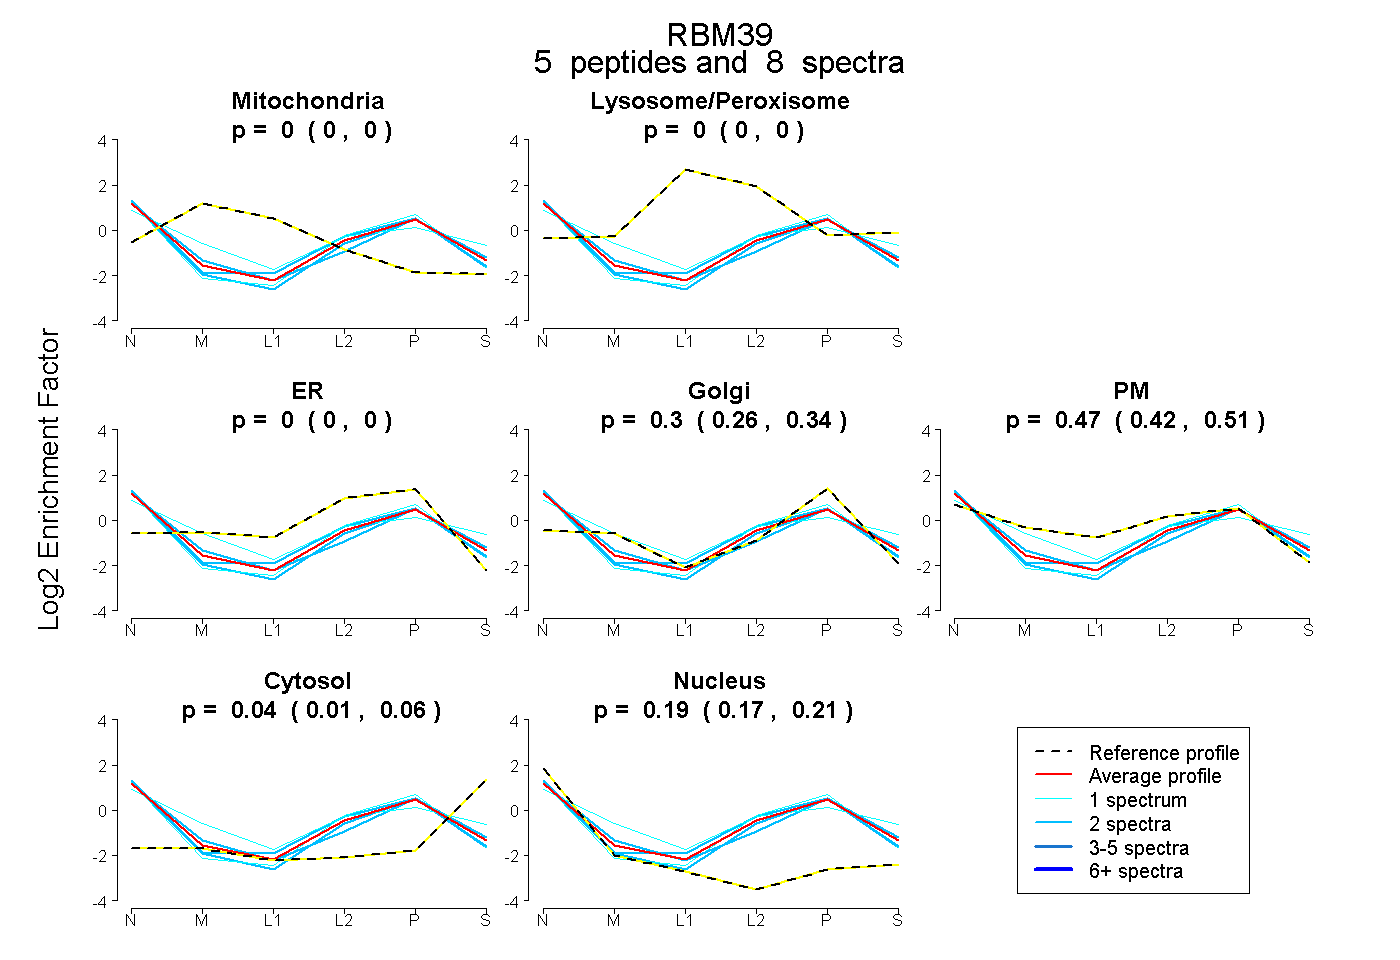
0.000 | 0.000
0.000 | 0.000
0.000 | 0.000
0.260 | 0.338
0.420 | 0.505
0.012 | 0.058
0.172 | 0.212
3peptides
spectra
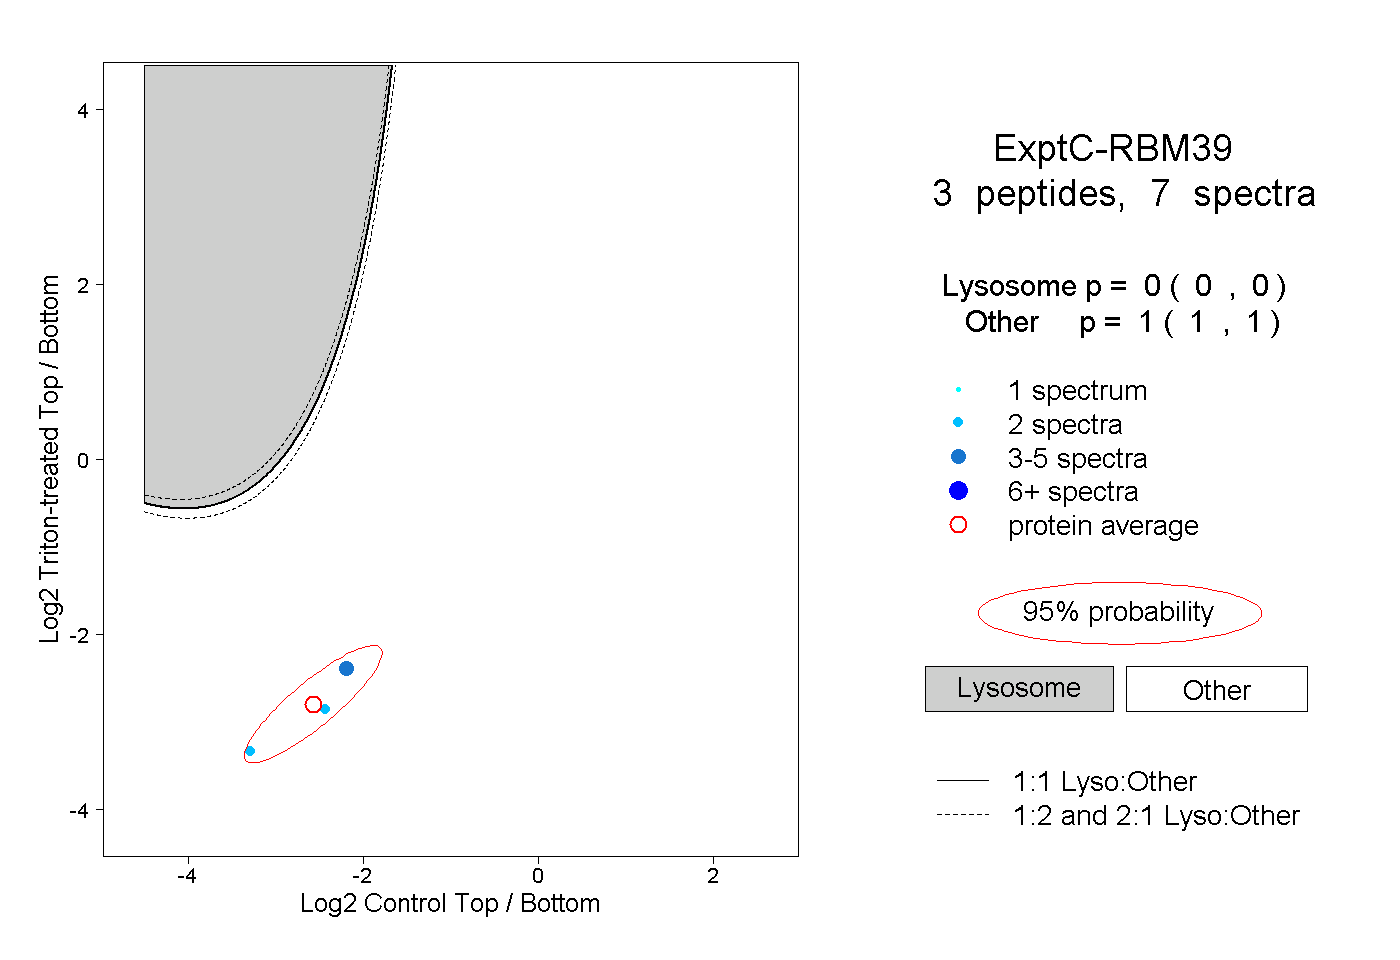
0.000 | 0.000
1.000 | 1.000
1peptide
spectrum
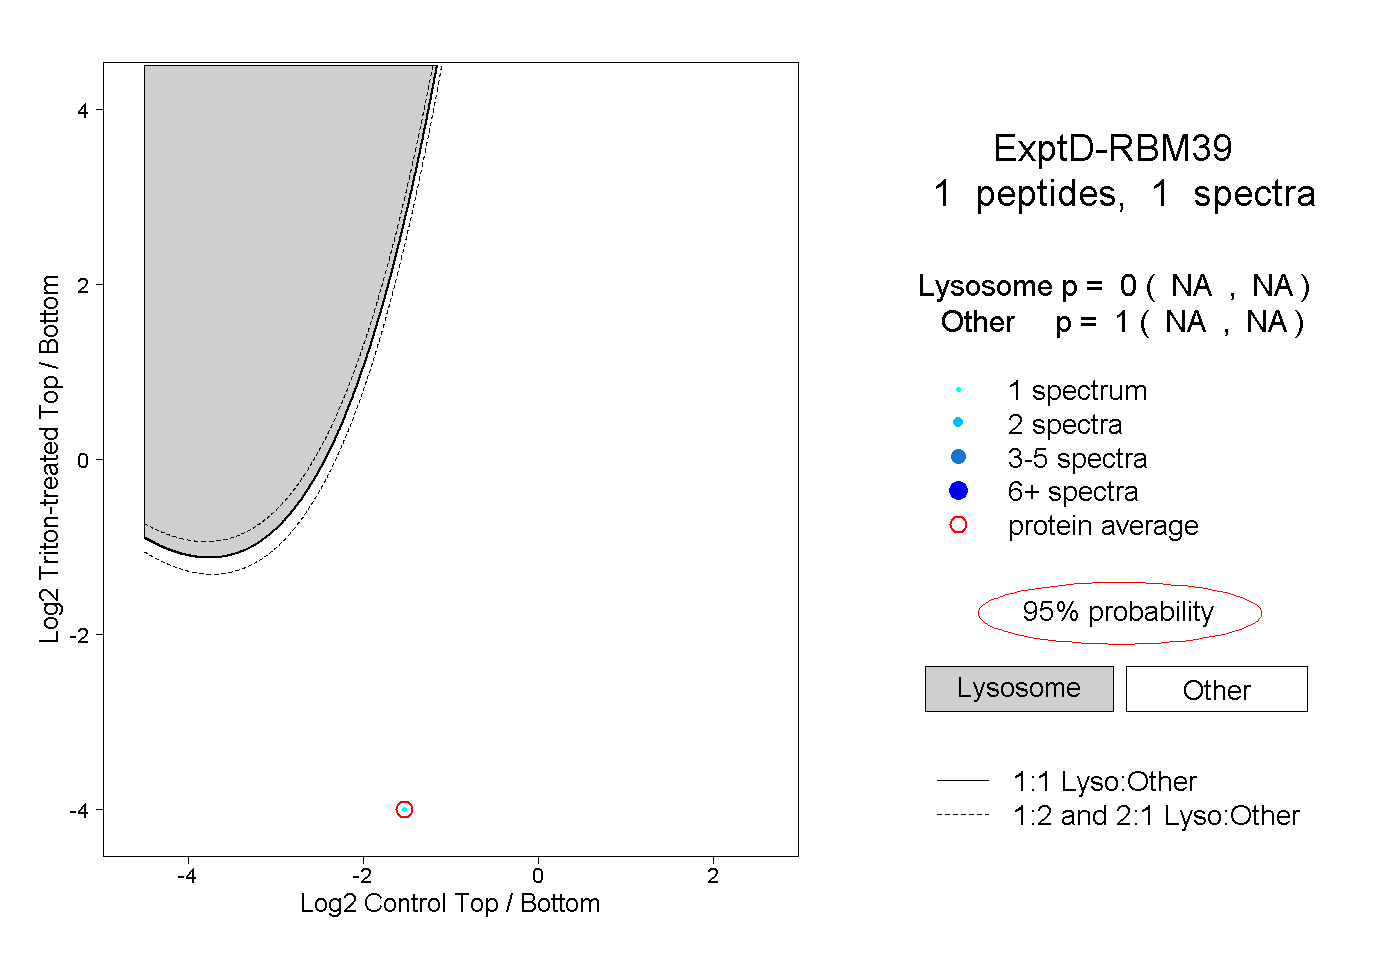
NA | NA
NA | NA