RBM39
[ENSRNOP00000026964]
Main page
| | | Plot |
Mito |
Lyso |
|
Perox |
ER |
Golgi |
PM |
Cytosol |
Nucleus |
|
| Expt A |
 14
14
peptides |
37
spectra |
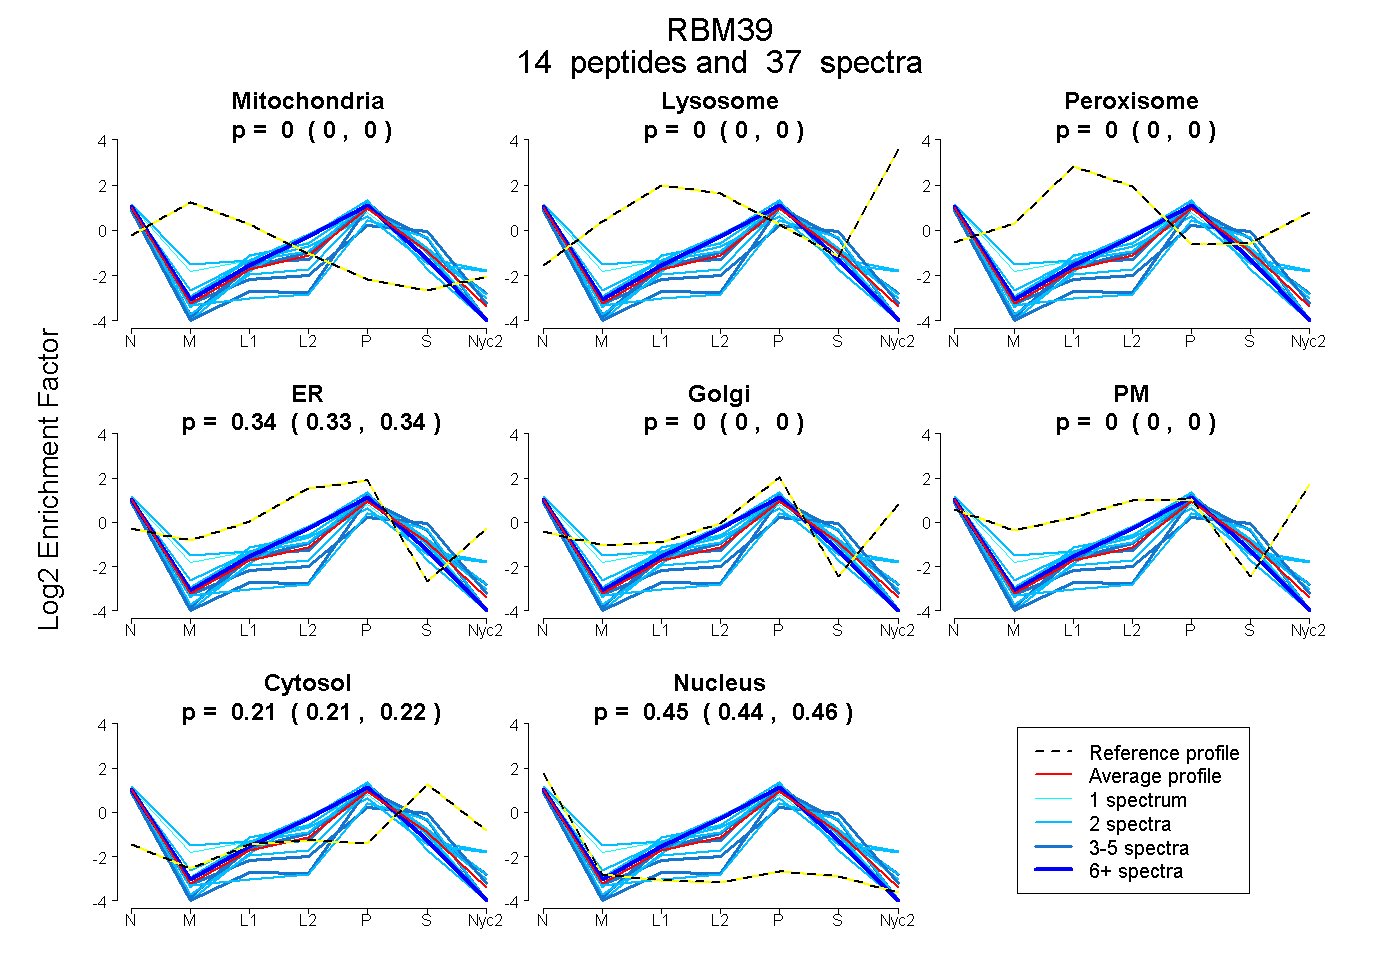 |
0.000
0.000 | 0.000 |
0.000
0.000 | 0.000 |
|
0.000
0.000 | 0.000 |
0.336
0.327 | 0.342 |
0.000
0.000 | 0.000 |
0.000
0.000 | 0.000 |
0.215
0.207 | 0.222 |
0.450
0.442 | 0.456 |
|
| | | Plot |
Mito |
|
Lyso or Perox |
|
ER |
Golgi |
PM |
Cytosol |
Nucleus |
|
| Expt B |
5
peptides |
8
spectra |
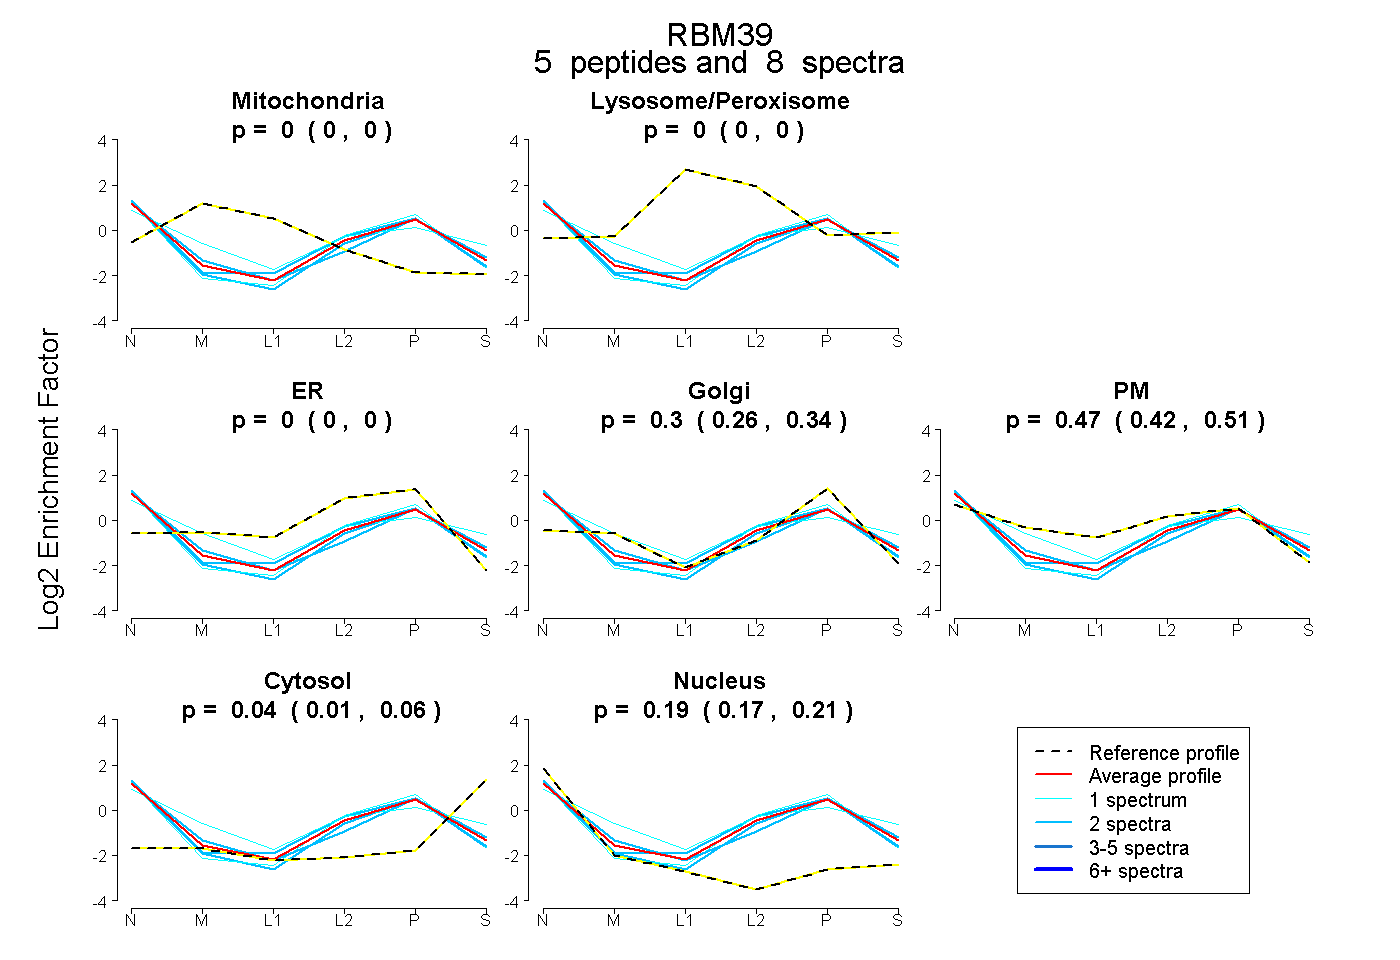 |
0.000
0.000 | 0.000 |
|
0.000
0.000 | 0.000 |
|
0.000
0.000 | 0.000 |
0.302
0.260 | 0.338 |
0.466
0.420 | 0.505 |
0.037
0.012 | 0.058 |
0.194
0.172 | 0.212 |
|
| 2 spectra, TGIDLGTTGR |
0.000 |
|
0.000 |
|
0.000 |
0.410 |
0.340 |
0.000 |
0.250 |
|
| 1 spectrum, IGLPHSIK |
0.000 |
|
0.000 |
|
0.215 |
0.328 |
0.199 |
0.000 |
0.258 |
|
| 2 spectra, GIFEPFGR |
0.000 |
|
0.000 |
|
0.000 |
0.409 |
0.305 |
0.053 |
0.234 |
|
| 1 spectrum, TVFCMQLAAR |
0.000 |
|
0.000 |
|
0.000 |
0.000 |
0.747 |
0.213 |
0.041 |
|
| 2 spectra, DLEEFFSTVGK |
0.000 |
|
0.000 |
|
0.143 |
0.160 |
0.459 |
0.000 |
0.238 |
|
| | | Plot |
|
Lyso |
|
|
|
|
|
|
|
Other |
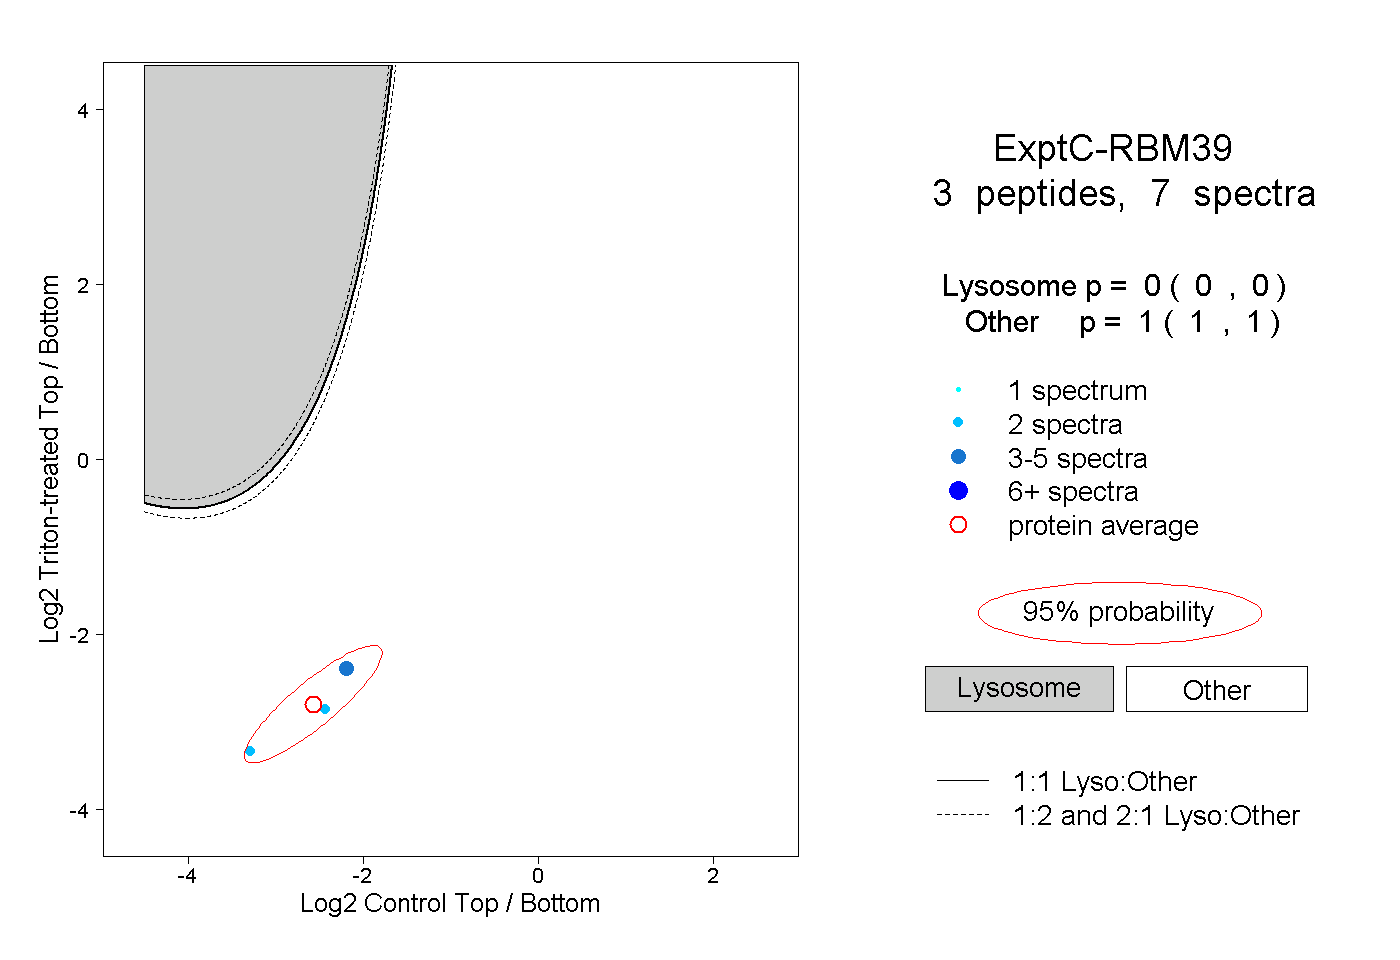
| Expt C |
3
peptides |
7
spectra |
 |
|
0.000
0.000 | 0.000 |
|
|
|
|
|
|
|
1.000
1.000 | 1.000 |
| | | Plot |
|
Lyso |
|
|
|
|
|
|
|
Other |
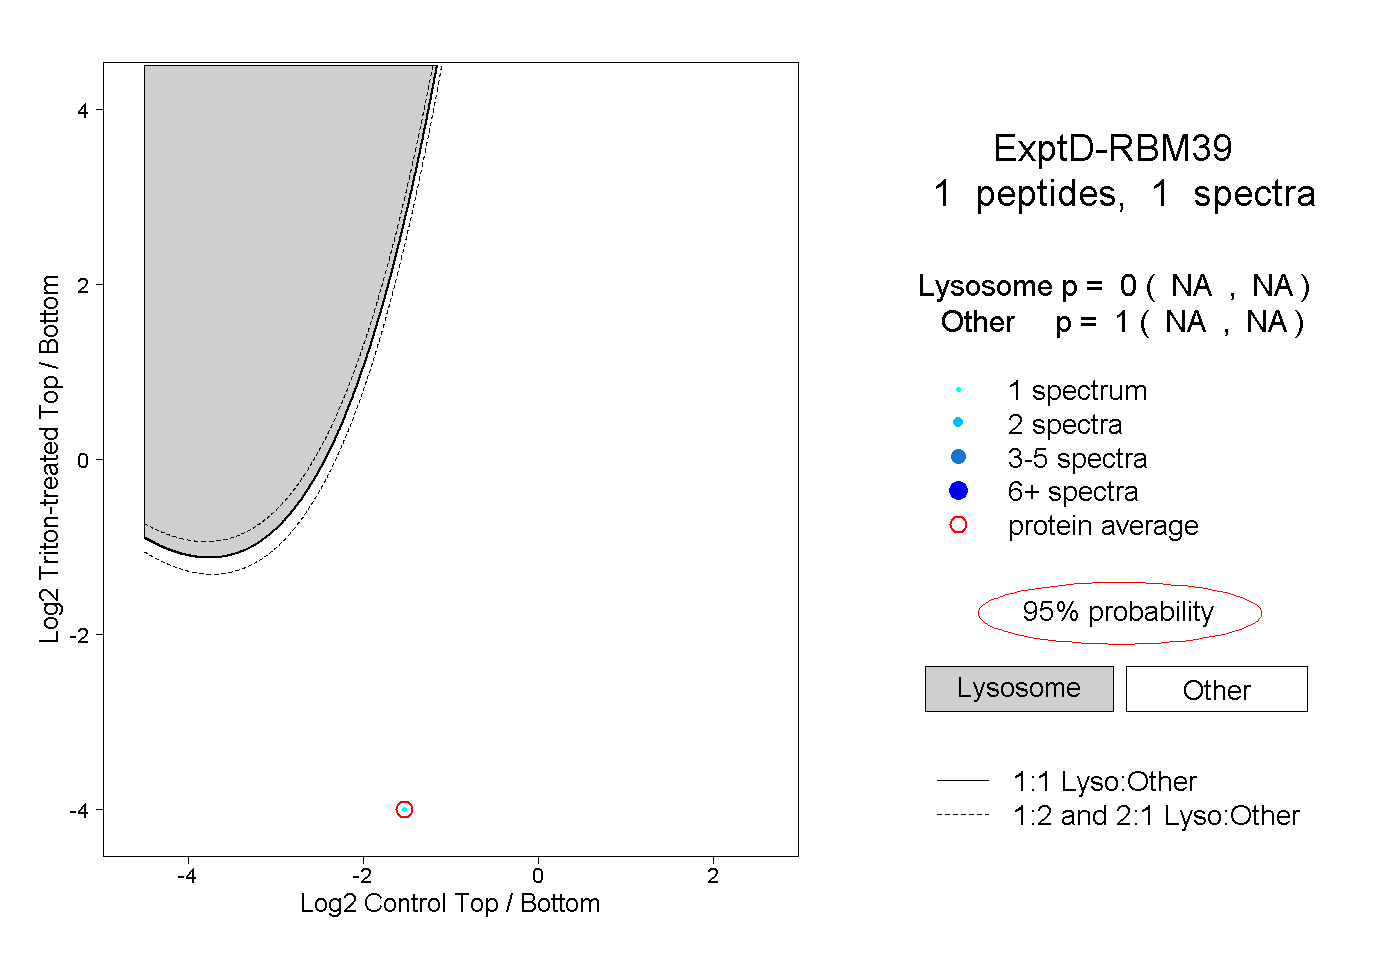
| Expt D |
1
peptide |
1
spectrum |
 |
|
0.000
NA | NA |
|
|
|
|
|
|
|
1.000
NA | NA |