 14
14peptides
spectra
0.000 | 0.000
0.000 | 0.000
0.000 | 0.000
0.327 | 0.342
0.000 | 0.000
0.000 | 0.000
0.207 | 0.222
0.442 | 0.456
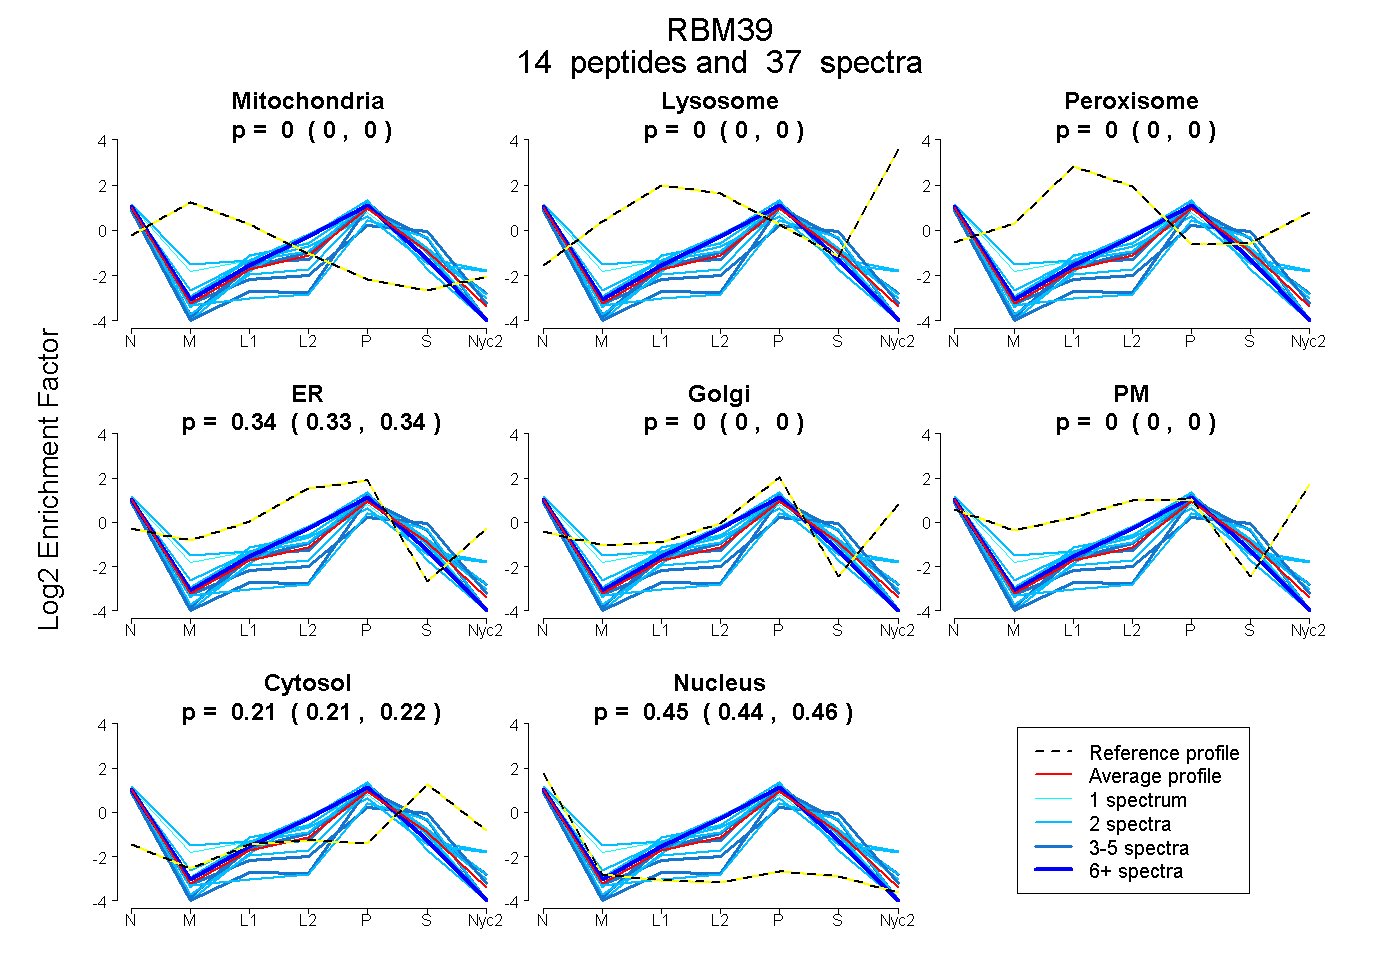
| Plot | Mito | Lyso | Perox | ER | Golgi | PM | Cytosol | Nucleus | |||||
| Expt A |
14 peptides |
37 spectra |
|
0.000 0.000 | 0.000 |
0.000 0.000 | 0.000 |
0.000 0.000 | 0.000 |
0.336 0.327 | 0.342 |
0.000 0.000 | 0.000 |
0.000 0.000 | 0.000 |
0.215 0.207 | 0.222 |
0.450 0.442 | 0.456 |
| 2 spectra, IGLPHSIK | 0.000 | 0.000 | 0.000 | 0.448 | 0.000 | 0.000 | 0.035 | 0.517 | ||
| 2 spectra, FNSAIR | 0.000 | 0.000 | 0.000 | 0.530 | 0.000 | 0.000 | 0.183 | 0.287 | ||
| 1 spectrum, ALEQLNGFELAGRPMK | 0.000 | 0.000 | 0.000 | 0.441 | 0.000 | 0.000 | 0.092 | 0.467 | ||
| 2 spectra, NSAQGNVYVK | 0.000 | 0.000 | 0.000 | 0.000 | 0.053 | 0.000 | 0.332 | 0.615 | ||
| 3 spectra, LQLMAR | 0.000 | 0.000 | 0.000 | 0.000 | 0.101 | 0.000 | 0.327 | 0.572 | ||
| 4 spectra, GIFEPFGR | 0.000 | 0.000 | 0.000 | 0.345 | 0.000 | 0.000 | 0.258 | 0.398 | ||
| 2 spectra, GSAGPMR | 0.000 | 0.000 | 0.000 | 0.399 | 0.000 | 0.000 | 0.251 | 0.350 | ||
| 8 spectra, TVFCMQLAAR | 0.000 | 0.000 | 0.000 | 0.446 | 0.000 | 0.000 | 0.092 | 0.462 | ||
| 3 spectra, HGGVIHIYVDK | 0.000 | 0.000 | 0.000 | 0.113 | 0.000 | 0.000 | 0.431 | 0.456 | ||
| 2 spectra, TDASSASSFLDSDELER | 0.000 | 0.000 | 0.000 | 0.251 | 0.000 | 0.000 | 0.195 | 0.554 | ||
| 3 spectra, AAAMANNLQK | 0.000 | 0.000 | 0.000 | 0.325 | 0.000 | 0.000 | 0.191 | 0.483 | ||
| 1 spectrum, DLEEFFSTVGK | 0.000 | 0.000 | 0.000 | 0.390 | 0.000 | 0.000 | 0.183 | 0.427 | ||
| 2 spectra, GYGFITFSDSECAK | 0.000 | 0.000 | 0.000 | 0.414 | 0.000 | 0.000 | 0.236 | 0.349 | ||
| 2 spectra, IESIQLMMDSETGR | 0.000 | 0.000 | 0.000 | 0.459 | 0.067 | 0.000 | 0.127 | 0.347 |
| Plot | Mito | Lyso or Perox | ER | Golgi | PM | Cytosol | Nucleus | ||||||
| Expt B |
5 peptides |
8 spectra |
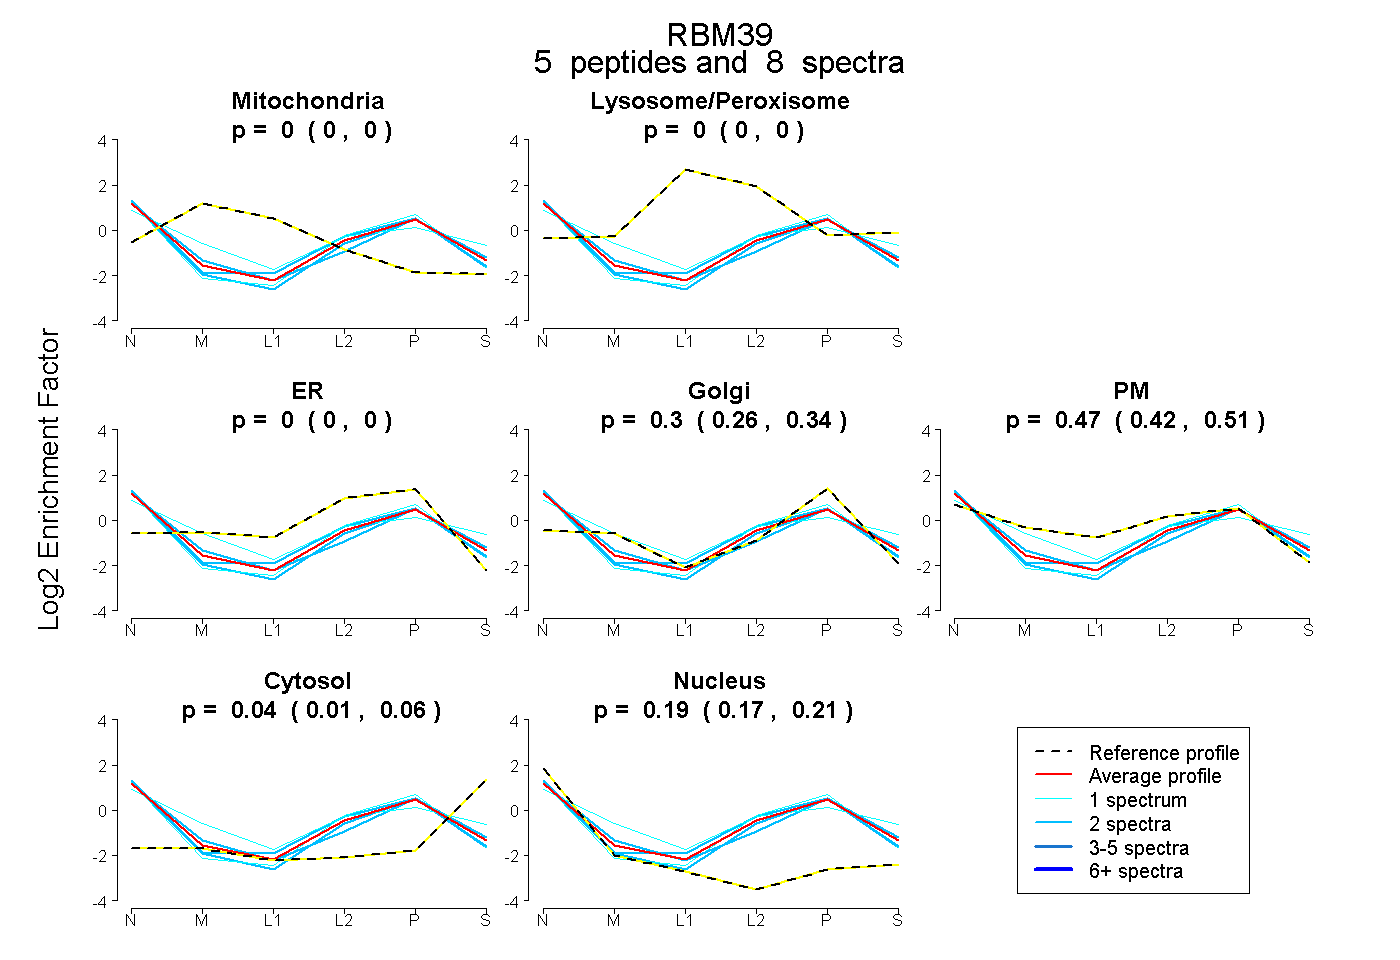 |
0.000 0.000 | 0.000 |
0.000 0.000 | 0.000 |
0.000 0.000 | 0.000 |
0.302 0.260 | 0.338 |
0.466 0.420 | 0.505 |
0.037 0.012 | 0.058 |
0.194 0.172 | 0.212 |
|||
| Plot | Lyso | Other | |||||||||||
| Expt C |
3 peptides |
7 spectra |
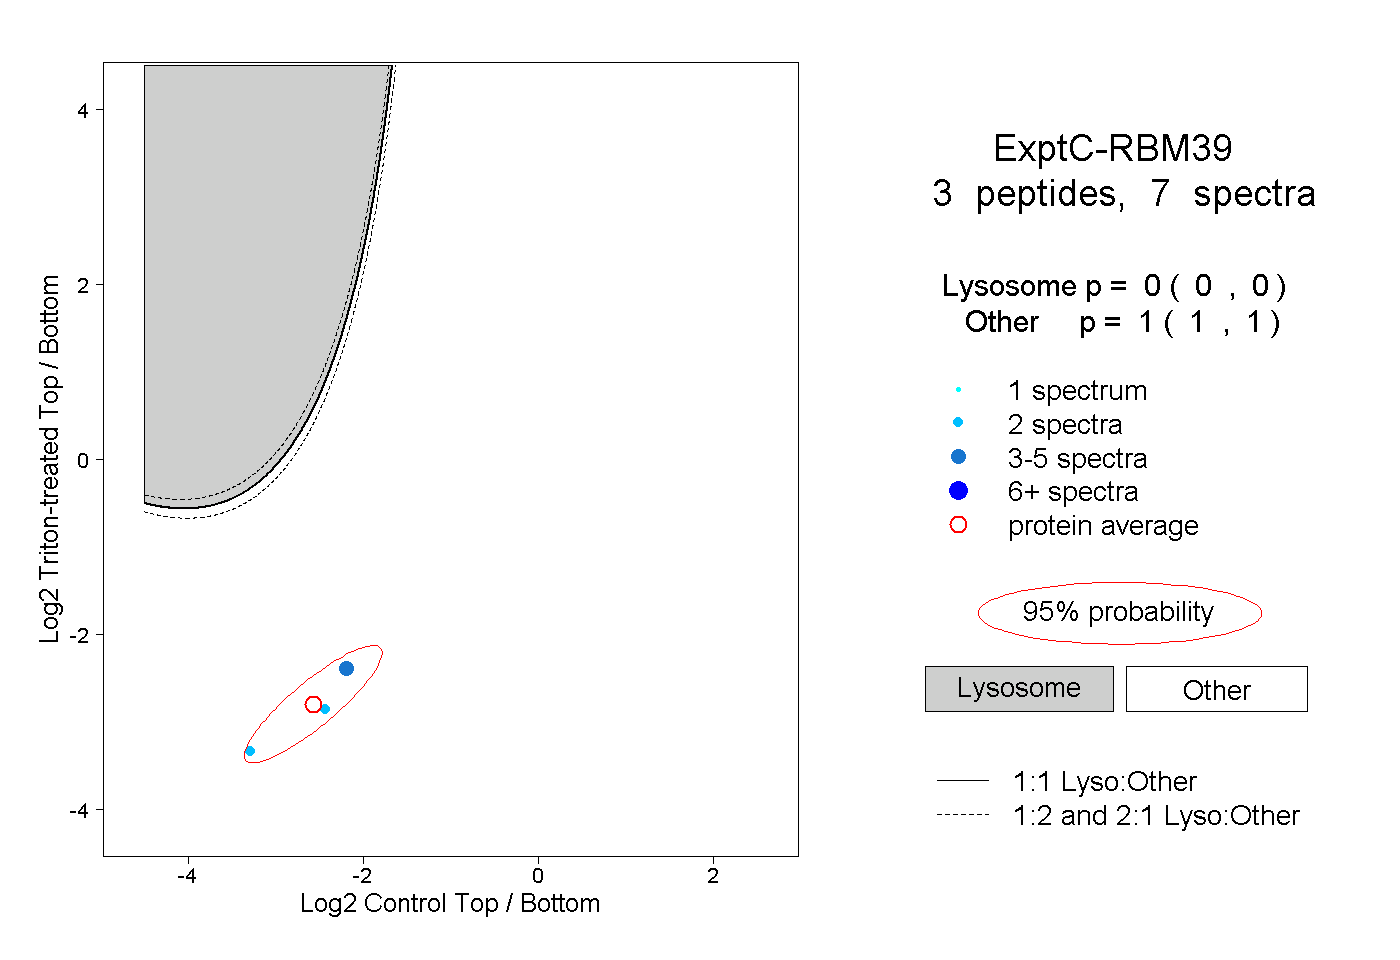 |
0.000 0.000 | 0.000 |
1.000 1.000 | 1.000 |
||||||||
| Plot | Lyso | Other | |||||||||||
| Expt D |
1 peptide |
1 spectrum |
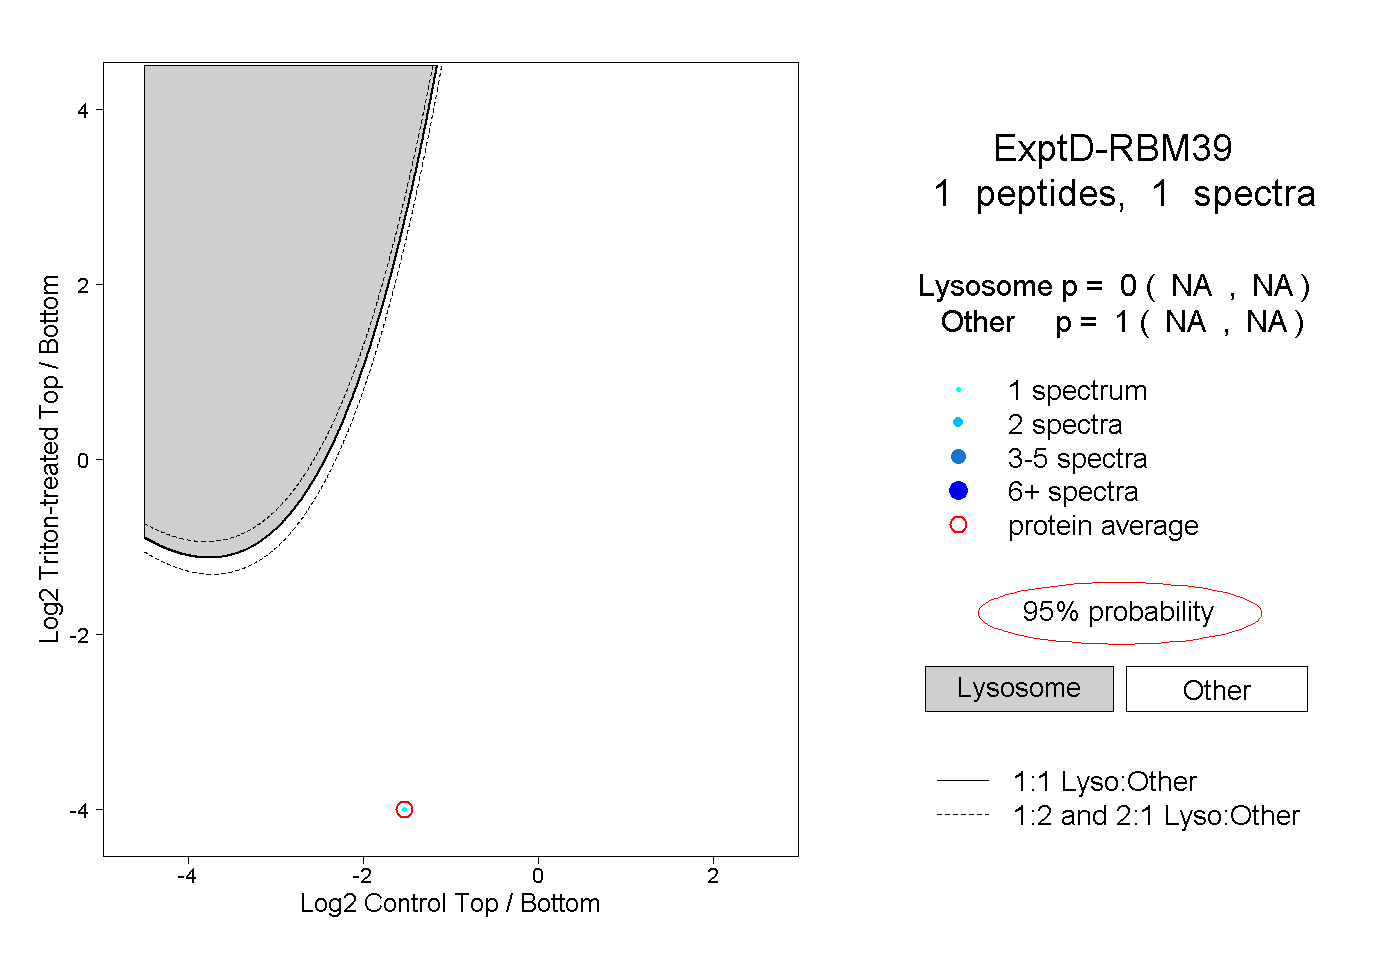 |
0.000 NA | NA |
1.000 NA | NA |