 8
8peptides
spectra
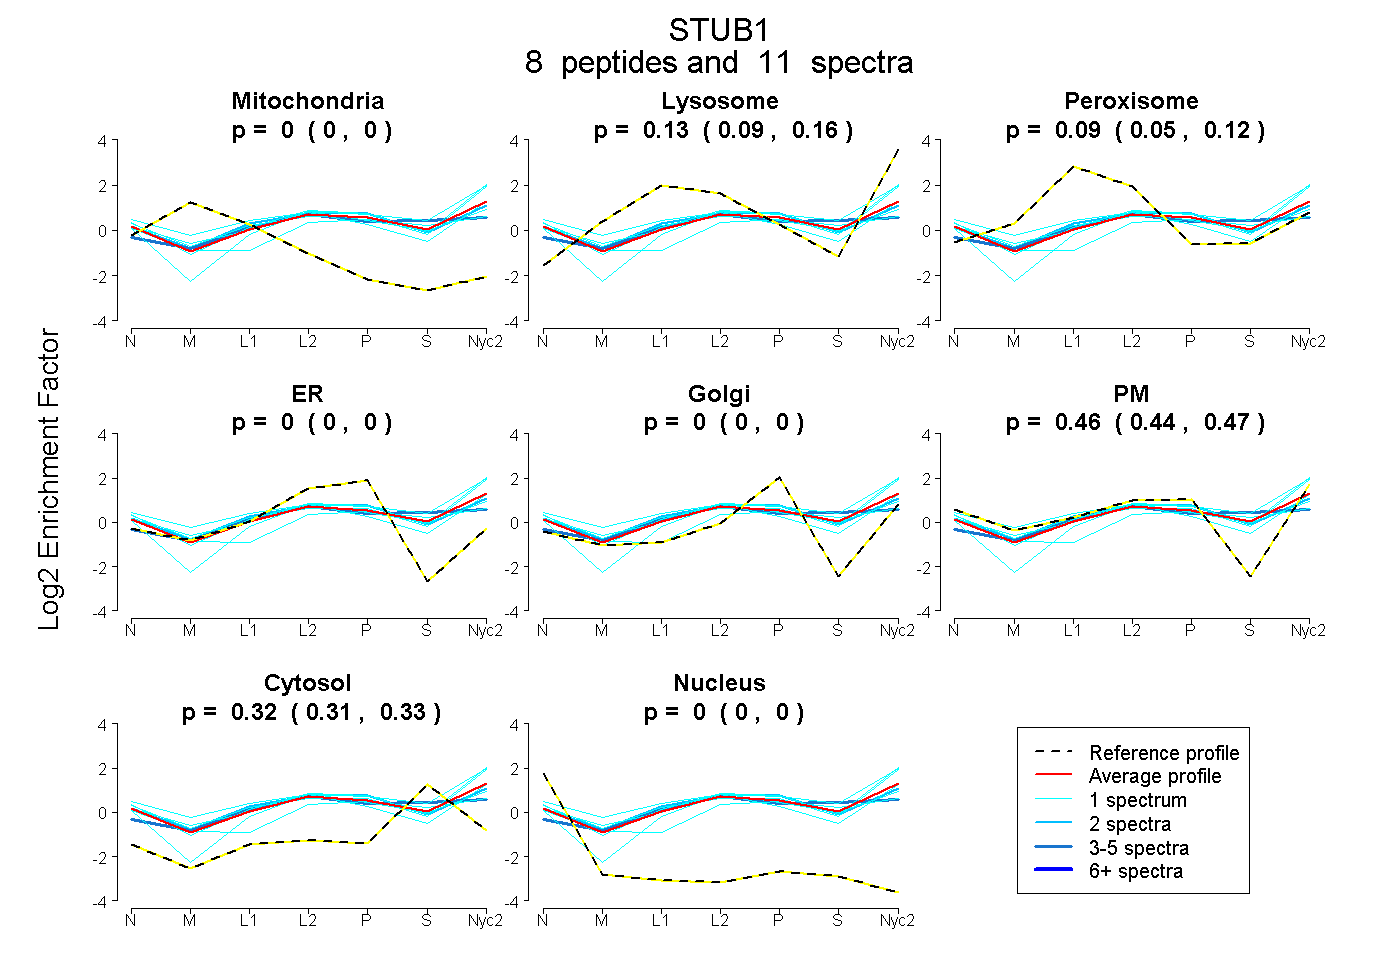
0.000 | 0.000
0.093 | 0.163
0.053 | 0.118
0.000 | 0.000
0.000 | 0.000
0.438 | 0.473
0.309 | 0.332
0.000 | 0.000
1peptide
spectra
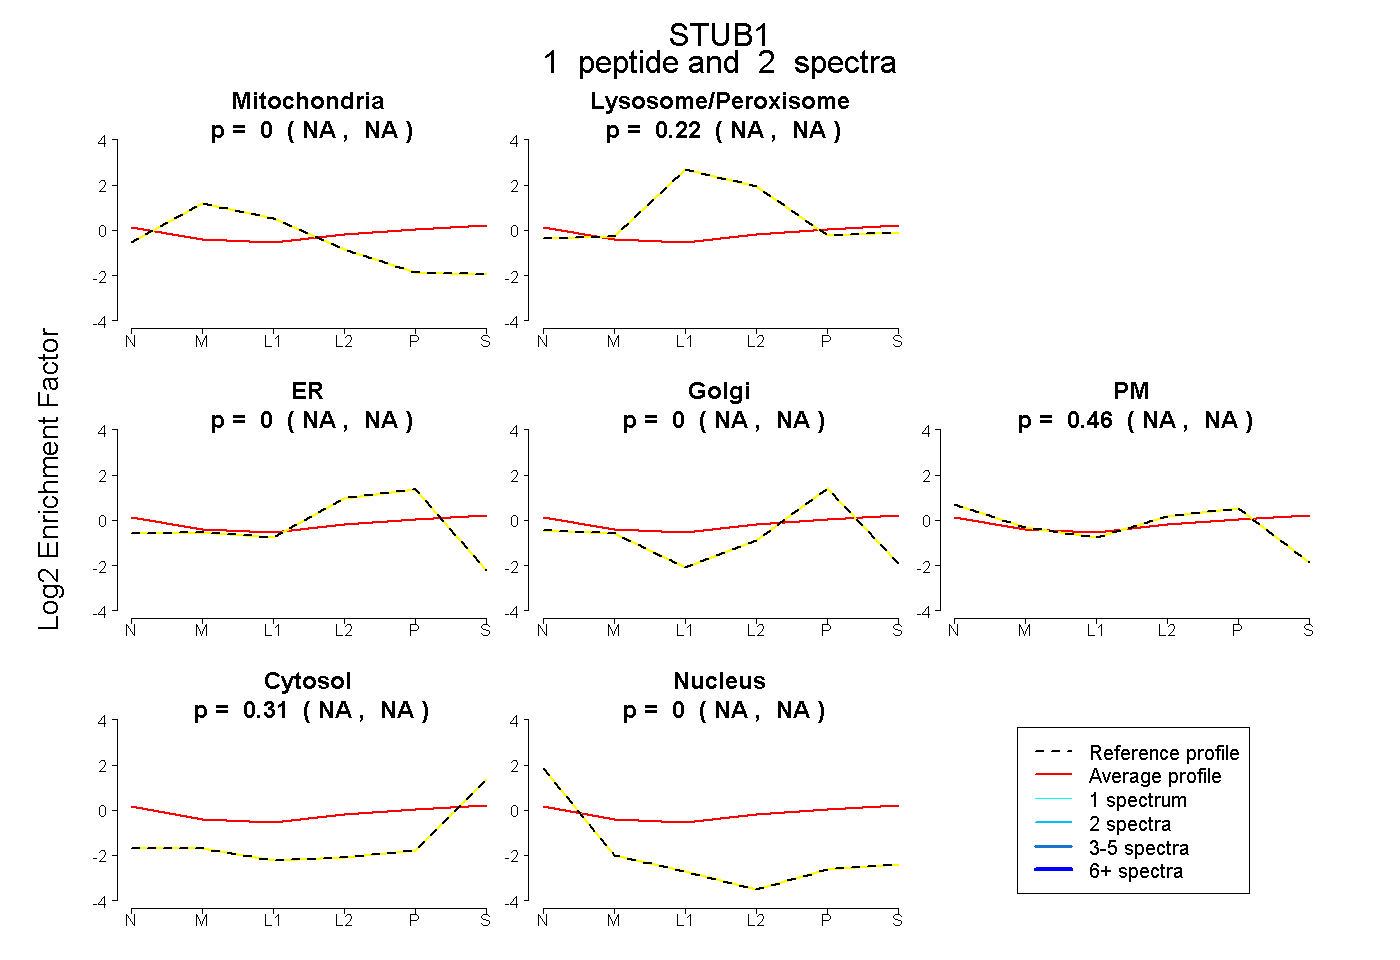
NA | NA
NA | NA
NA | NA
NA | NA
NA | NA
NA | NA
NA | NA
10peptides
spectra
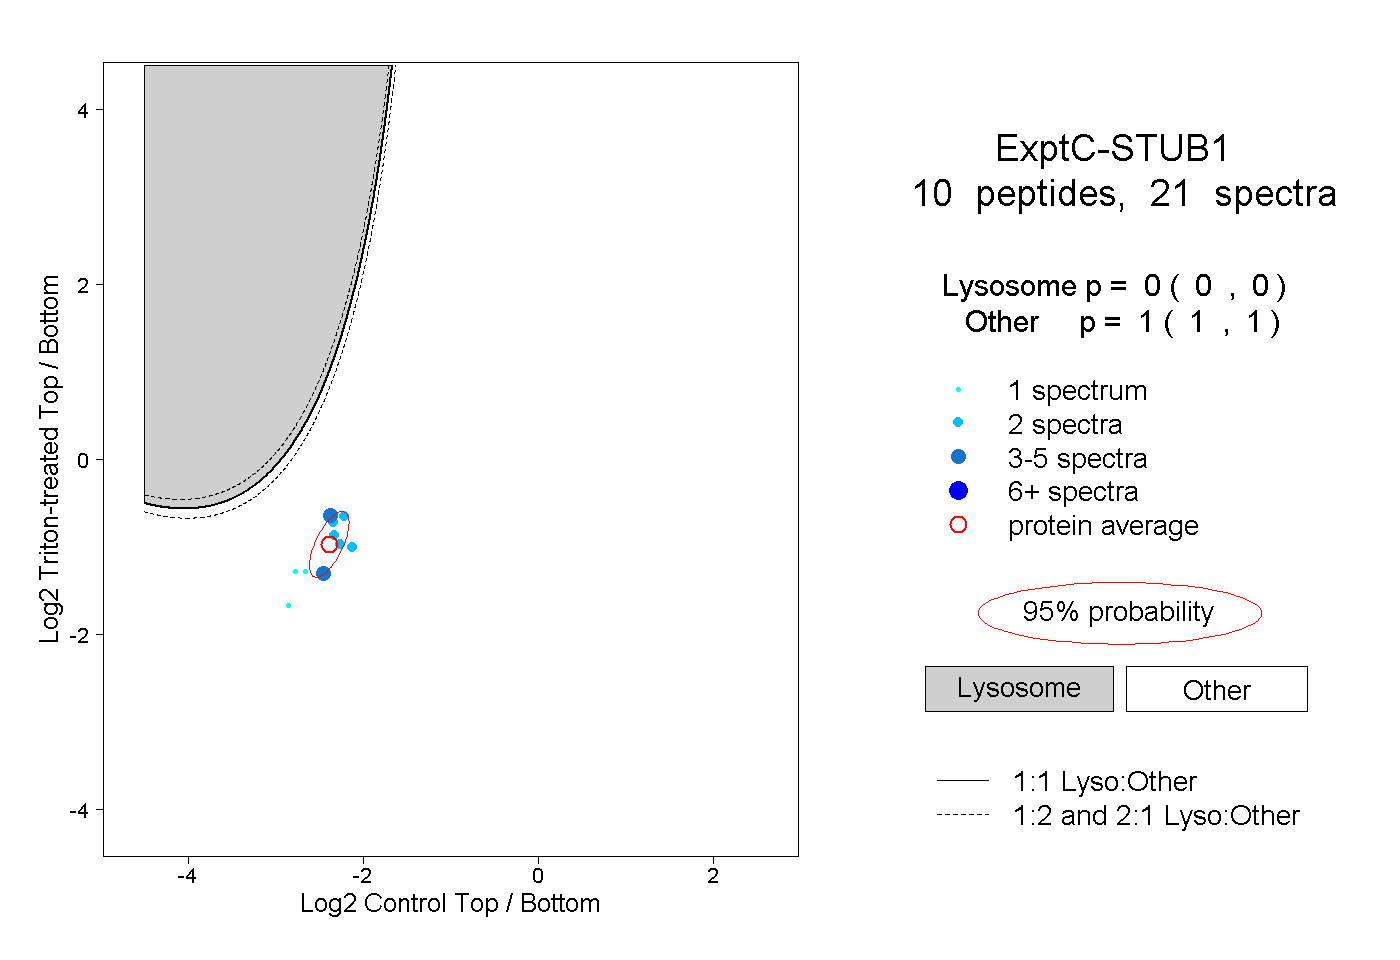
0.000 | 0.000
1.000 | 1.000
1peptide
spectrum
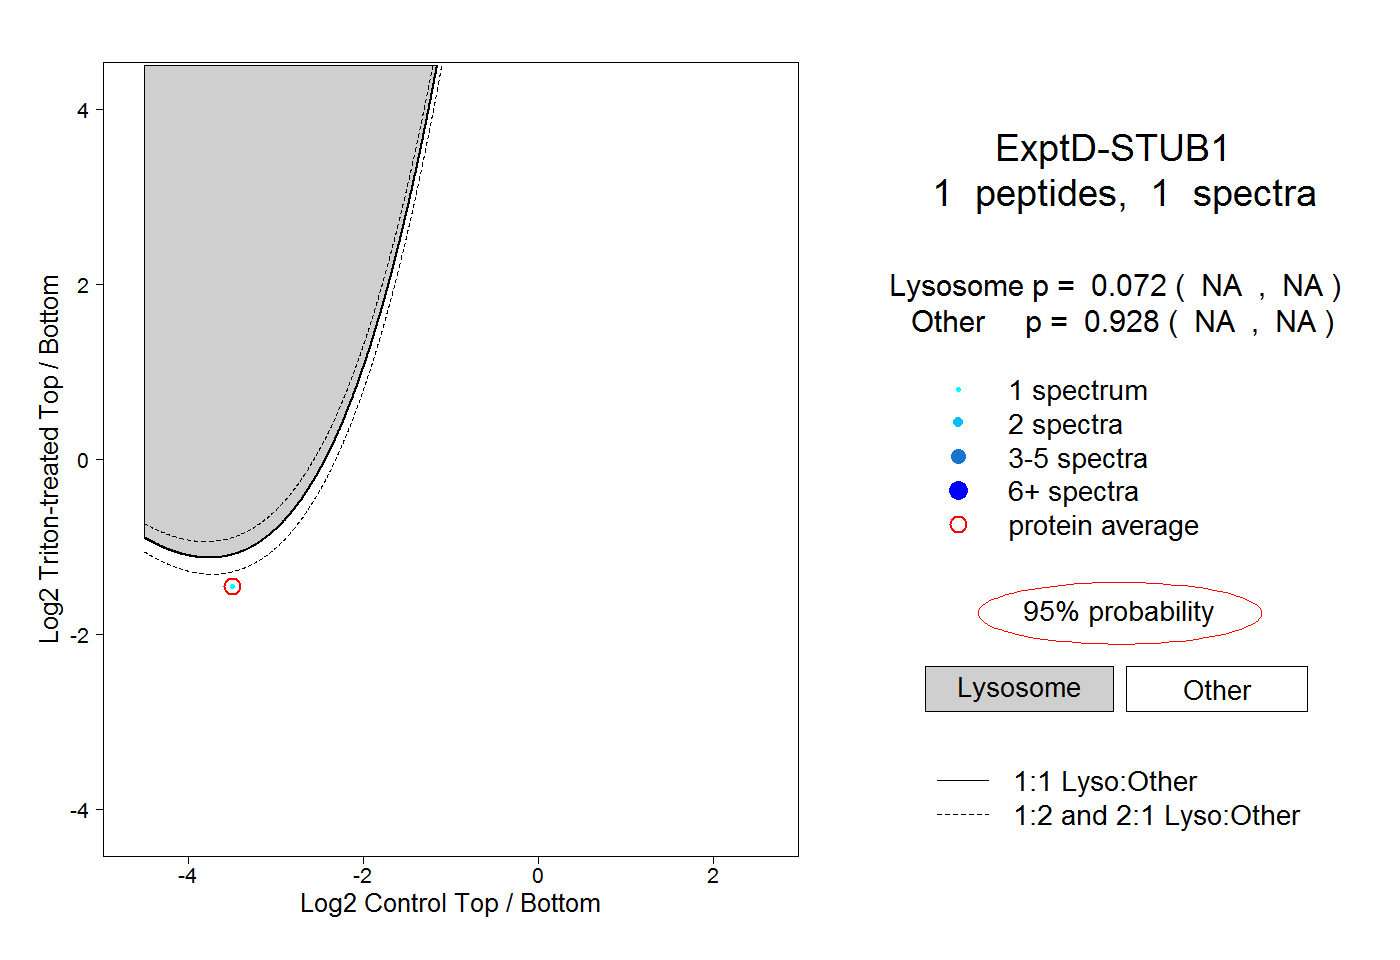
NA | NA
NA | NA