STUB1
[ENSRNOP00000026921]
Main page
| | | Plot |
Mito |
Lyso |
|
Perox |
ER |
Golgi |
PM |
Cytosol |
Nucleus |
|
| Expt A |
 8
8
peptides |
11
spectra |
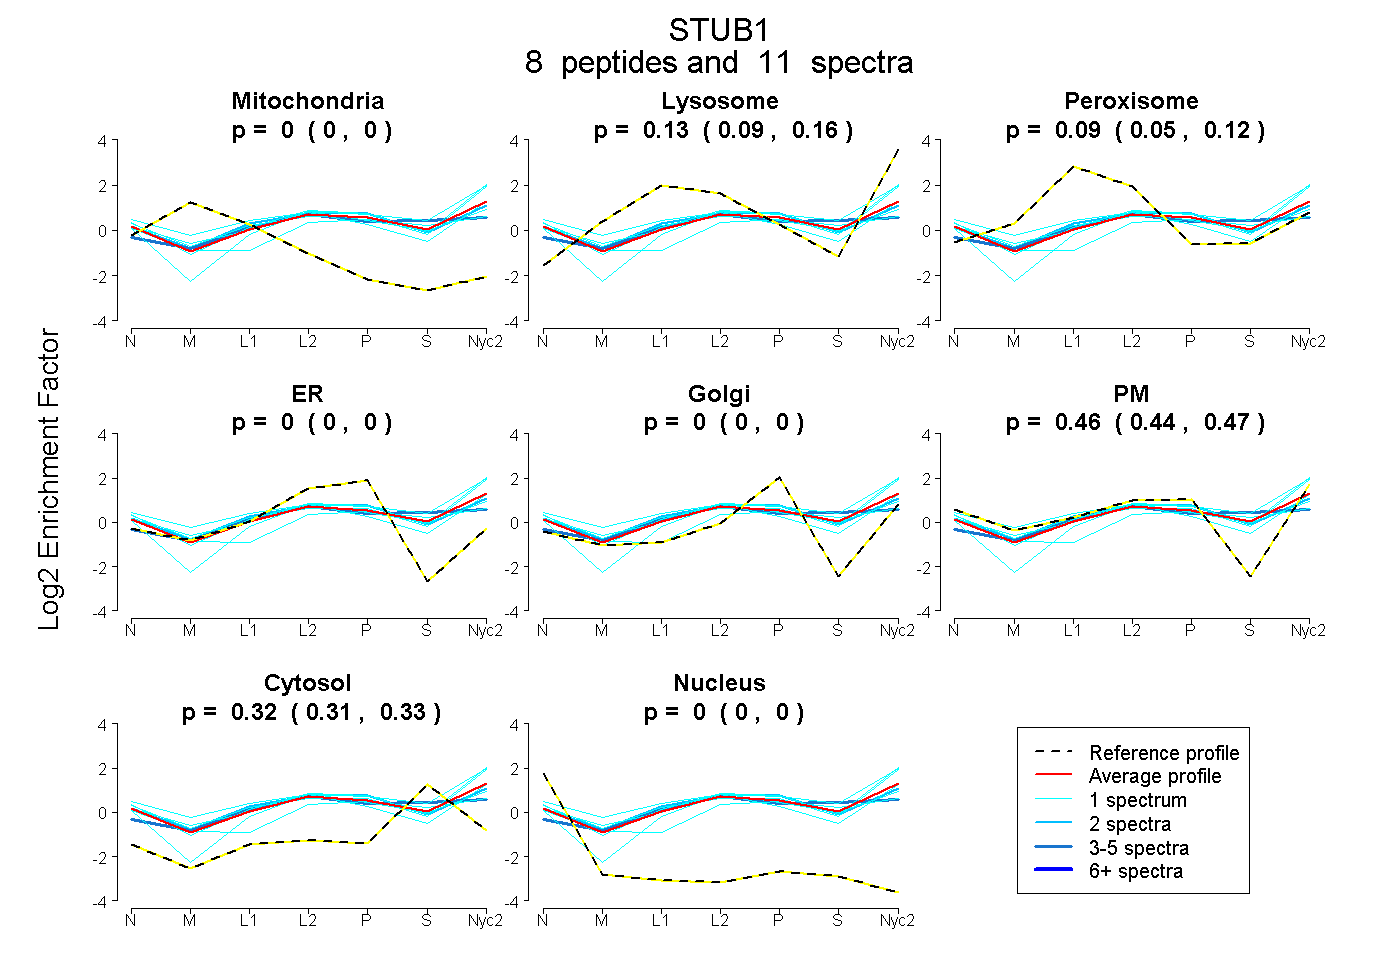 |
0.000
0.000 | 0.000 |
0.133
0.093 | 0.163 |
|
0.088
0.053 | 0.118 |
0.000
0.000 | 0.000 |
0.000
0.000 | 0.000 |
0.458
0.438 | 0.473 |
0.322
0.309 | 0.332 |
0.000
0.000 | 0.000 |
|
| | | Plot |
Mito |
|
Lyso or Perox |
|
ER |
Golgi |
PM |
Cytosol |
Nucleus |
|
| Expt B |
1
peptide |
2
spectra |
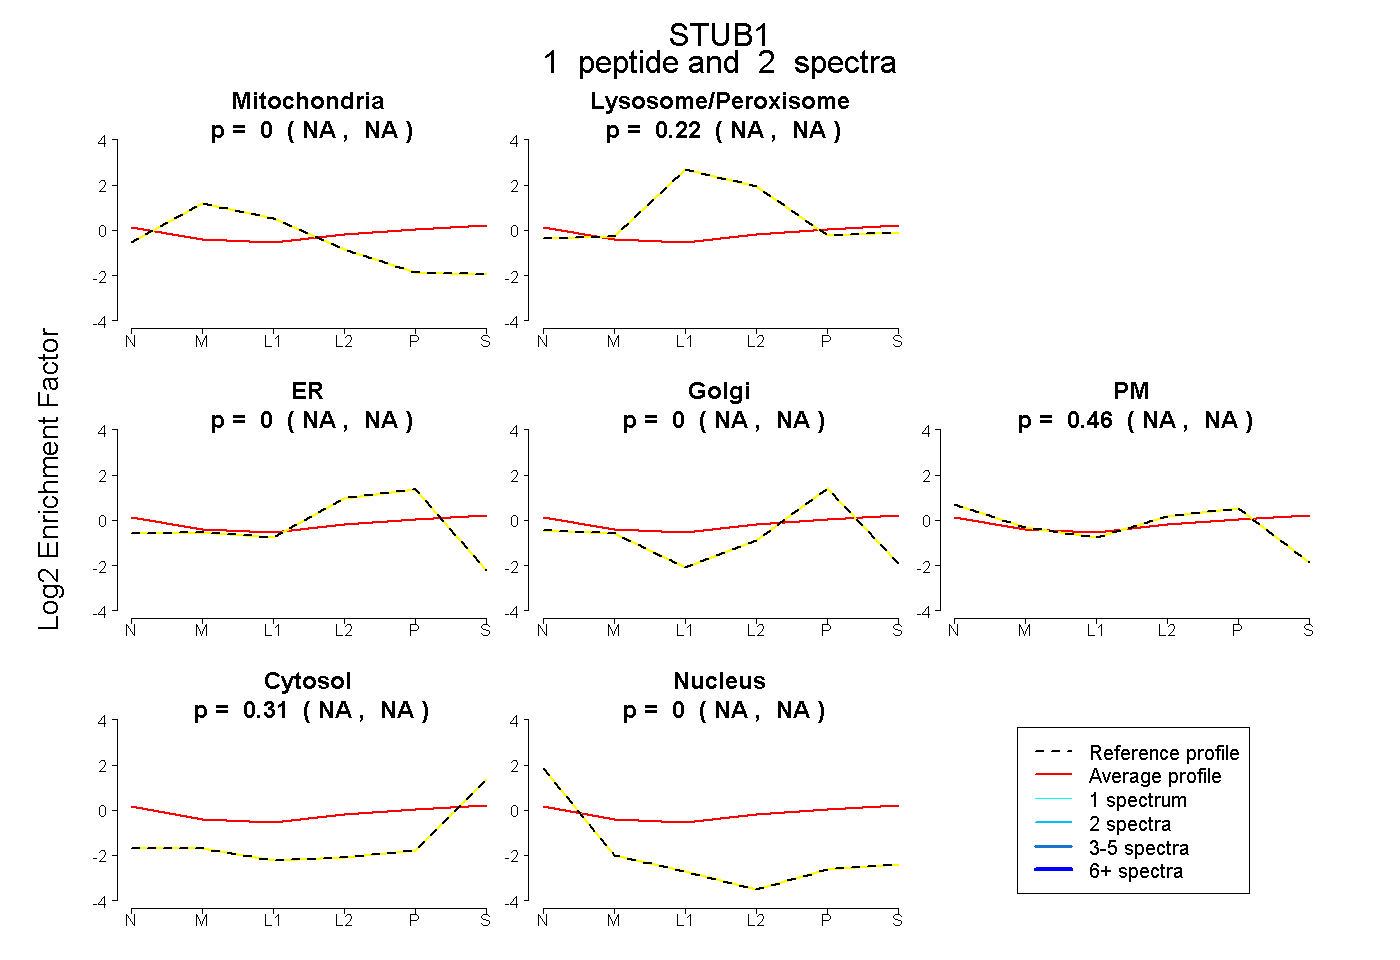 |
0.000
NA | NA |
|
0.224
NA | NA |
|
0.000
NA | NA |
0.000
NA | NA |
0.464
NA | NA |
0.312
NA | NA |
0.000
NA | NA |
|
| | | Plot |
|
Lyso |
|
|
|
|
|
|
|
Other |
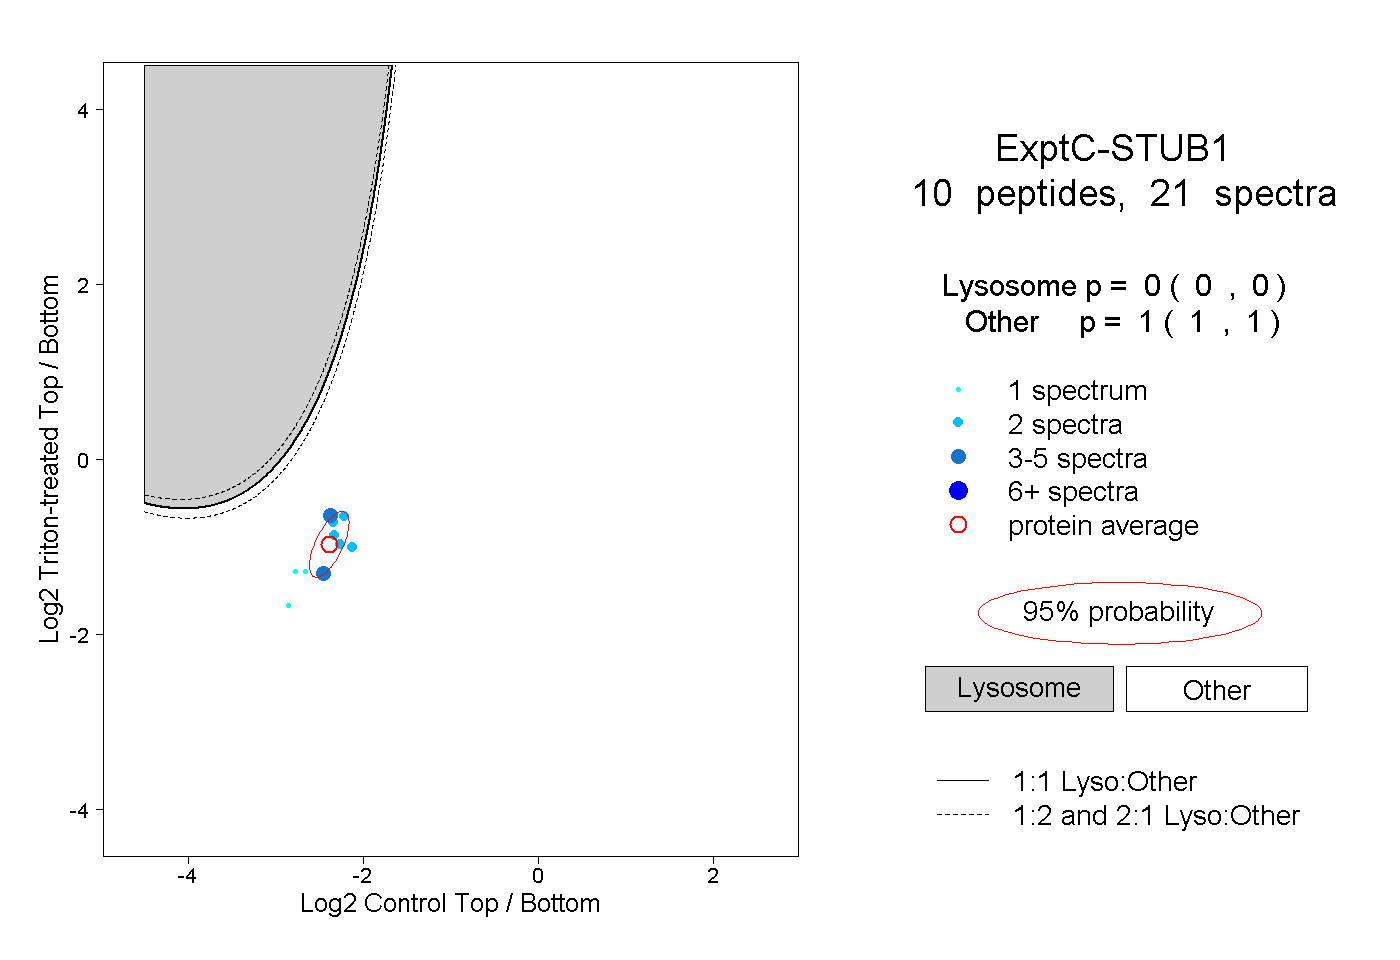
| Expt C |
10
peptides |
21
spectra |
 |
|
0.000
0.000 | 0.000 |
|
|
|
|
|
|
|
1.000
1.000 | 1.000 |
| 2 spectra, LLAAER |
|
0.000 |
|
|
|
|
|
|
|
1.000 |
| 1 spectrum, ALELDGQSVK |
|
0.000 |
|
|
|
|
|
|
|
1.000 |
| 4 spectra, LNFGDDIPSALR |
|
0.000 |
|
|
|
|
|
|
|
1.000 |
| 2 spectra, ALCYLK |
|
0.000 |
|
|
|
|
|
|
|
1.000 |
| 1 spectrum, VGHFDPVTR |
|
0.000 |
|
|
|
|
|
|
|
1.000 |
| 2 spectra, AQQACIEAK |
|
0.000 |
|
|
|
|
|
|
|
1.000 |
| 1 spectrum, LFVGR |
|
0.000 |
|
|
|
|
|
|
|
1.000 |
| 2 spectra, DIEEHLQR |
|
0.000 |
|
|
|
|
|
|
|
1.000 |
| 4 spectra, AYSLAK |
|
0.000 |
|
|
|
|
|
|
|
1.000 |
| 2 spectra, EPCITPSGITYDR |
|
0.000 |
|
|
|
|
|
|
|
1.000 |
| | | Plot |
|
Lyso |
|
|
|
|
|
|
|
Other |
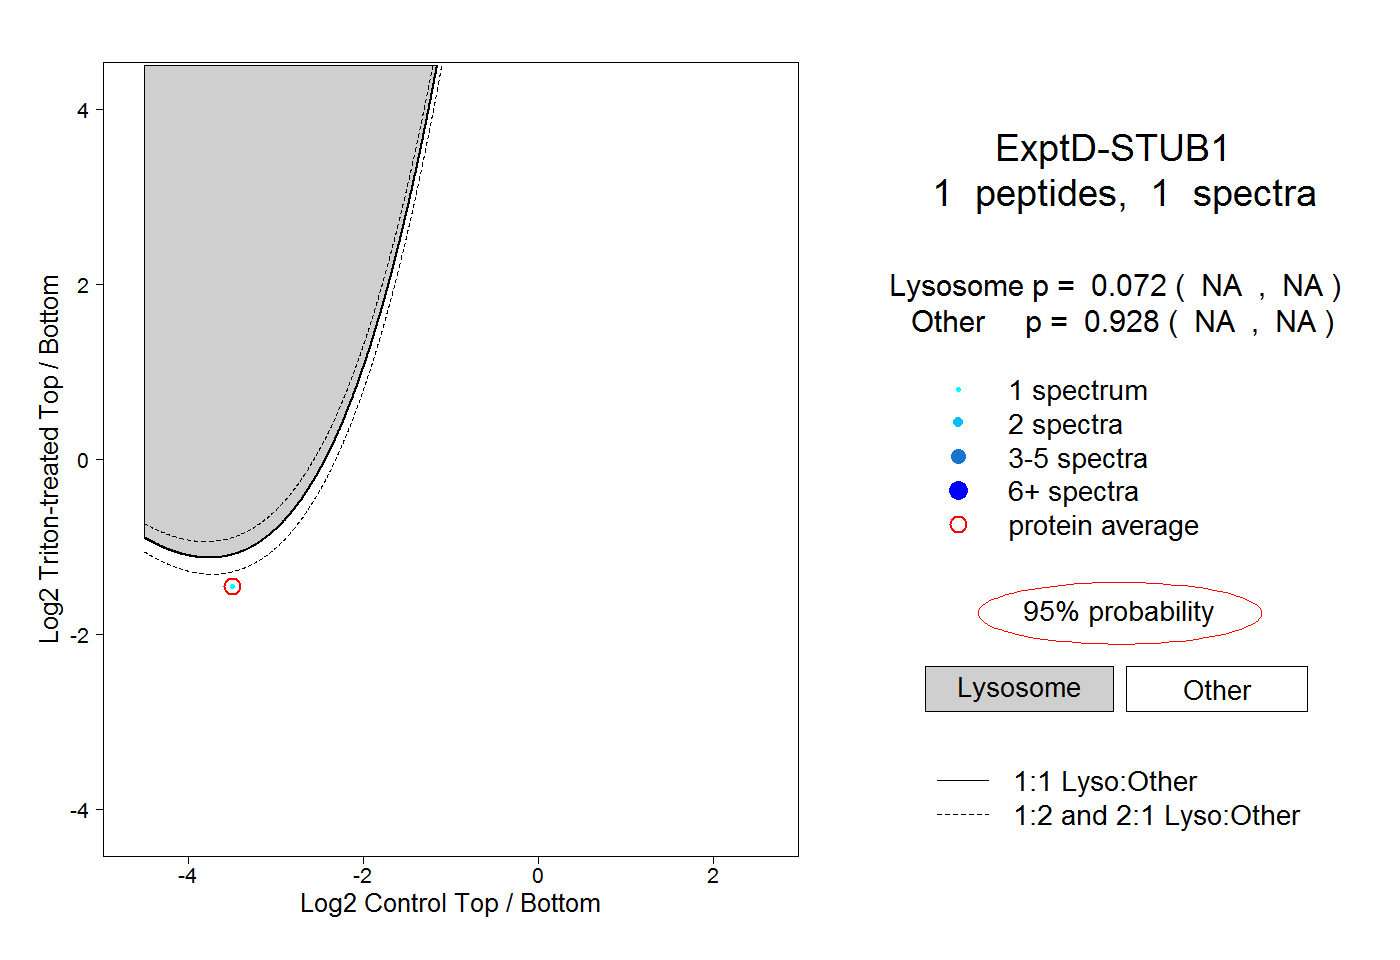
| Expt D |
1
peptide |
1
spectrum |
 |
|
0.072
NA | NA |
|
|
|
|
|
|
|
0.928
NA | NA |