 8
8peptides
spectra
0.000 | 0.000
0.093 | 0.163
0.053 | 0.118
0.000 | 0.000
0.000 | 0.000
0.438 | 0.473
0.309 | 0.332
0.000 | 0.000
| Plot | Mito | Lyso | Perox | ER | Golgi | PM | Cytosol | Nucleus | |||||
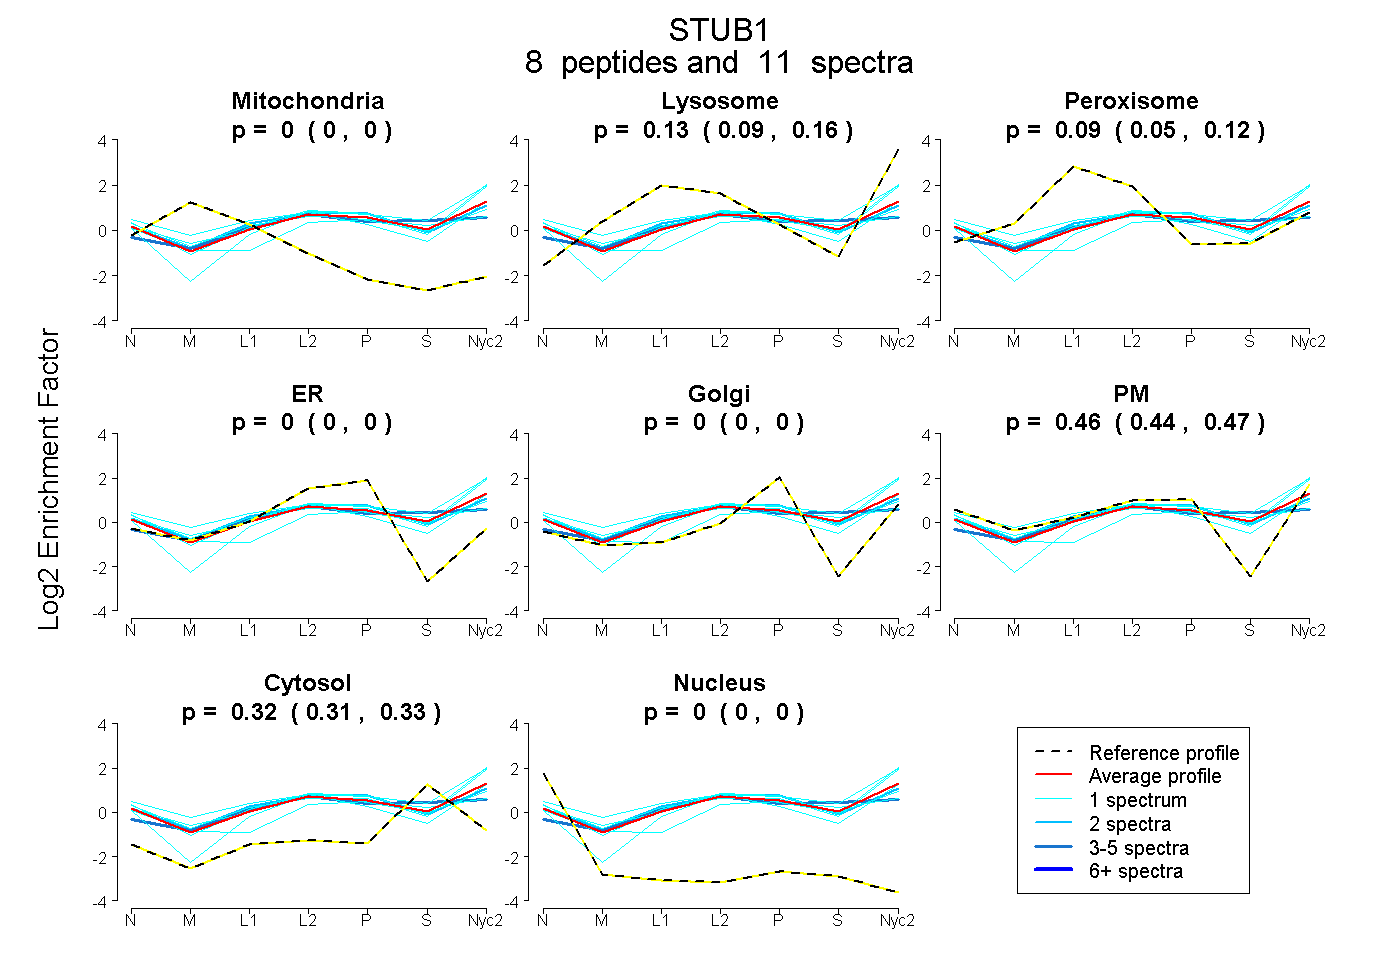
| Expt A |
8 peptides |
11 spectra |
|
0.000 0.000 | 0.000 |
0.133 0.093 | 0.163 |
0.088 0.053 | 0.118 |
0.000 0.000 | 0.000 |
0.000 0.000 | 0.000 |
0.458 0.438 | 0.473 |
0.322 0.309 | 0.332 |
0.000 0.000 | 0.000 |
| 1 spectrum, NPLVAVYYTNR | 0.000 | 0.263 | 0.000 | 0.000 | 0.000 | 0.481 | 0.255 | 0.000 | ||
| 1 spectrum, LNFGDDIPSALR | 0.000 | 0.225 | 0.000 | 0.000 | 0.000 | 0.379 | 0.395 | 0.000 | ||
| 2 spectra, ALCYLK | 0.000 | 0.058 | 0.181 | 0.000 | 0.000 | 0.484 | 0.276 | 0.000 | ||
| 1 spectrum, VGHFDPVTR | 0.000 | 0.017 | 0.262 | 0.000 | 0.000 | 0.525 | 0.196 | 0.000 | ||
| 1 spectrum, ELEECQR | 0.000 | 0.026 | 0.207 | 0.000 | 0.000 | 0.465 | 0.302 | 0.000 | ||
| 3 spectra, AQQACIEAK | 0.000 | 0.075 | 0.250 | 0.062 | 0.031 | 0.199 | 0.383 | 0.000 | ||
| 1 spectrum, LFVGR | 0.000 | 0.249 | 0.000 | 0.000 | 0.000 | 0.495 | 0.256 | 0.000 | ||
| 1 spectrum, DIEEHLQR | 0.000 | 0.002 | 0.015 | 0.000 | 0.000 | 0.531 | 0.452 | 0.000 |
| Plot | Mito | Lyso or Perox | ER | Golgi | PM | Cytosol | Nucleus | ||||||
| Expt B |
1 peptide |
2 spectra |
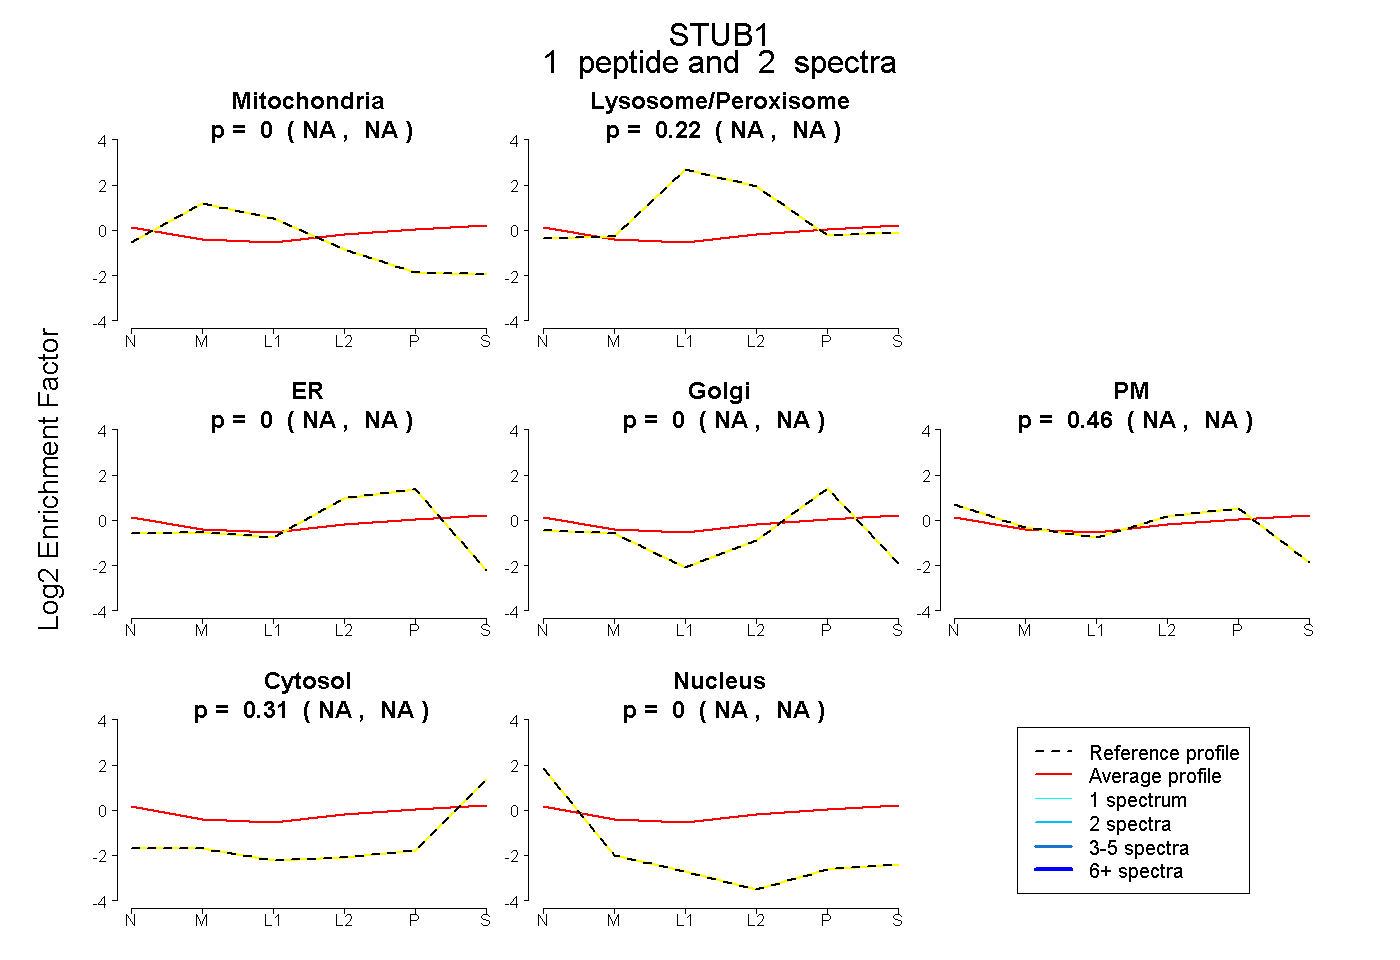 |
0.000 NA | NA |
0.224 NA | NA |
0.000 NA | NA |
0.000 NA | NA |
0.464 NA | NA |
0.312 NA | NA |
0.000 NA | NA |
|||
| Plot | Lyso | Other | |||||||||||
| Expt C |
10 peptides |
21 spectra |
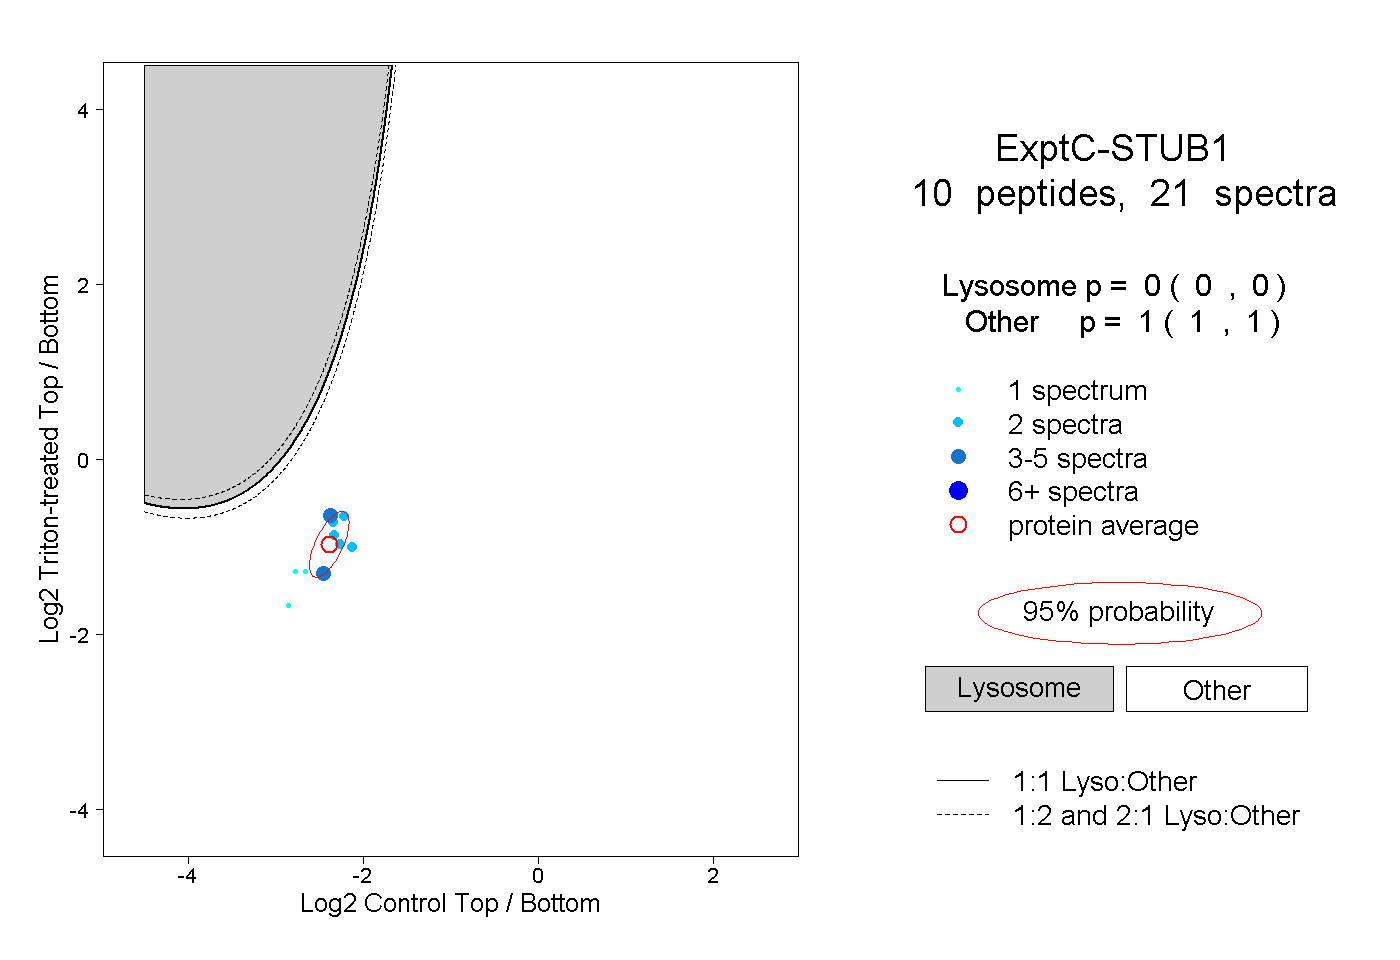 |
0.000 0.000 | 0.000 |
1.000 1.000 | 1.000 |
||||||||
| Plot | Lyso | Other | |||||||||||
| Expt D |
1 peptide |
1 spectrum |
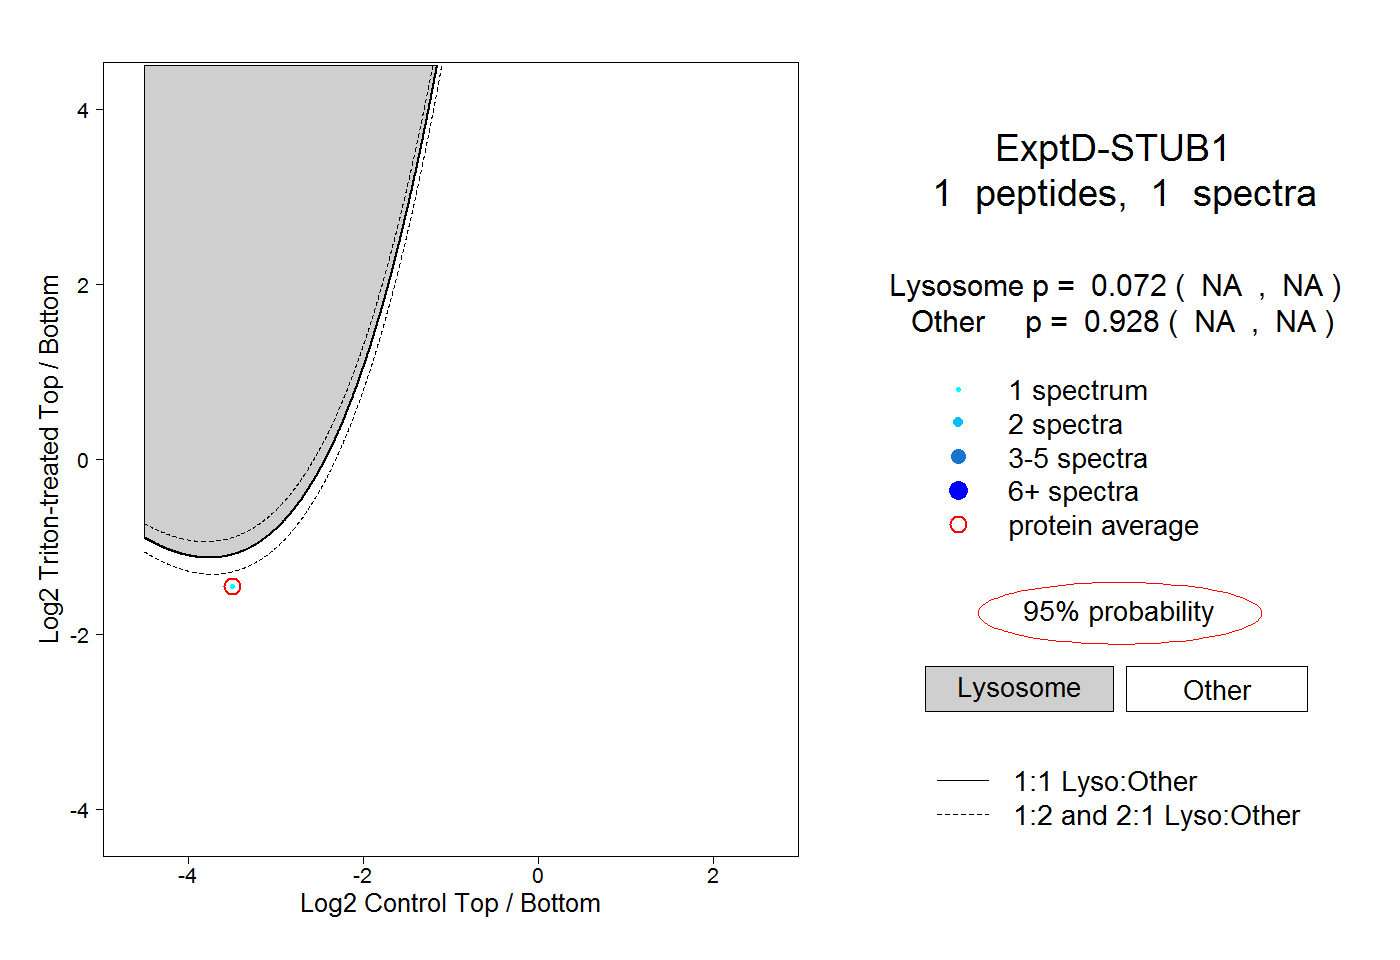 |
0.072 NA | NA |
0.928 NA | NA |