 9
9peptides
spectra
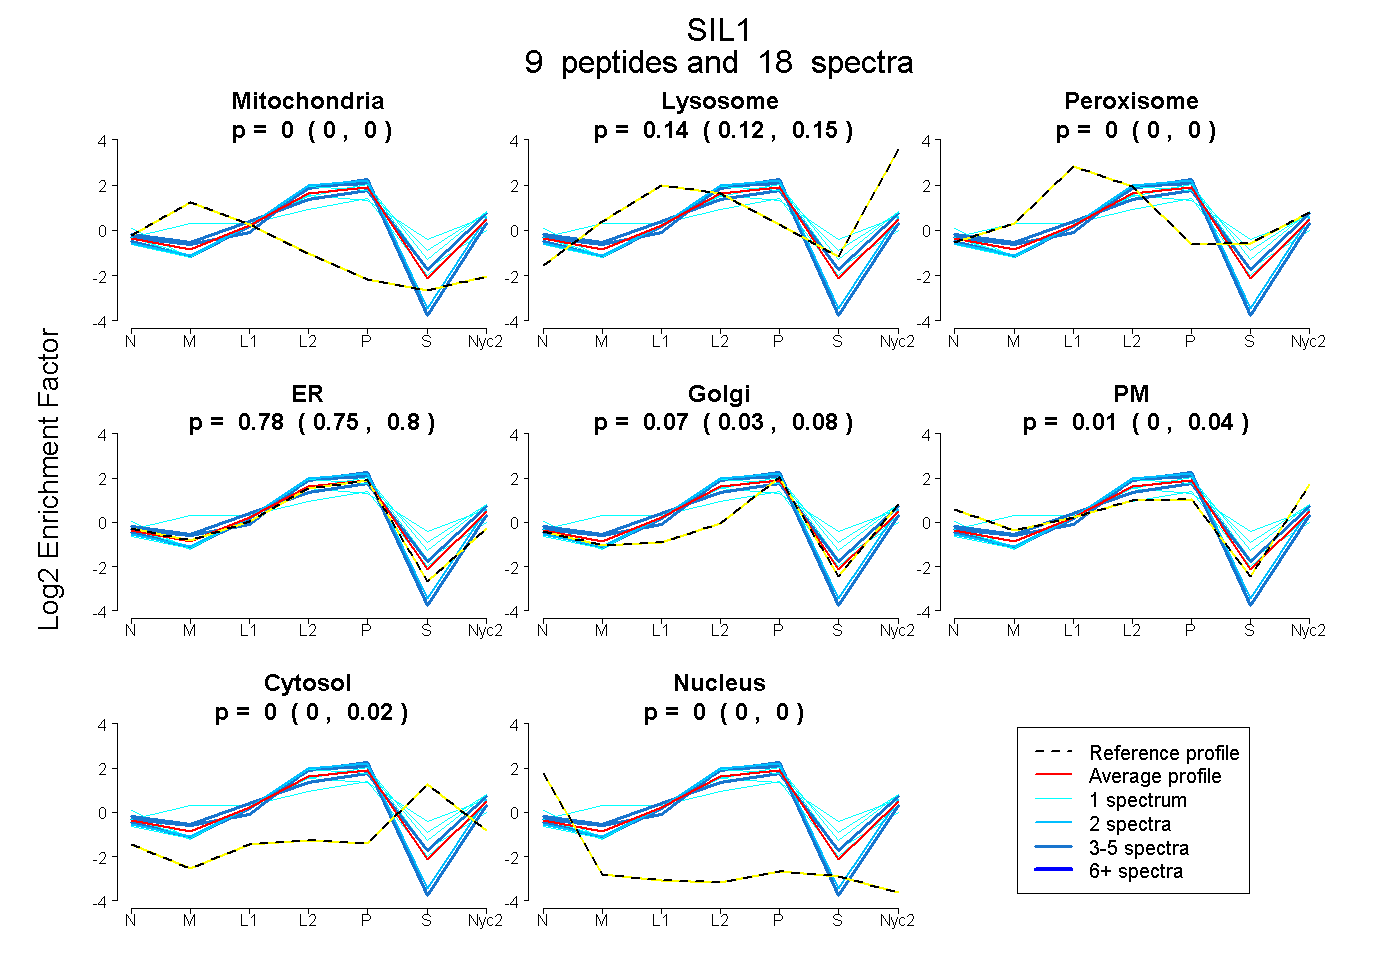
0.000 | 0.000
0.120 | 0.154
0.000 | 0.000
0.753 | 0.796
0.031 | 0.084
0.000 | 0.041
0.000 | 0.022
0.000 | 0.000
5peptides
spectra
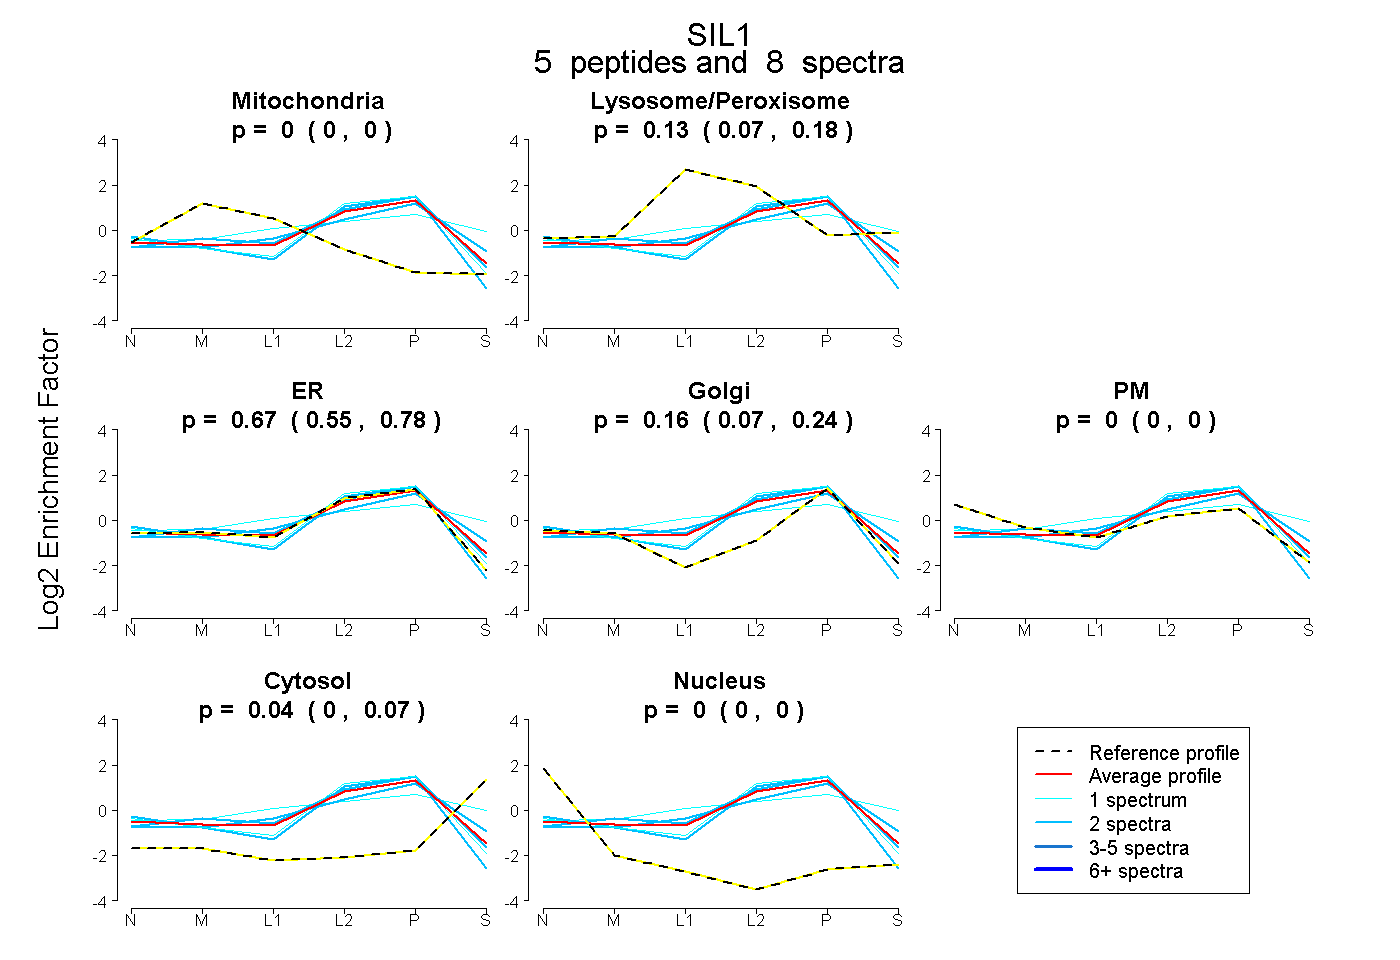
0.000 | 0.000
0.073 | 0.181
0.550 | 0.778
0.065 | 0.235
0.000 | 0.000
0.000 | 0.068
0.000 | 0.000
6peptides
spectra
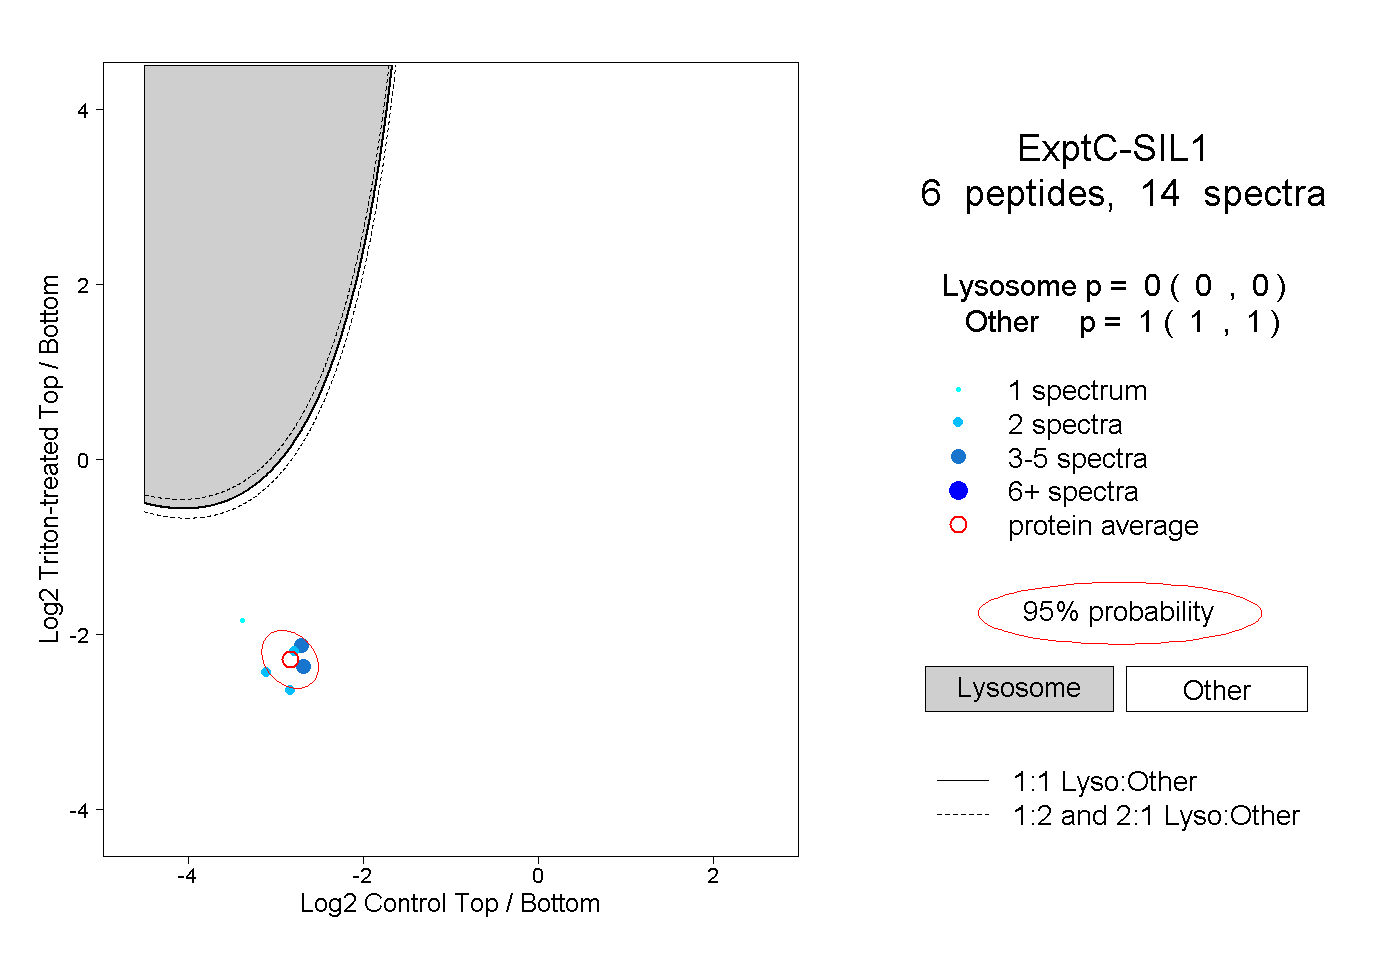
0.000 | 0.000
1.000 | 1.000