 9
9peptides
spectra
0.000 | 0.000
0.120 | 0.154
0.000 | 0.000
0.753 | 0.796
0.031 | 0.084
0.000 | 0.041
0.000 | 0.022
0.000 | 0.000
| Plot | Mito | Lyso | Perox | ER | Golgi | PM | Cytosol | Nucleus | |||||
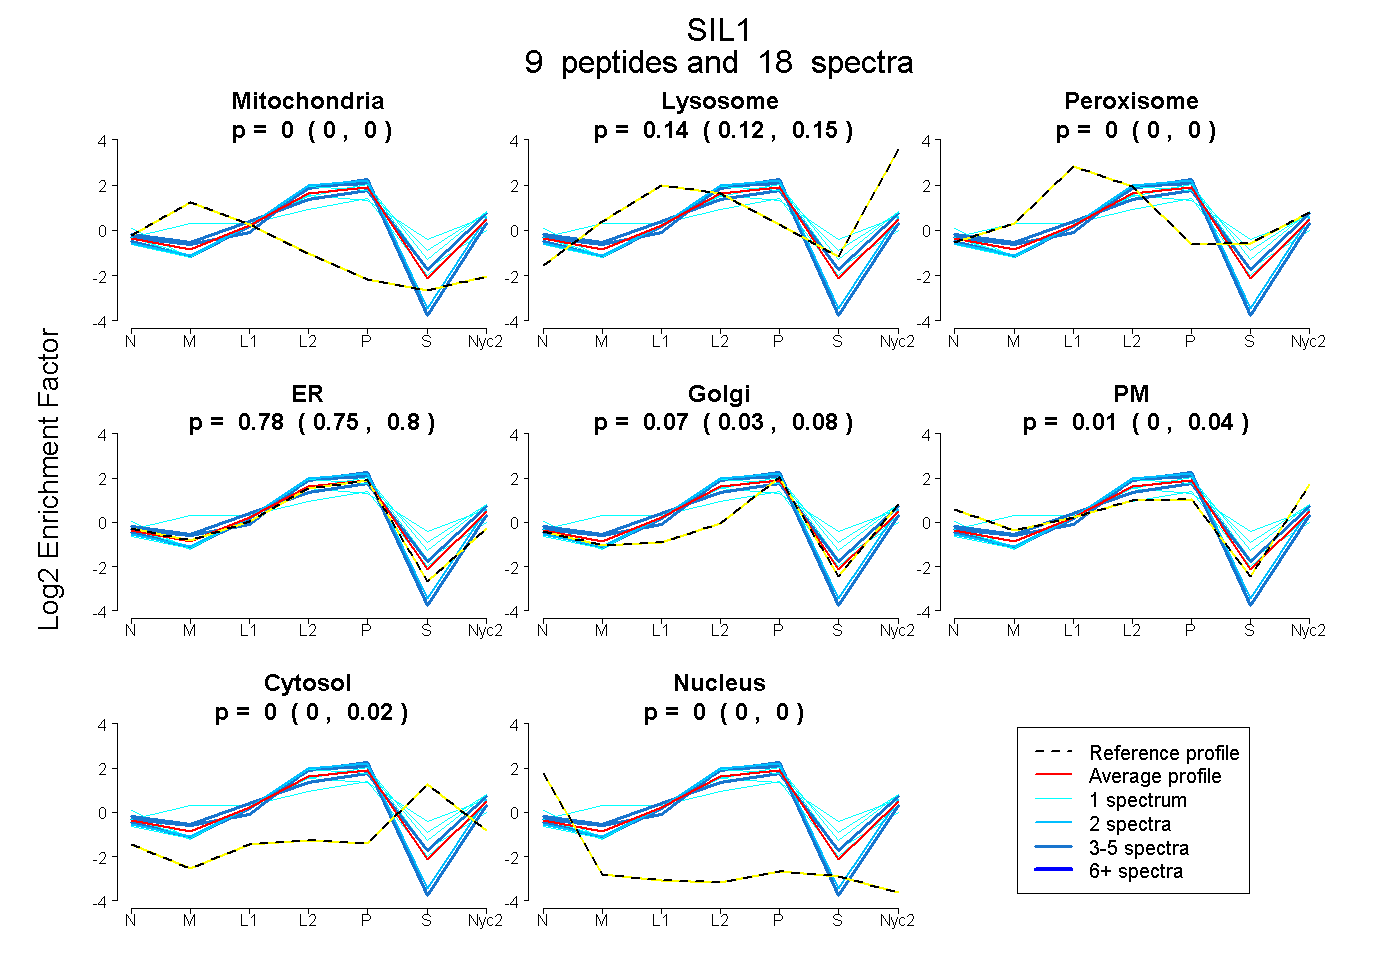
| Expt A |
9 peptides |
18 spectra |
|
0.000 0.000 | 0.000 |
0.142 0.120 | 0.154 |
0.000 0.000 | 0.000 |
0.776 0.753 | 0.796 |
0.068 0.031 | 0.084 |
0.010 0.000 | 0.041 |
0.004 0.000 | 0.022 |
0.000 0.000 | 0.000 |
| 1 spectrum, EYAAFVLGAAFSSNPK | 0.000 | 0.062 | 0.159 | 0.403 | 0.000 | 0.176 | 0.200 | 0.000 | ||
| 4 spectra, LGGLQVLR | 0.000 | 0.000 | 0.000 | 0.902 | 0.000 | 0.098 | 0.000 | 0.000 | ||
| 1 spectrum, EQGWCEITAQLLALPEHDAR | 0.115 | 0.127 | 0.079 | 0.462 | 0.180 | 0.036 | 0.000 | 0.000 | ||
| 1 spectrum, STHEDSDTK | 0.000 | 0.242 | 0.000 | 0.642 | 0.000 | 0.000 | 0.116 | 0.000 | ||
| 3 spectra, HFPYAQQQFLK | 0.000 | 0.114 | 0.114 | 0.490 | 0.199 | 0.084 | 0.000 | 0.000 | ||
| 1 spectrum, ELLASIDSLVK | 0.000 | 0.053 | 0.013 | 0.850 | 0.000 | 0.000 | 0.085 | 0.000 | ||
| 1 spectrum, VQVEAIEGGALQK | 0.000 | 0.218 | 0.000 | 0.607 | 0.094 | 0.000 | 0.080 | 0.000 | ||
| 2 spectra, VVTLLYDLVTEK | 0.000 | 0.068 | 0.000 | 0.924 | 0.000 | 0.007 | 0.000 | 0.000 | ||
| 4 spectra, QVQLLPGLR | 0.000 | 0.000 | 0.000 | 0.973 | 0.000 | 0.027 | 0.000 | 0.000 |
| Plot | Mito | Lyso or Perox | ER | Golgi | PM | Cytosol | Nucleus | ||||||
| Expt B |
5 peptides |
8 spectra |
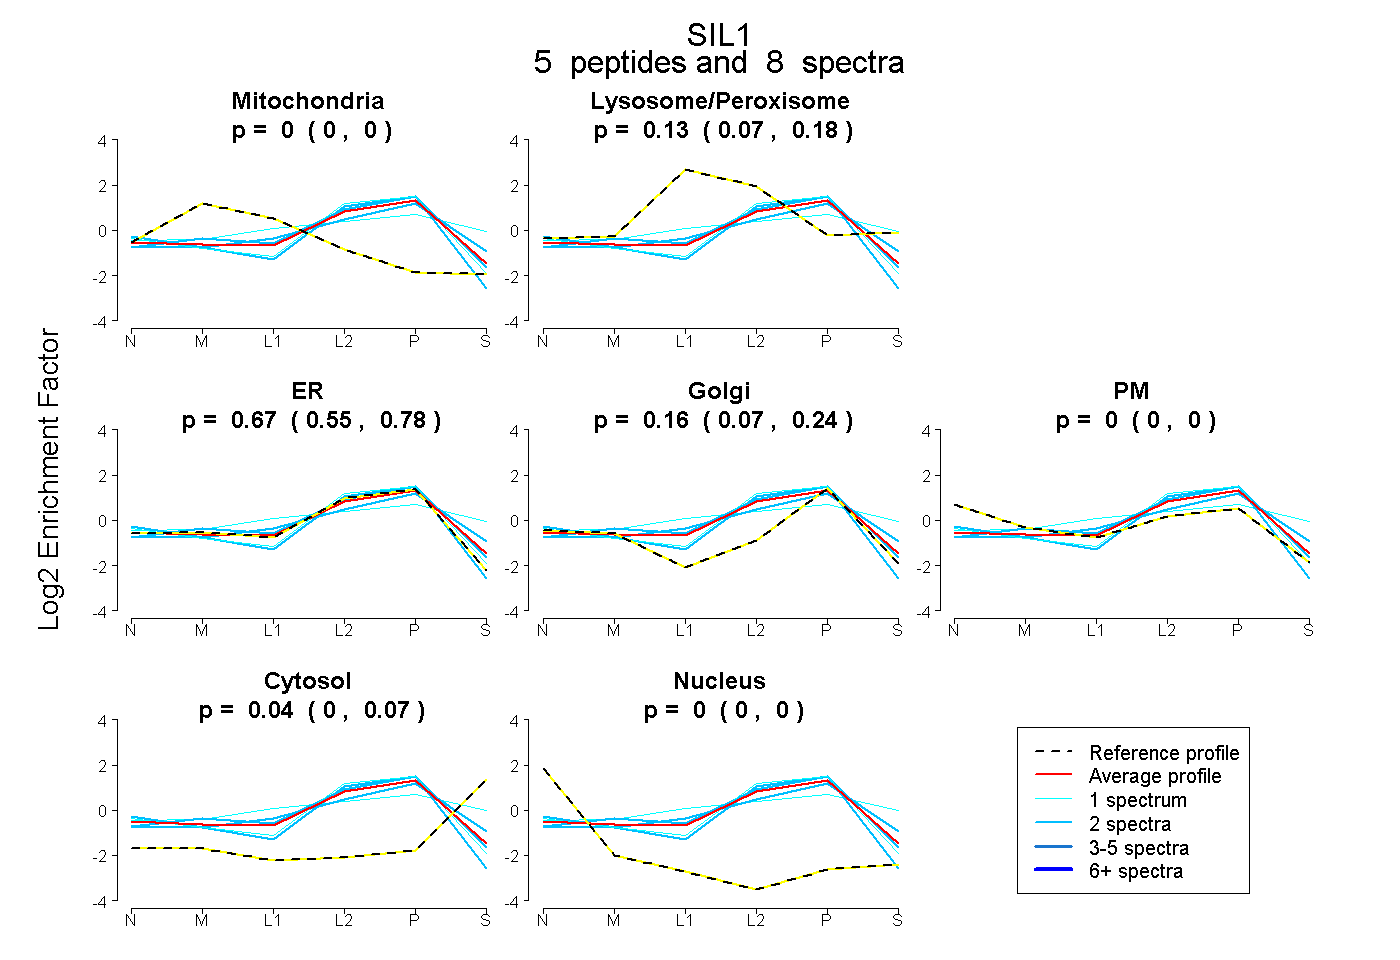 |
0.000 0.000 | 0.000 |
0.132 0.073 | 0.181 |
0.673 0.550 | 0.778 |
0.159 0.065 | 0.235 |
0.000 0.000 | 0.000 |
0.035 0.000 | 0.068 |
0.000 0.000 | 0.000 |
|||
| Plot | Lyso | Other | |||||||||||
| Expt C |
6 peptides |
14 spectra |
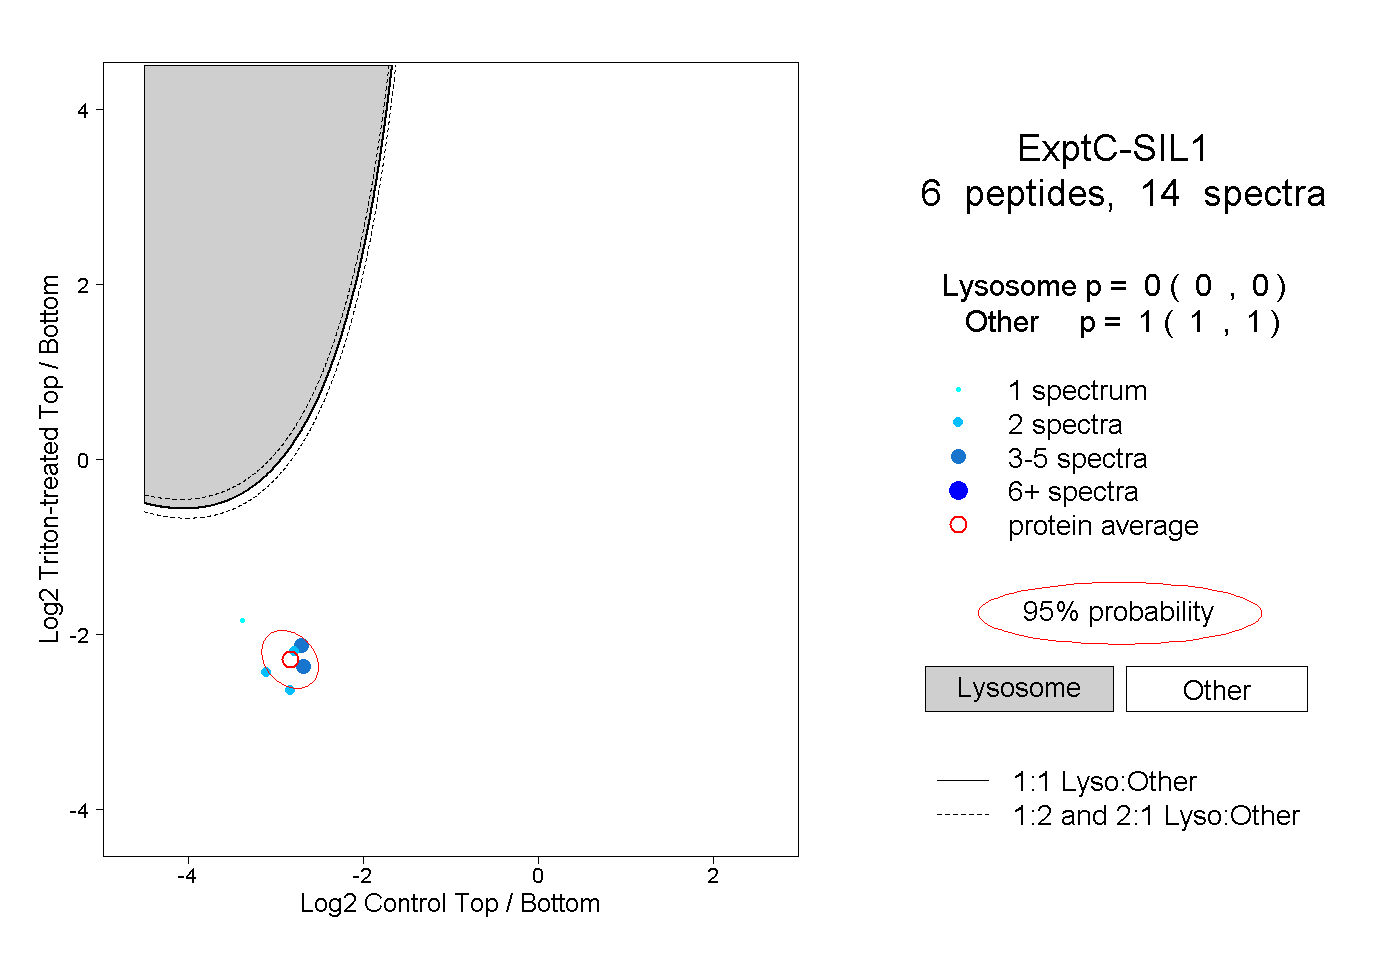 |
0.000 0.000 | 0.000 |
1.000 1.000 | 1.000 |