SIL1
[ENSRNOP00000026895]
Main page
| | | Plot |
Mito |
Lyso |
|
Perox |
ER |
Golgi |
PM |
Cytosol |
Nucleus |
|
| Expt A |
 9
9
peptides |
18
spectra |
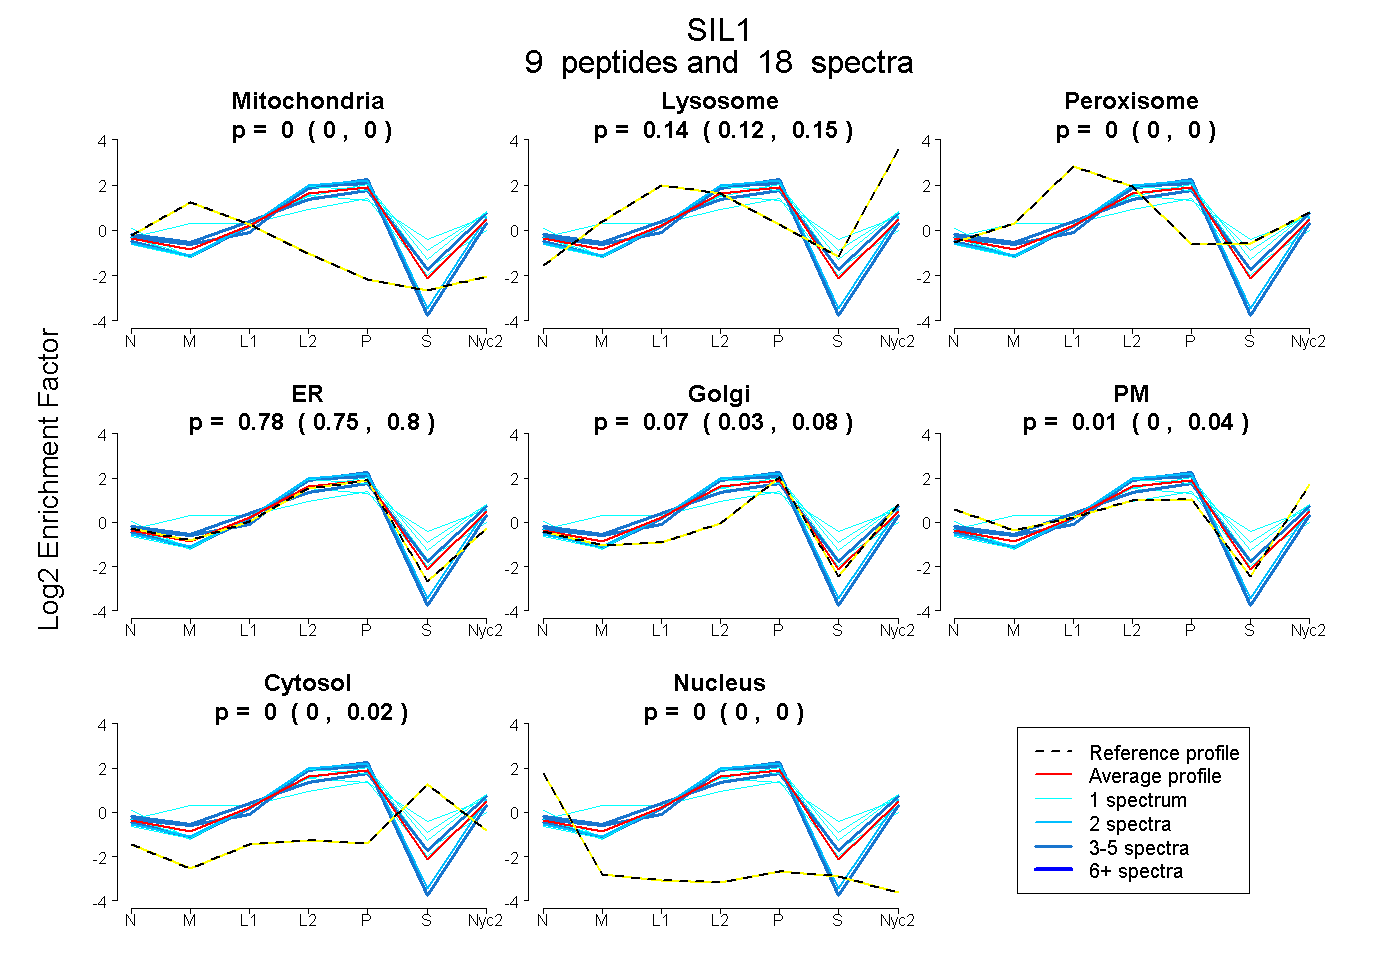 |
0.000
0.000 | 0.000 |
0.142
0.120 | 0.154 |
|
0.000
0.000 | 0.000 |
0.776
0.753 | 0.796 |
0.068
0.031 | 0.084 |
0.010
0.000 | 0.041 |
0.004
0.000 | 0.022 |
0.000
0.000 | 0.000 |
|
| | | Plot |
Mito |
|
Lyso or Perox |
|
ER |
Golgi |
PM |
Cytosol |
Nucleus |
|
| Expt B |
5
peptides |
8
spectra |
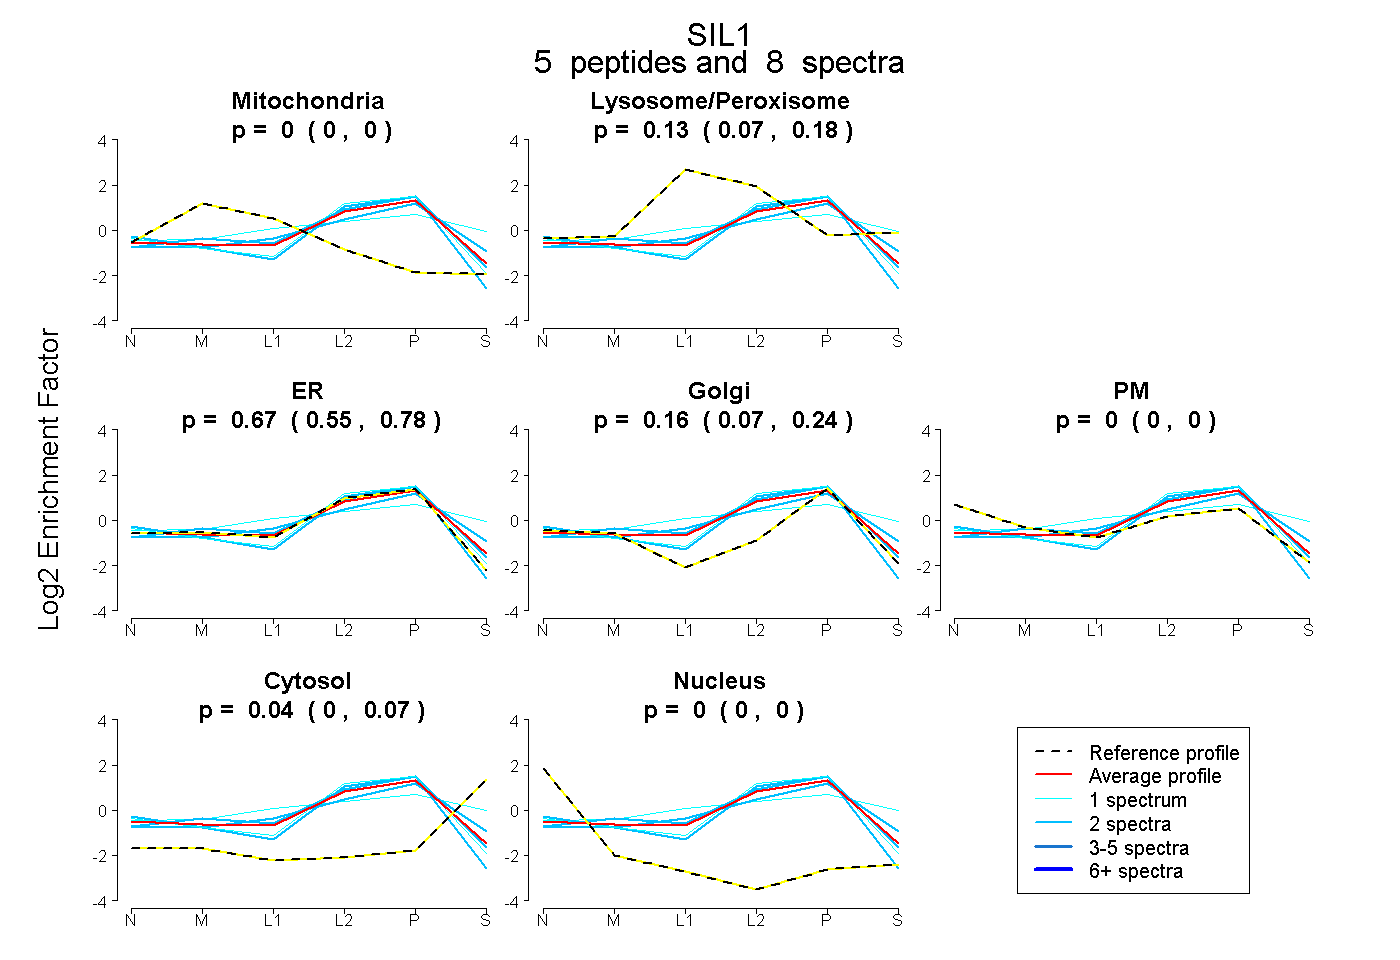 |
0.000
0.000 | 0.000 |
|
0.132
0.073 | 0.181 |
|
0.673
0.550 | 0.778 |
0.159
0.065 | 0.235 |
0.000
0.000 | 0.000 |
0.035
0.000 | 0.068 |
0.000
0.000 | 0.000 |
|
| 1 spectrum, HFPYAQQQFLK |
0.000 |
|
0.483 |
|
0.000 |
0.389 |
0.000 |
0.128 |
0.000 |
|
| 2 spectra, ELLASIDSLVK |
0.000 |
|
0.000 |
|
0.909 |
0.025 |
0.000 |
0.066 |
0.000 |
|
| 2 spectra, VQVEAIEGGALQK |
0.000 |
|
0.344 |
|
0.137 |
0.510 |
0.000 |
0.010 |
0.000 |
|
| 1 spectrum, VVTLLYDLVTEK |
0.000 |
|
0.000 |
|
0.963 |
0.024 |
0.000 |
0.013 |
0.000 |
|
| 2 spectra, QVQLLPGLR |
0.007 |
|
0.000 |
|
0.993 |
0.000 |
0.000 |
0.000 |
0.000 |
|
| | | Plot |
|
Lyso |
|
|
|
|
|
|
|
Other |
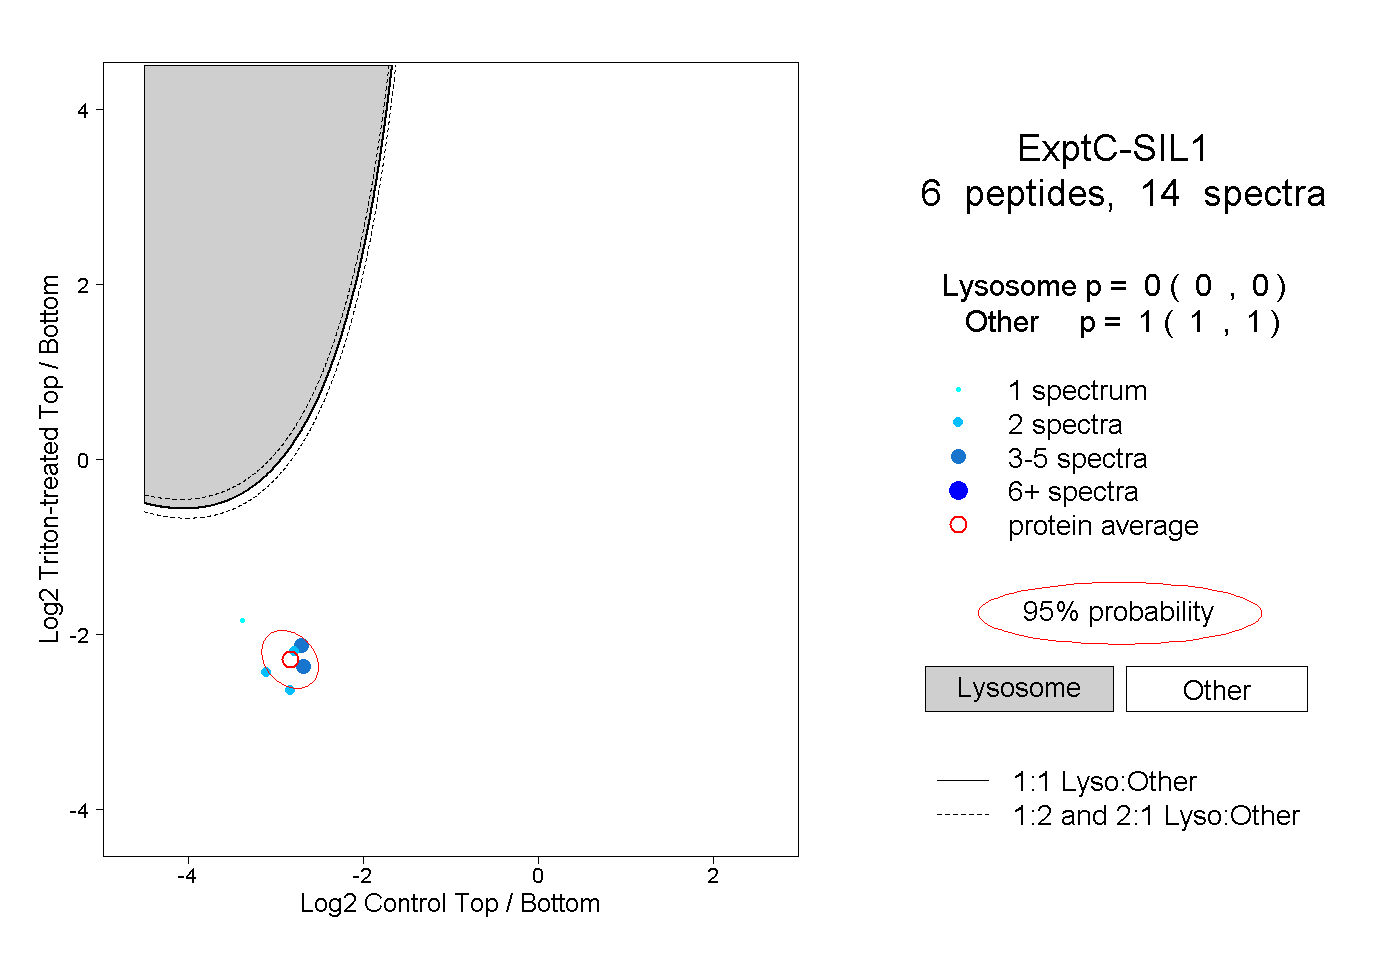
| Expt C |
6
peptides |
14
spectra |
 |
|
0.000
0.000 | 0.000 |
|
|
|
|
|
|
|
1.000
1.000 | 1.000 |