 12
12peptides
spectra
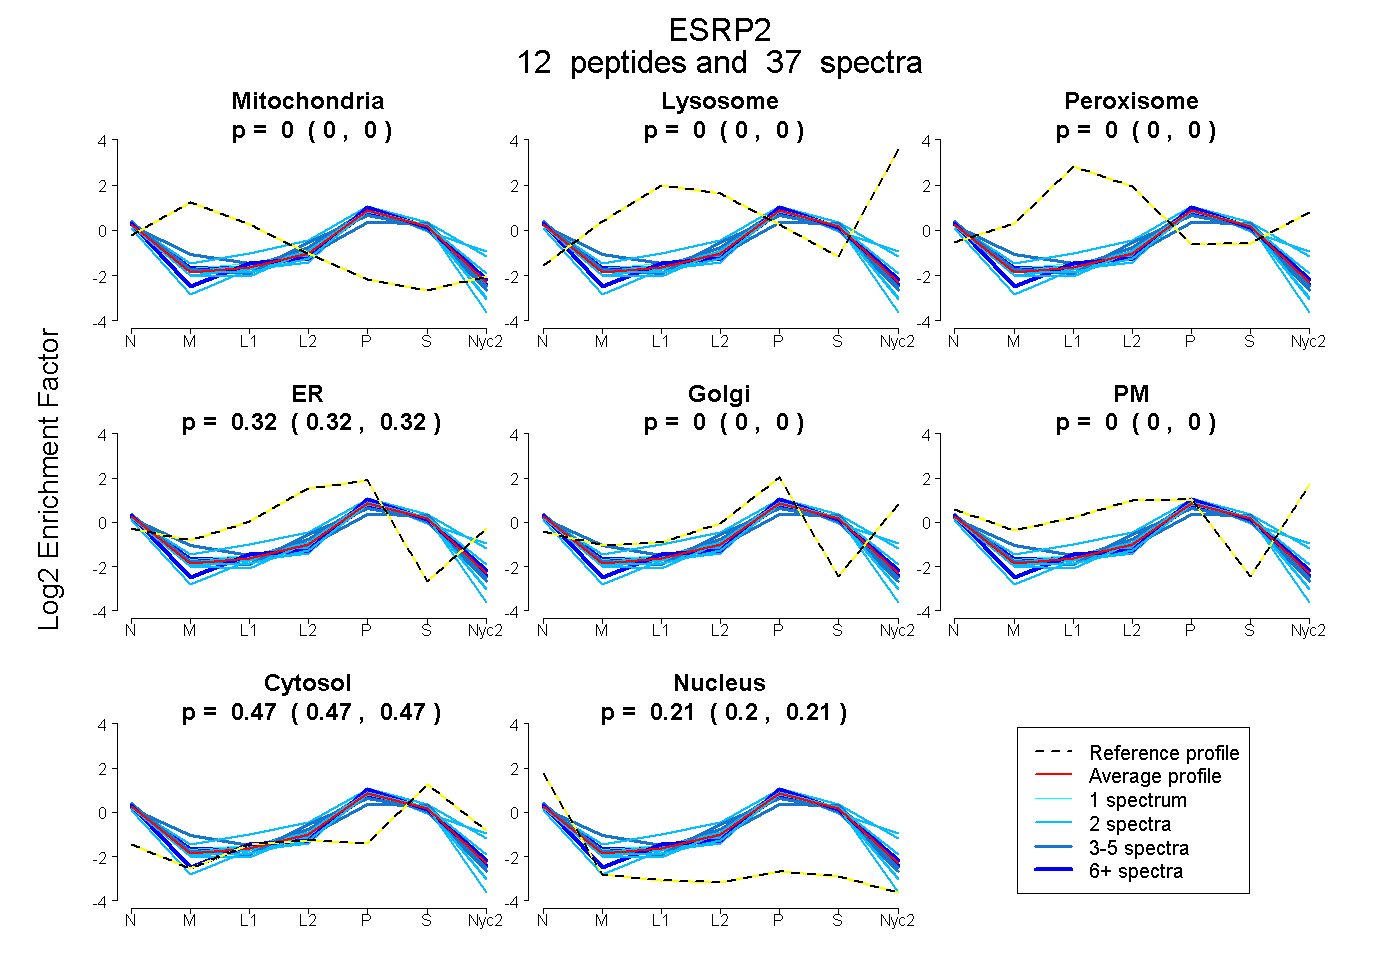
0.000 | 0.000
0.000 | 0.000
0.000 | 0.000
0.317 | 0.324
0.000 | 0.000
0.000 | 0.000
0.467 | 0.474
0.204 | 0.212
6peptides
spectra
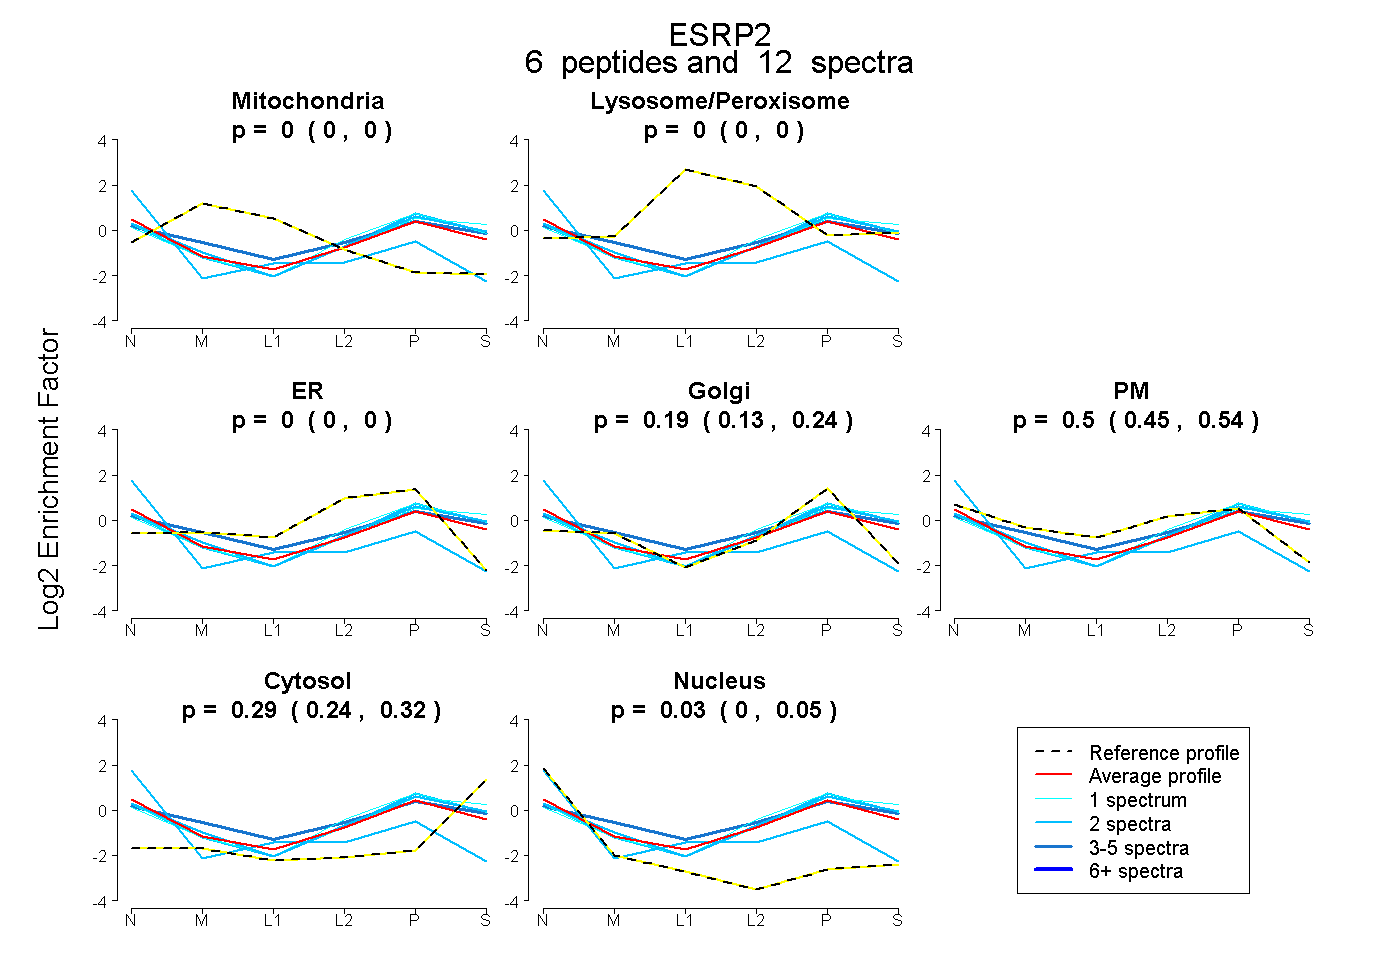
0.000 | 0.000
0.000 | 0.000
0.000 | 0.000
0.128 | 0.239
0.449 | 0.543
0.242 | 0.319
0.000 | 0.052
7peptides
spectra
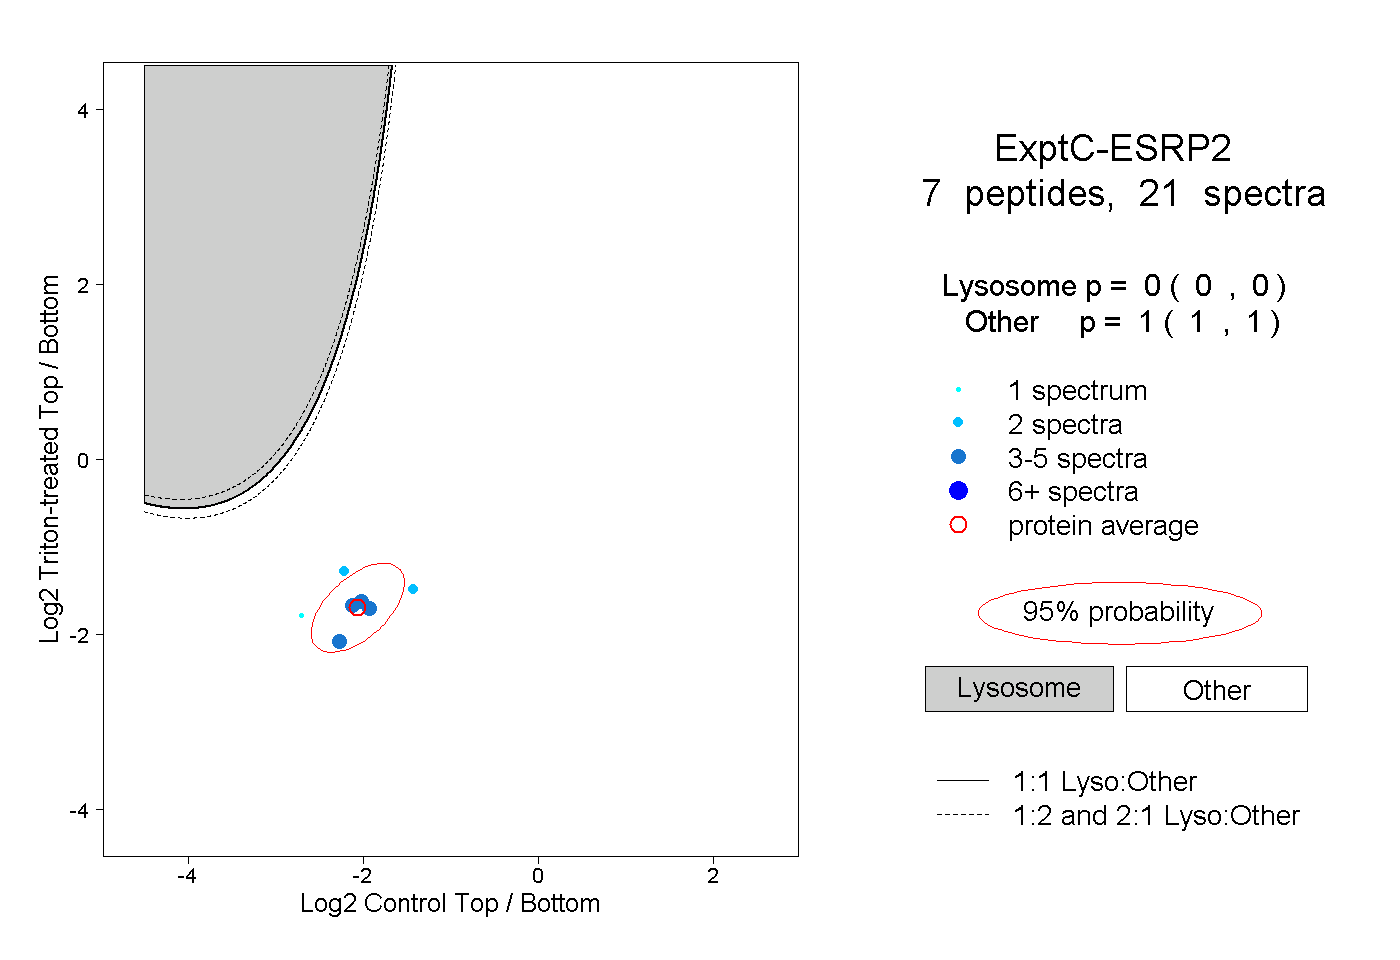
0.000 | 0.000
1.000 | 1.000
5peptides
spectra
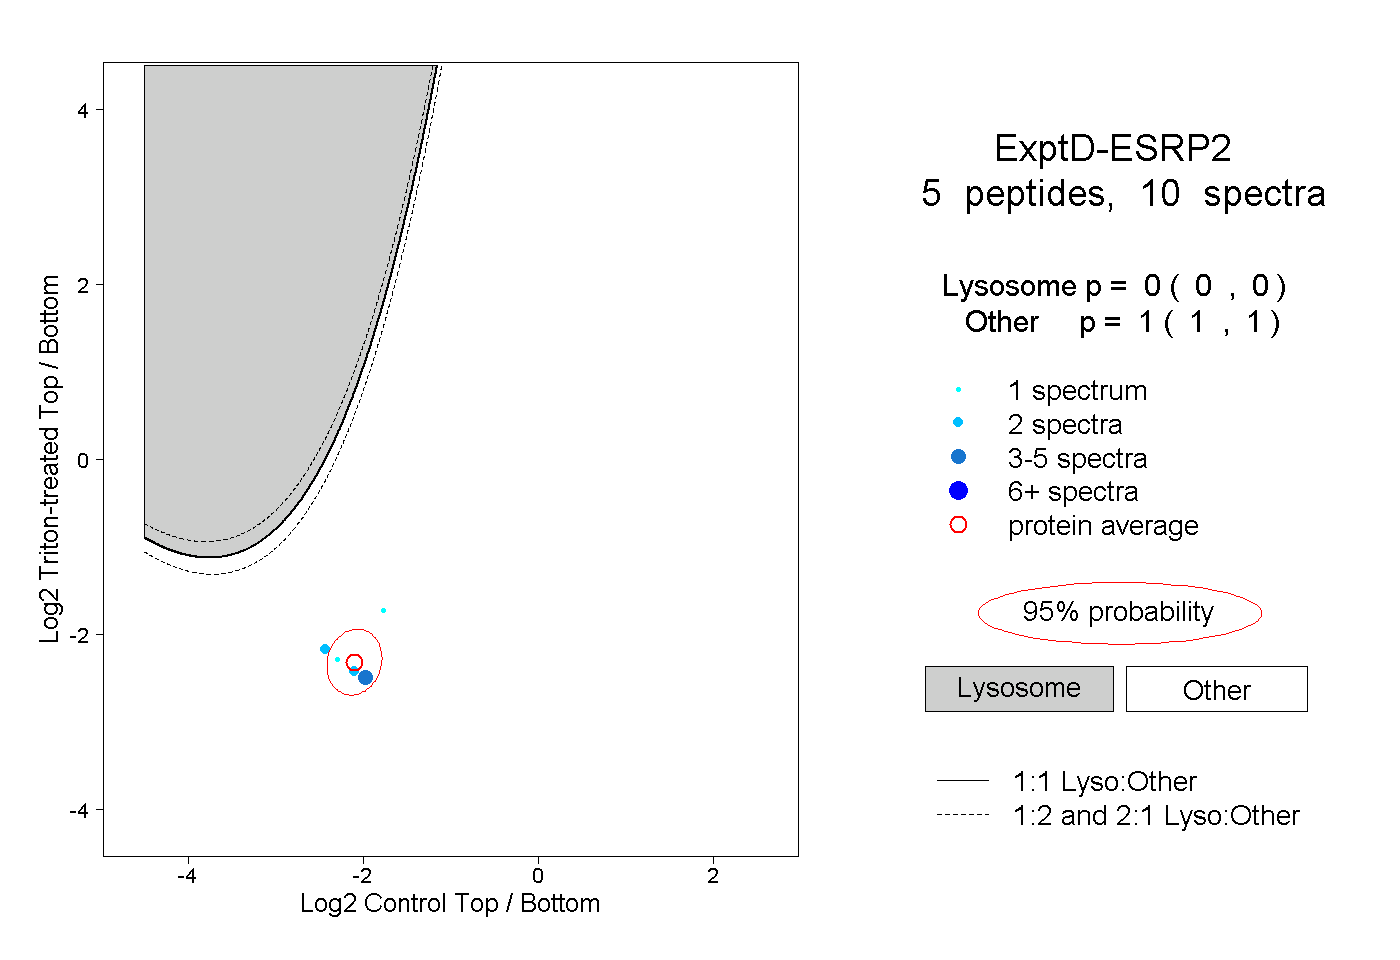
0.000 | 0.000
1.000 | 1.000