 12
12peptides
spectra
0.000 | 0.000
0.000 | 0.000
0.000 | 0.000
0.317 | 0.324
0.000 | 0.000
0.000 | 0.000
0.467 | 0.474
0.204 | 0.212
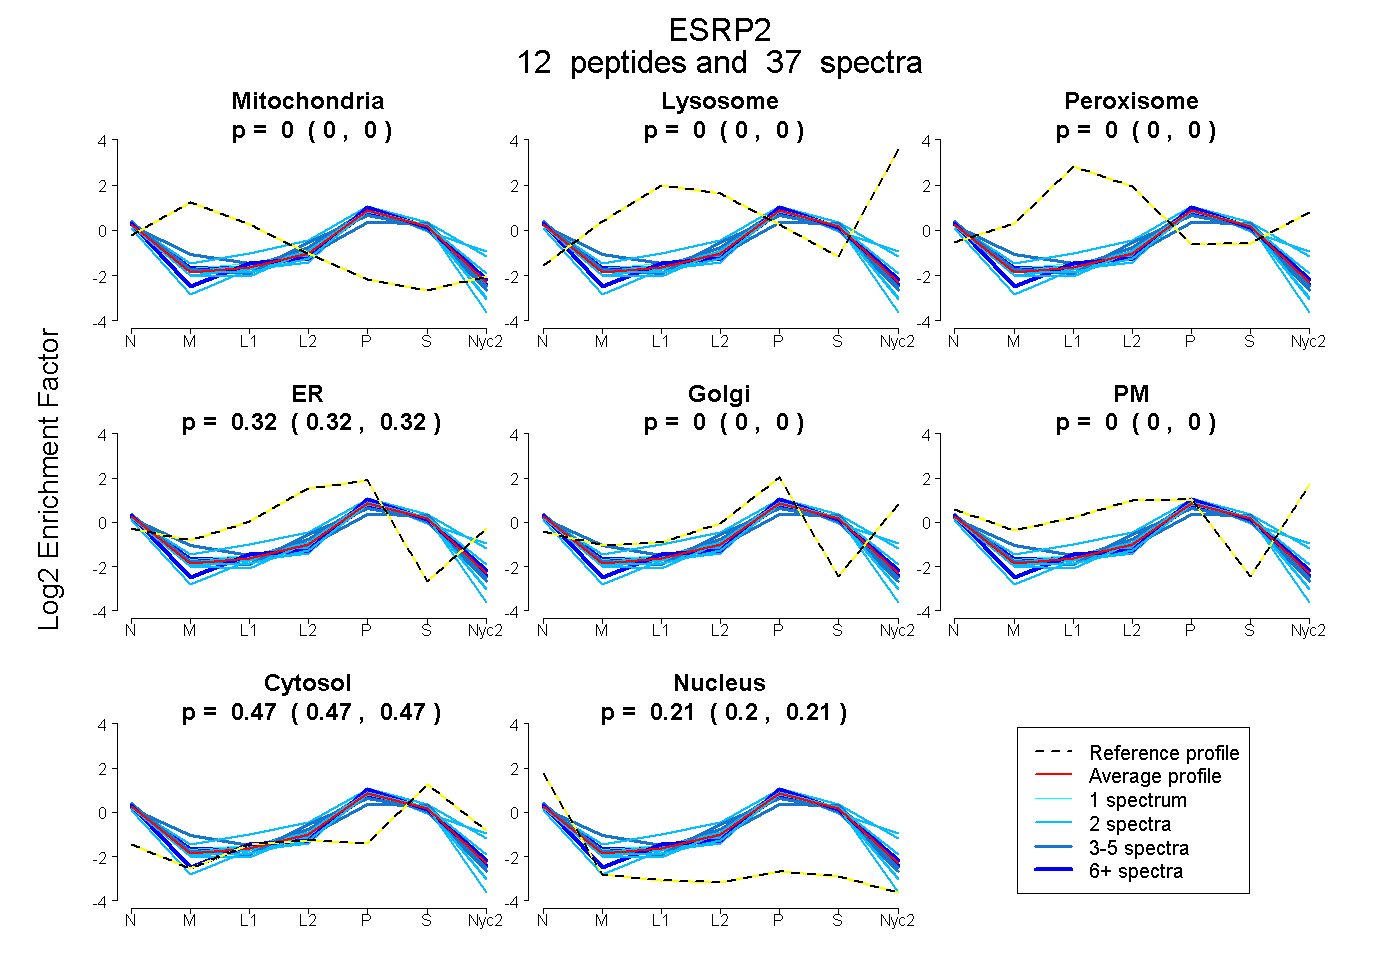
| Plot | Mito | Lyso | Perox | ER | Golgi | PM | Cytosol | Nucleus | |||||
| Expt A |
12 peptides |
37 spectra |
|
0.000 0.000 | 0.000 |
0.000 0.000 | 0.000 |
0.000 0.000 | 0.000 |
0.321 0.317 | 0.324 |
0.000 0.000 | 0.000 |
0.000 0.000 | 0.000 |
0.471 0.467 | 0.474 |
0.208 0.204 | 0.212 |
| 2 spectra, GLPWQSSDQDVAR | 0.000 | 0.000 | 0.000 | 0.291 | 0.000 | 0.000 | 0.451 | 0.258 | ||
| 3 spectra, ATGEEFVK | 0.036 | 0.000 | 0.000 | 0.286 | 0.000 | 0.000 | 0.499 | 0.178 | ||
| 2 spectra, ALAAAQR | 0.000 | 0.000 | 0.000 | 0.000 | 0.340 | 0.000 | 0.538 | 0.122 | ||
| 2 spectra, YIELFR | 0.000 | 0.000 | 0.000 | 0.195 | 0.144 | 0.000 | 0.480 | 0.182 | ||
| 8 spectra, VLMGGSLSR | 0.000 | 0.000 | 0.000 | 0.246 | 0.068 | 0.000 | 0.475 | 0.211 | ||
| 4 spectra, IAGGTSLEVAR | 0.000 | 0.000 | 0.000 | 0.329 | 0.000 | 0.000 | 0.452 | 0.219 | ||
| 6 spectra, ADVVDNETVVR | 0.000 | 0.000 | 0.000 | 0.313 | 0.000 | 0.000 | 0.467 | 0.221 | ||
| 2 spectra, DLALQR | 0.000 | 0.000 | 0.000 | 0.313 | 0.189 | 0.000 | 0.442 | 0.057 | ||
| 2 spectra, GGVALCLNAQGR | 0.000 | 0.000 | 0.000 | 0.326 | 0.000 | 0.000 | 0.432 | 0.242 | ||
| 1 spectrum, EDQVILR | 0.000 | 0.000 | 0.000 | 0.286 | 0.042 | 0.000 | 0.477 | 0.195 | ||
| 2 spectra, YIEVYK | 0.000 | 0.000 | 0.000 | 0.252 | 0.000 | 0.000 | 0.430 | 0.318 | ||
| 3 spectra, FEDSEQR | 0.000 | 0.000 | 0.000 | 0.353 | 0.000 | 0.000 | 0.411 | 0.236 |
| Plot | Mito | Lyso or Perox | ER | Golgi | PM | Cytosol | Nucleus | ||||||
| Expt B |
6 peptides |
12 spectra |
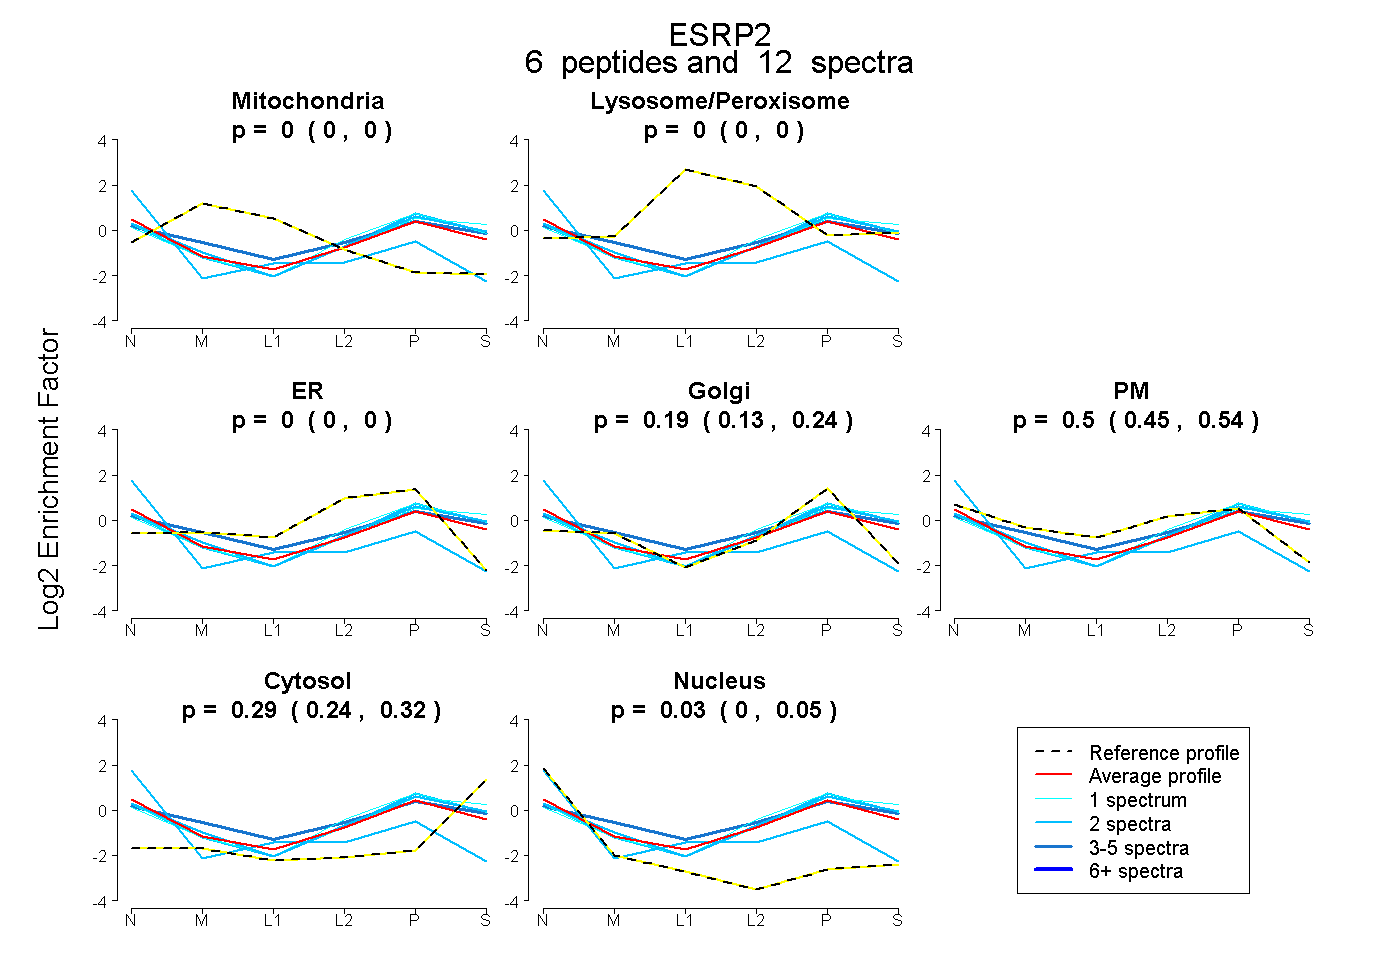 |
0.000 0.000 | 0.000 |
0.000 0.000 | 0.000 |
0.000 0.000 | 0.000 |
0.188 0.128 | 0.239 |
0.499 0.449 | 0.543 |
0.285 0.242 | 0.319 |
0.027 0.000 | 0.052 |
|||
| Plot | Lyso | Other | |||||||||||
| Expt C |
7 peptides |
21 spectra |
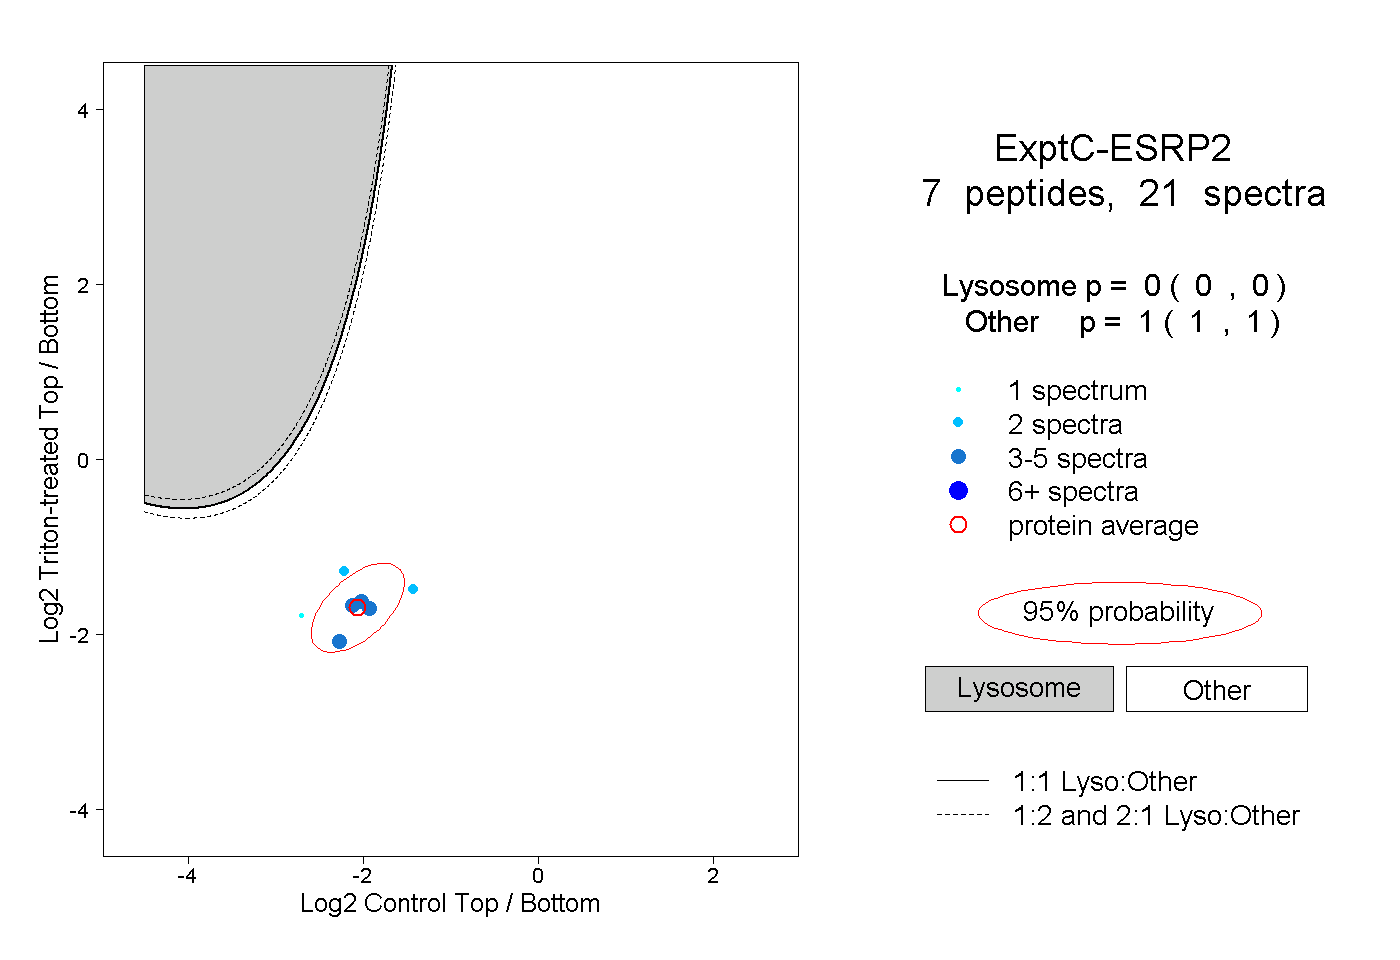 |
0.000 0.000 | 0.000 |
1.000 1.000 | 1.000 |
||||||||
| Plot | Lyso | Other | |||||||||||
| Expt D |
5 peptides |
10 spectra |
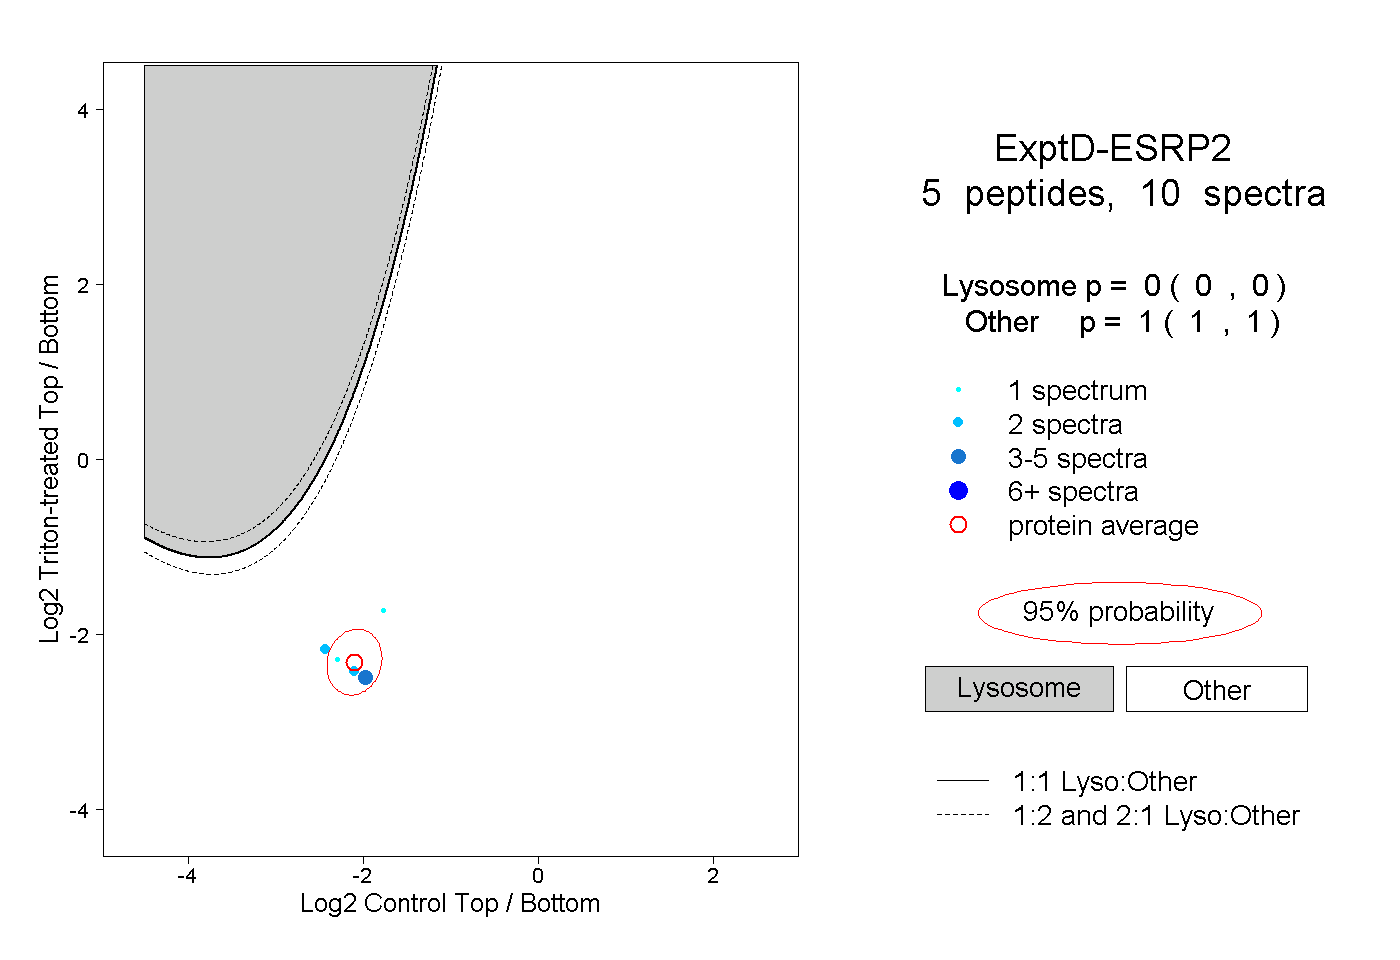 |
0.000 0.000 | 0.000 |
1.000 1.000 | 1.000 |