ESRP2
[ENSRNOP00000026873]
Main page
| | | Plot |
Mito |
Lyso |
|
Perox |
ER |
Golgi |
PM |
Cytosol |
Nucleus |
|
| Expt A |
 12
12
peptides |
37
spectra |
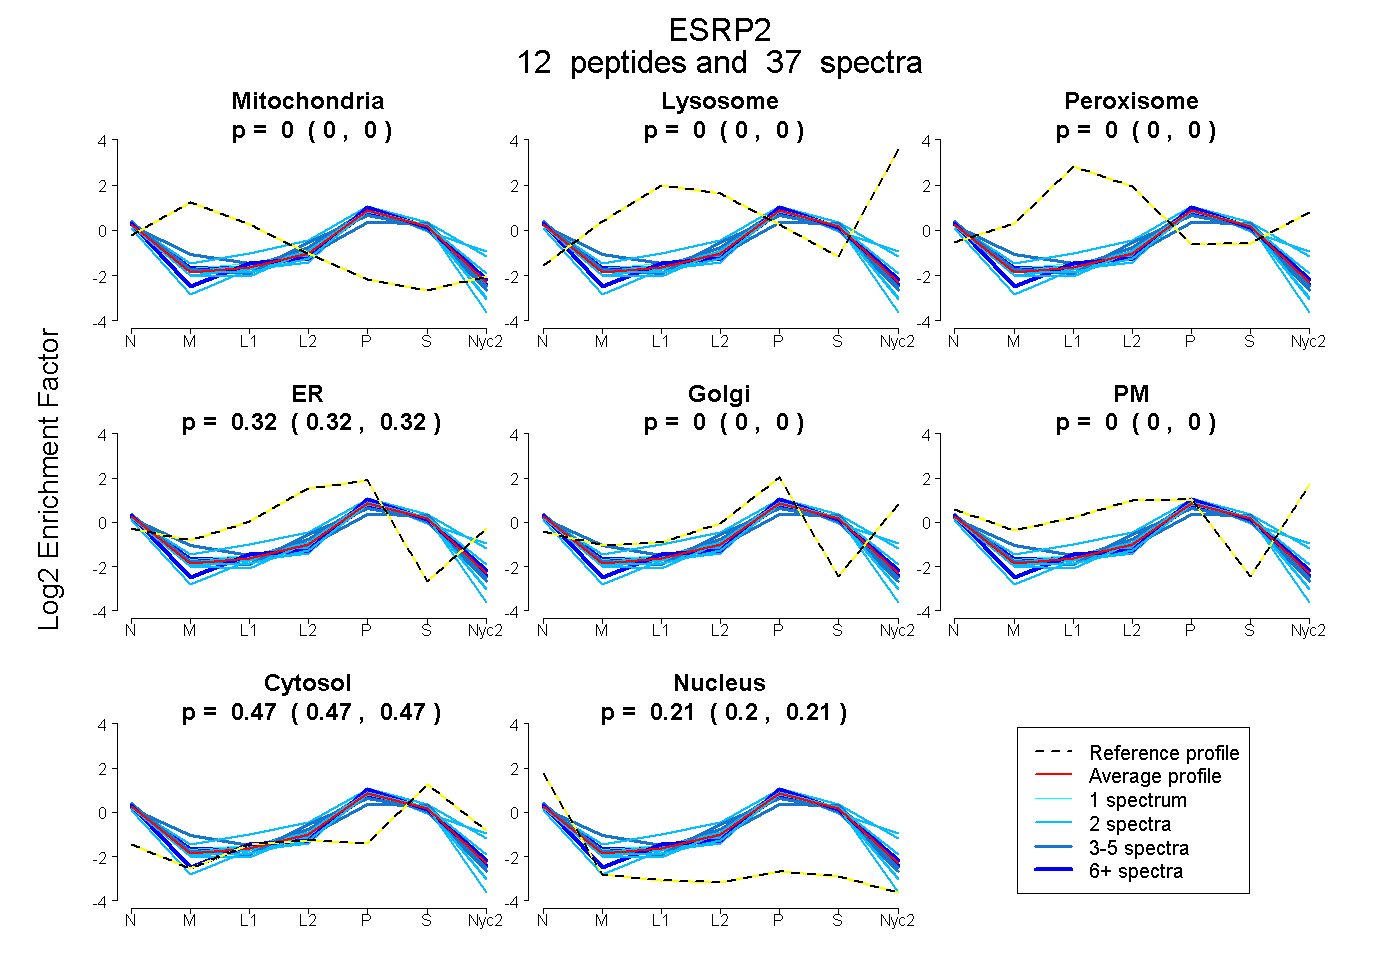 |
0.000
0.000 | 0.000 |
0.000
0.000 | 0.000 |
|
0.000
0.000 | 0.000 |
0.321
0.317 | 0.324 |
0.000
0.000 | 0.000 |
0.000
0.000 | 0.000 |
0.471
0.467 | 0.474 |
0.208
0.204 | 0.212 |
|
| | | Plot |
Mito |
|
Lyso or Perox |
|
ER |
Golgi |
PM |
Cytosol |
Nucleus |
|
| Expt B |
6
peptides |
12
spectra |
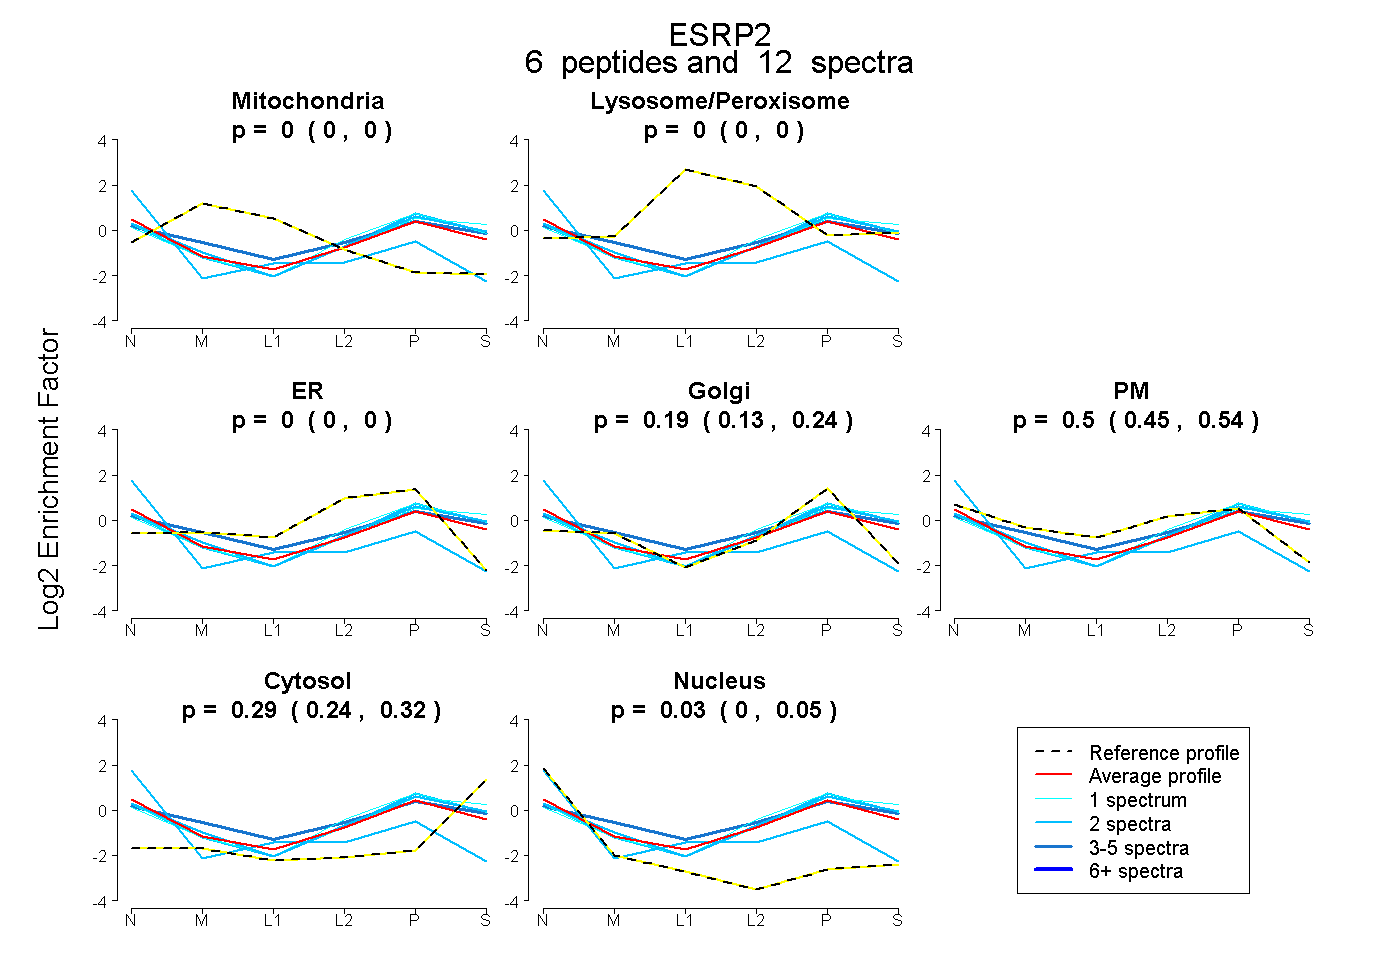 |
0.000
0.000 | 0.000 |
|
0.000
0.000 | 0.000 |
|
0.000
0.000 | 0.000 |
0.188
0.128 | 0.239 |
0.499
0.449 | 0.543 |
0.285
0.242 | 0.319 |
0.027
0.000 | 0.052 |
|
| 2 spectra, IAGGTSLEVAR |
0.000 |
|
0.000 |
|
0.000 |
0.311 |
0.370 |
0.319 |
0.000 |
|
| 4 spectra, EASGLSADSLAR |
0.000 |
|
0.065 |
|
0.000 |
0.137 |
0.505 |
0.293 |
0.000 |
|
| 2 spectra, ADVVDNETVVR |
0.000 |
|
0.000 |
|
0.000 |
0.361 |
0.335 |
0.304 |
0.000 |
|
| 2 spectra, YIEIFR |
0.000 |
|
0.000 |
|
0.058 |
0.000 |
0.461 |
0.000 |
0.481 |
|
| 1 spectrum, EDQVILR |
0.000 |
|
0.000 |
|
0.000 |
0.266 |
0.344 |
0.390 |
0.000 |
|
| 1 spectrum, FEDSEQR |
0.000 |
|
0.000 |
|
0.000 |
0.323 |
0.390 |
0.287 |
0.000 |
|
| | | Plot |
|
Lyso |
|
|
|
|
|
|
|
Other |
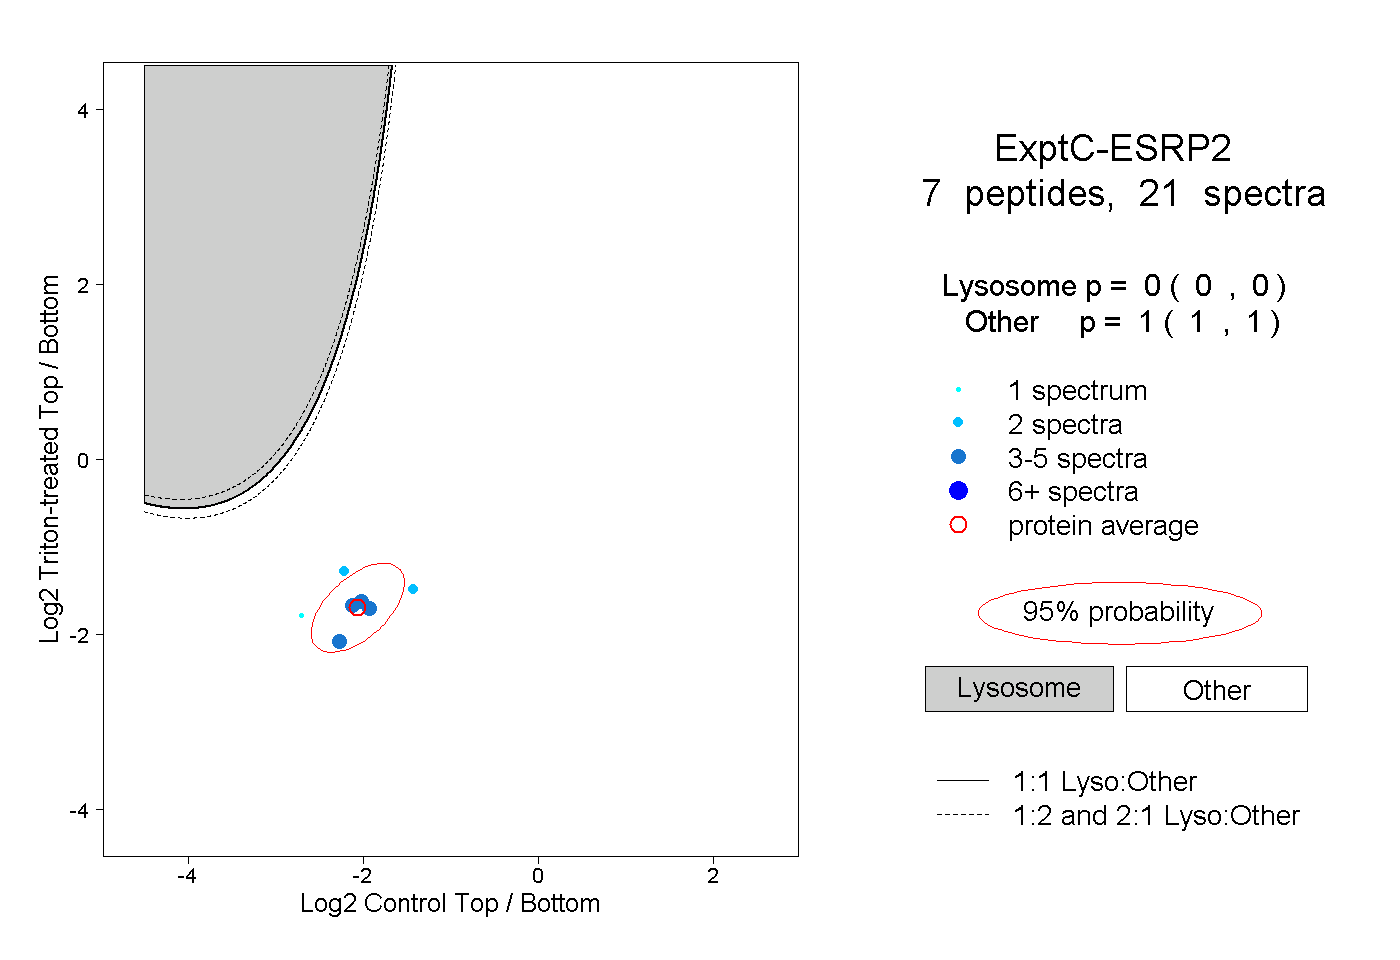
| Expt C |
7
peptides |
21
spectra |
 |
|
0.000
0.000 | 0.000 |
|
|
|
|
|
|
|
1.000
1.000 | 1.000 |
| | | Plot |
|
Lyso |
|
|
|
|
|
|
|
Other |
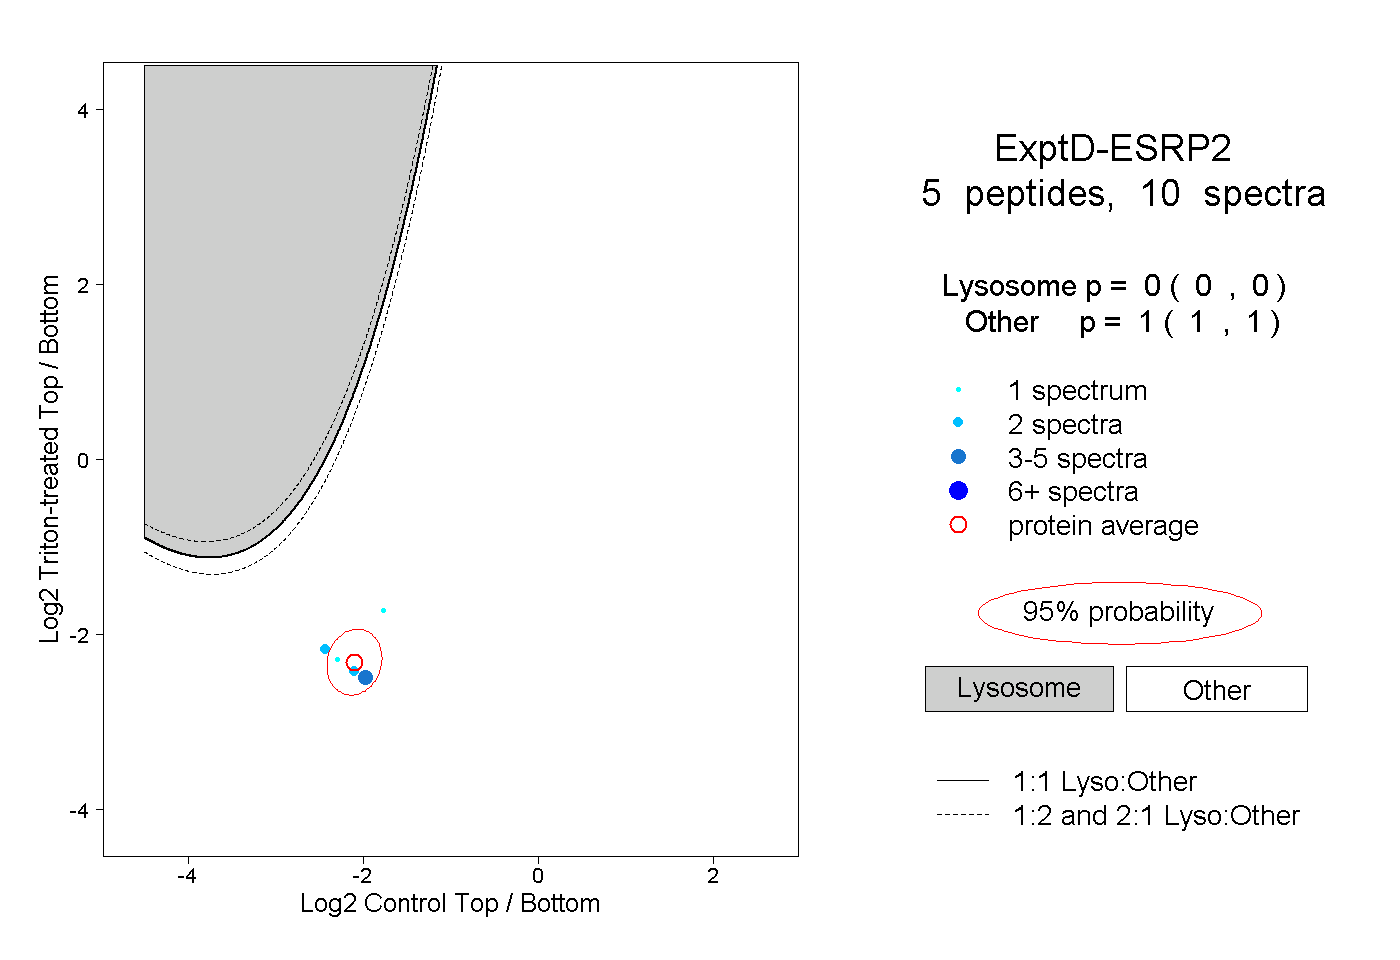
| Expt D |
5
peptides |
10
spectra |
 |
|
0.000
0.000 | 0.000 |
|
|
|
|
|
|
|
1.000
1.000 | 1.000 |