 12
12peptides
spectra
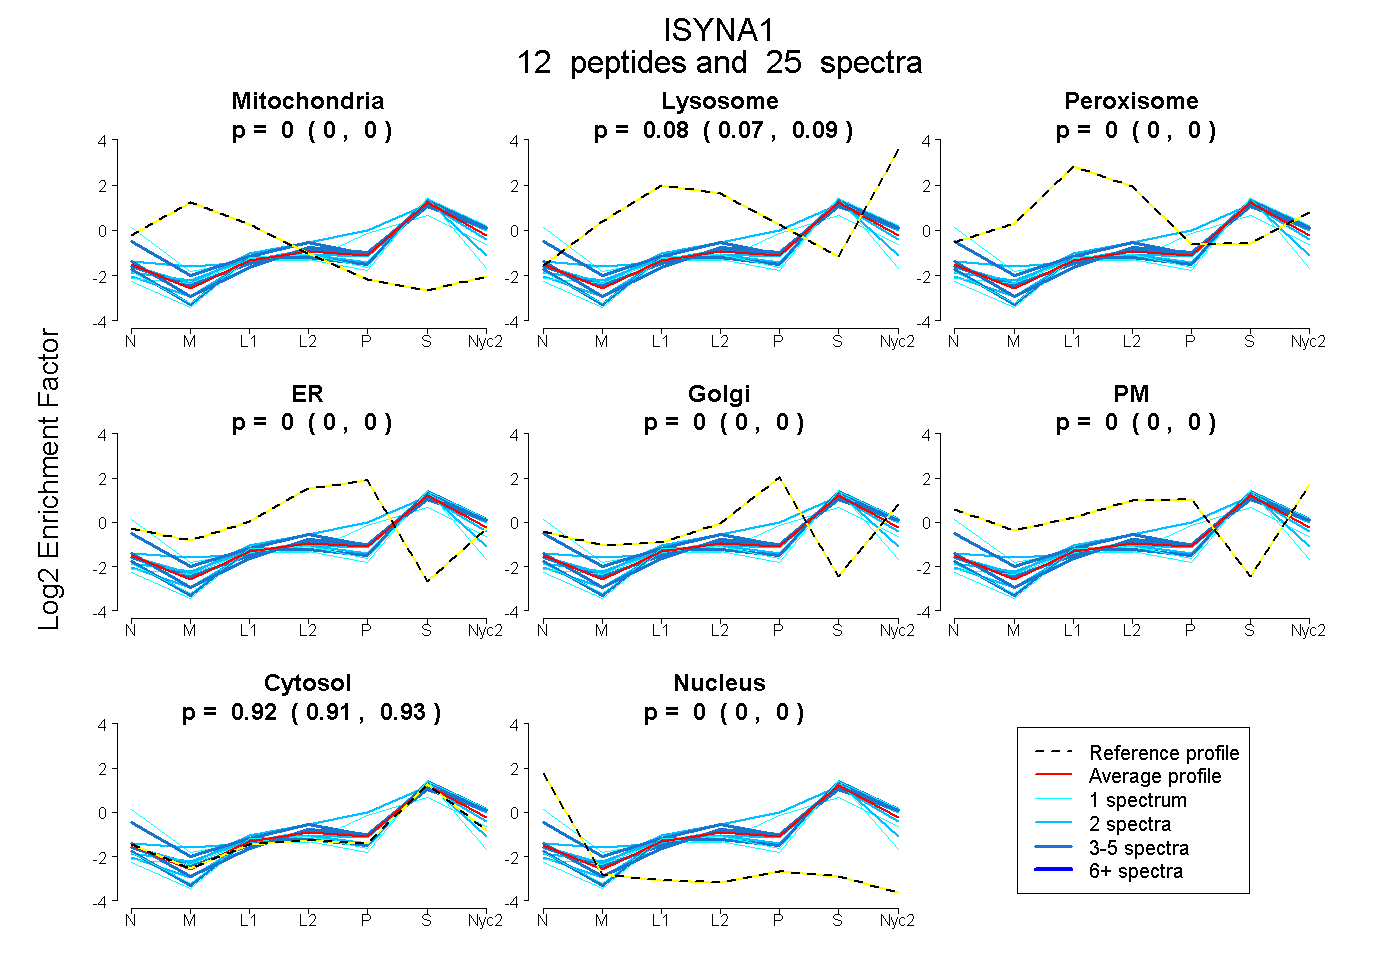
0.000 | 0.000
0.073 | 0.086
0.000 | 0.000
0.000 | 0.000
0.000 | 0.003
0.000 | 0.000
0.913 | 0.925
0.000 | 0.000
3peptides
spectra
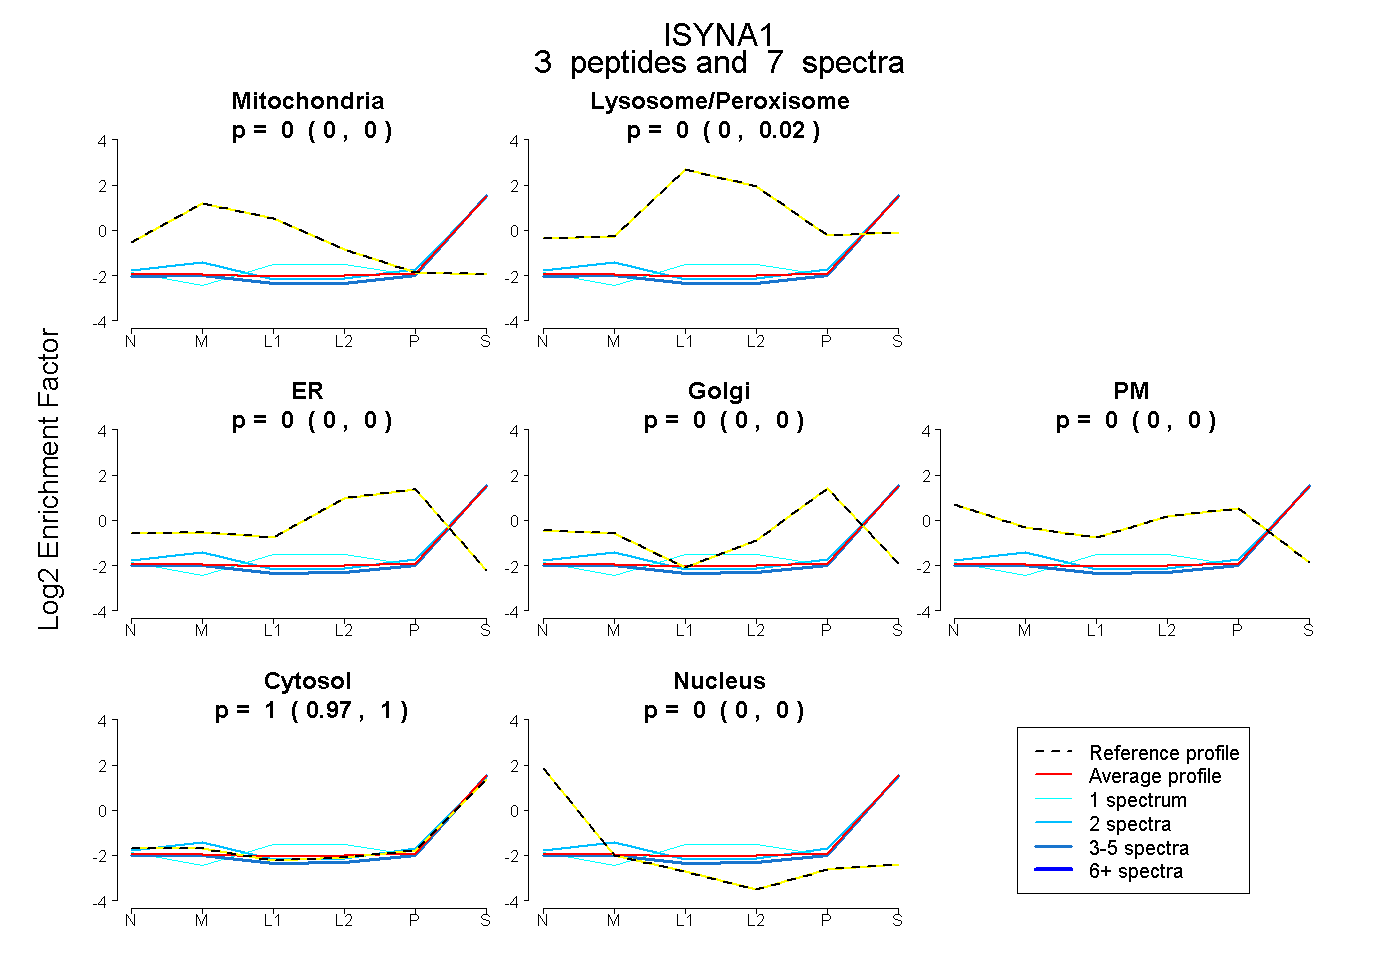
0.000 | 0.000
0.000 | 0.022
0.000 | 0.000
0.000 | 0.000
0.000 | 0.000
0.973 | 1.000
0.000 | 0.000
12peptides
spectra
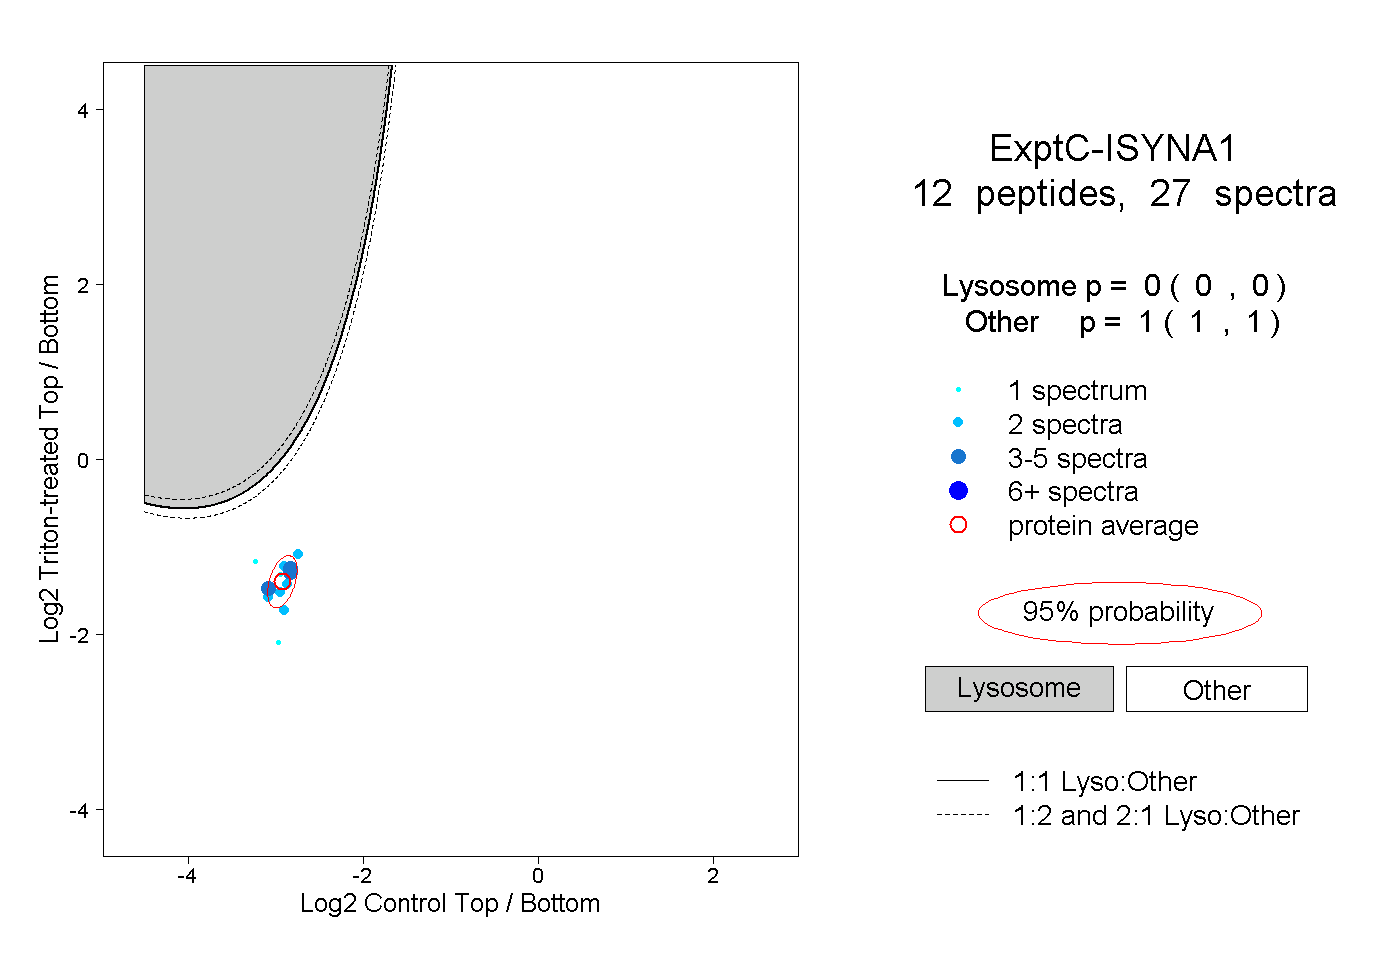
0.000 | 0.000
1.000 | 1.000
1peptide
spectrum
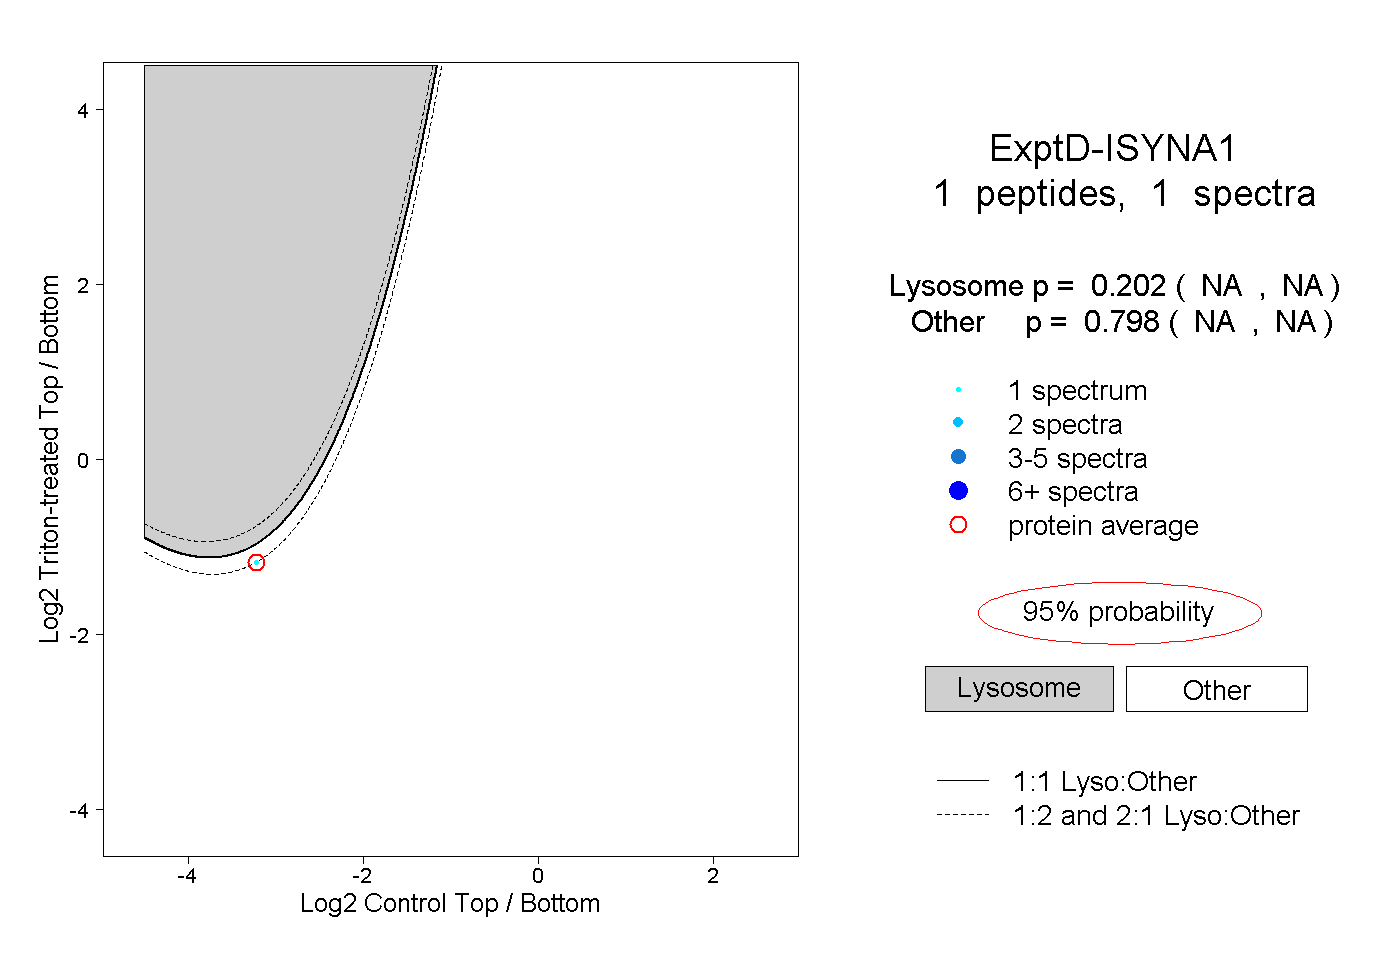
NA | NA
NA | NA