ISYNA1
[ENSRNOP00000026821]
Main page
| | | Plot |
Mito |
Lyso |
|
Perox |
ER |
Golgi |
PM |
Cytosol |
Nucleus |
|
| Expt A |
 12
12
peptides |
25
spectra |
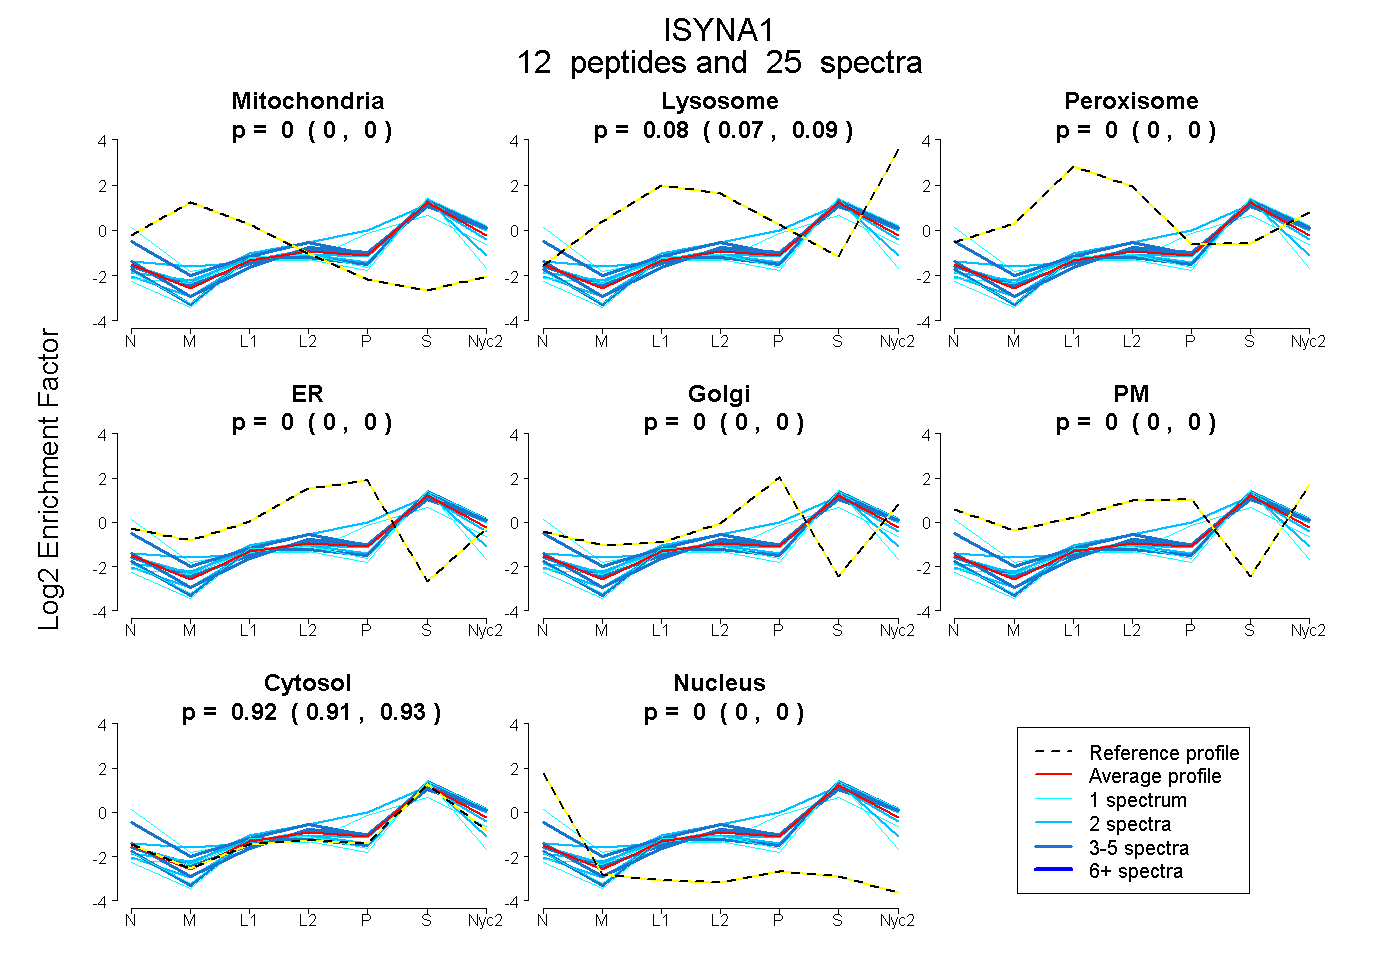 |
0.000
0.000 | 0.000 |
0.080
0.073 | 0.086 |
|
0.000
0.000 | 0.000 |
0.000
0.000 | 0.000 |
0.000
0.000 | 0.003 |
0.000
0.000 | 0.000 |
0.920
0.913 | 0.925 |
0.000
0.000 | 0.000 |
|
| | | Plot |
Mito |
|
Lyso or Perox |
|
ER |
Golgi |
PM |
Cytosol |
Nucleus |
|
| Expt B |
3
peptides |
7
spectra |
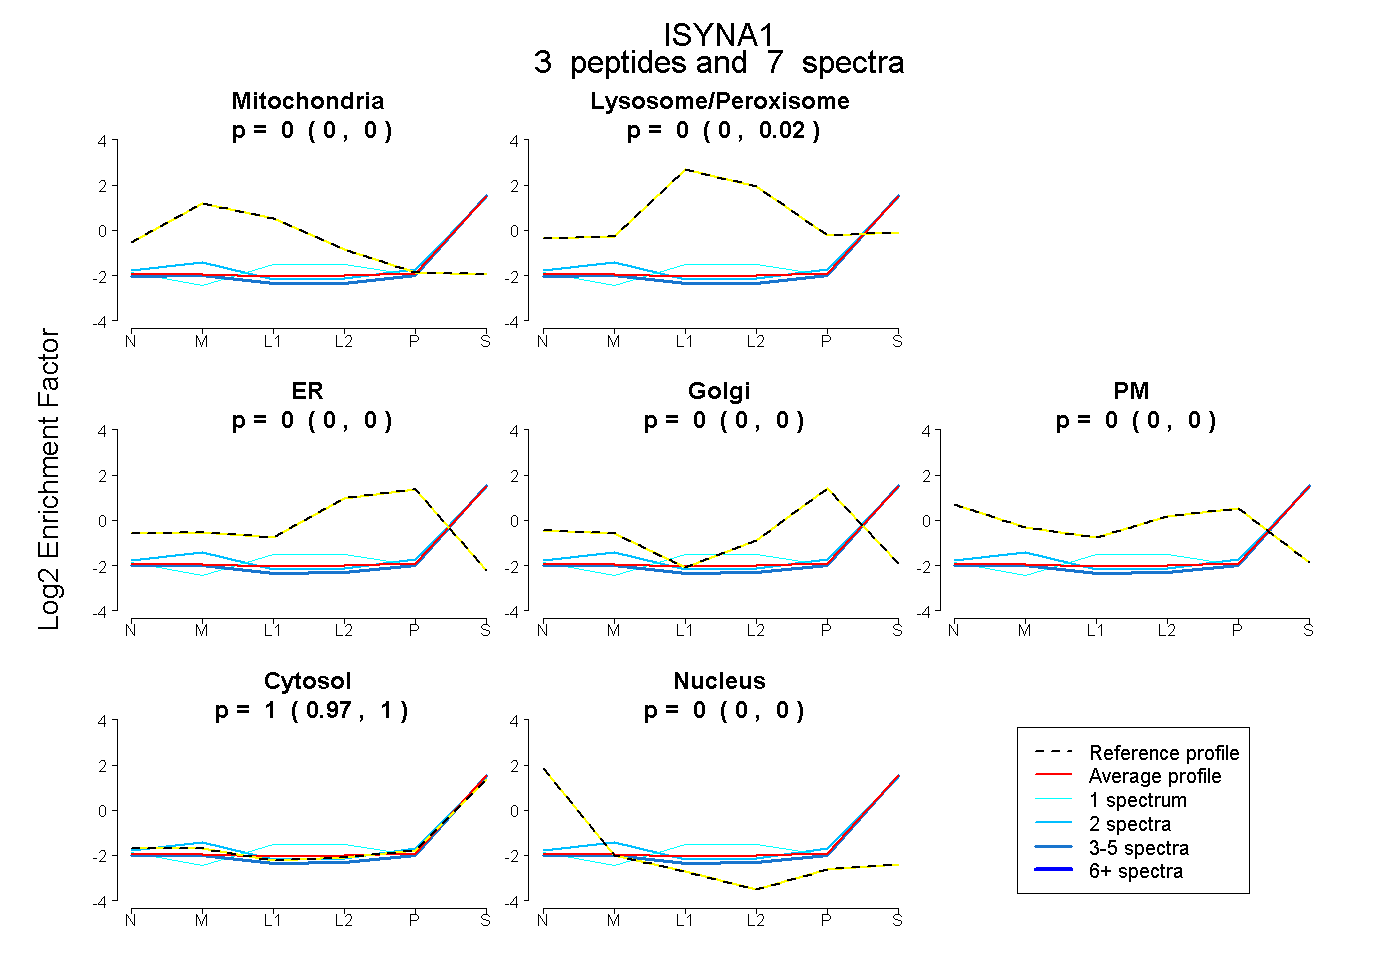 |
0.000
0.000 | 0.000 |
|
0.002
0.000 | 0.022 |
|
0.000
0.000 | 0.000 |
0.000
0.000 | 0.000 |
0.000
0.000 | 0.000 |
0.998
0.973 | 1.000 |
0.000
0.000 | 0.000 |
|
| 2 spectra, ADNLIPGTR |
0.016 |
|
0.000 |
|
0.000 |
0.000 |
0.000 |
0.984 |
0.000 |
|
| 1 spectrum, FCEVVPGR |
0.000 |
|
0.077 |
|
0.000 |
0.000 |
0.000 |
0.923 |
0.000 |
|
| 4 spectra, SCIENIFR |
0.000 |
|
0.000 |
|
0.000 |
0.000 |
0.000 |
1.000 |
0.000 |
|
| | | Plot |
|
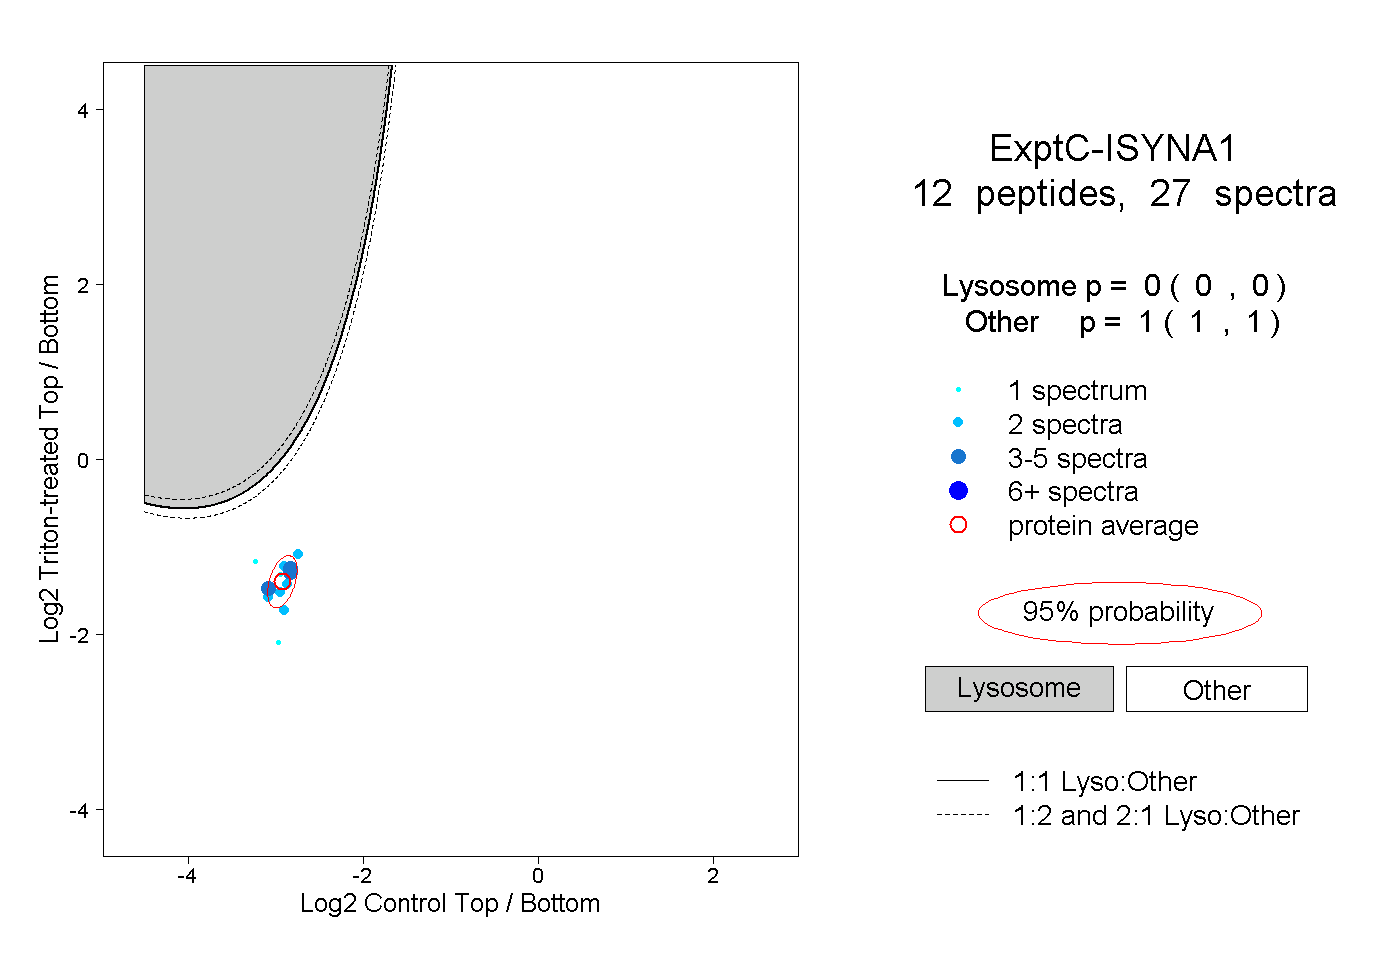
Lyso |
|
|
|
|
|
|
|
Other |
| Expt C |
12
peptides |
27
spectra |
 |
|
0.000
0.000 | 0.000 |
|
|
|
|
|
|
|
1.000
1.000 | 1.000 |
| | | Plot |
|
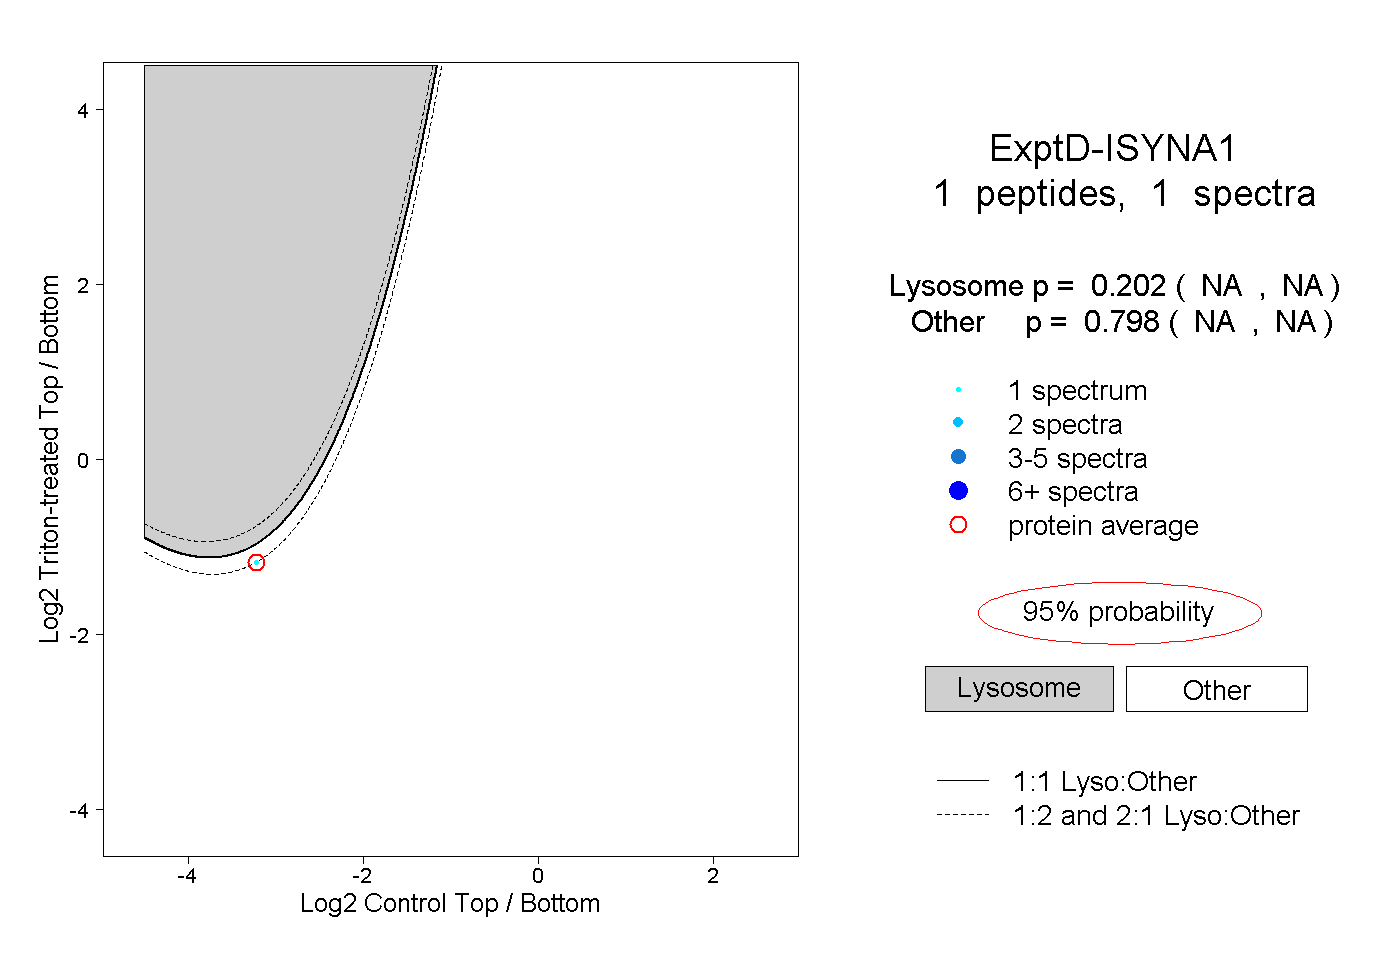
Lyso |
|
|
|
|
|
|
|
Other |
| Expt D |
1
peptide |
1
spectrum |
 |
|
0.202
NA | NA |
|
|
|
|
|
|
|
0.798
NA | NA |