 12
12peptides
spectra
0.000 | 0.000
0.073 | 0.086
0.000 | 0.000
0.000 | 0.000
0.000 | 0.003
0.000 | 0.000
0.913 | 0.925
0.000 | 0.000
| Plot | Mito | Lyso | Perox | ER | Golgi | PM | Cytosol | Nucleus | |||||
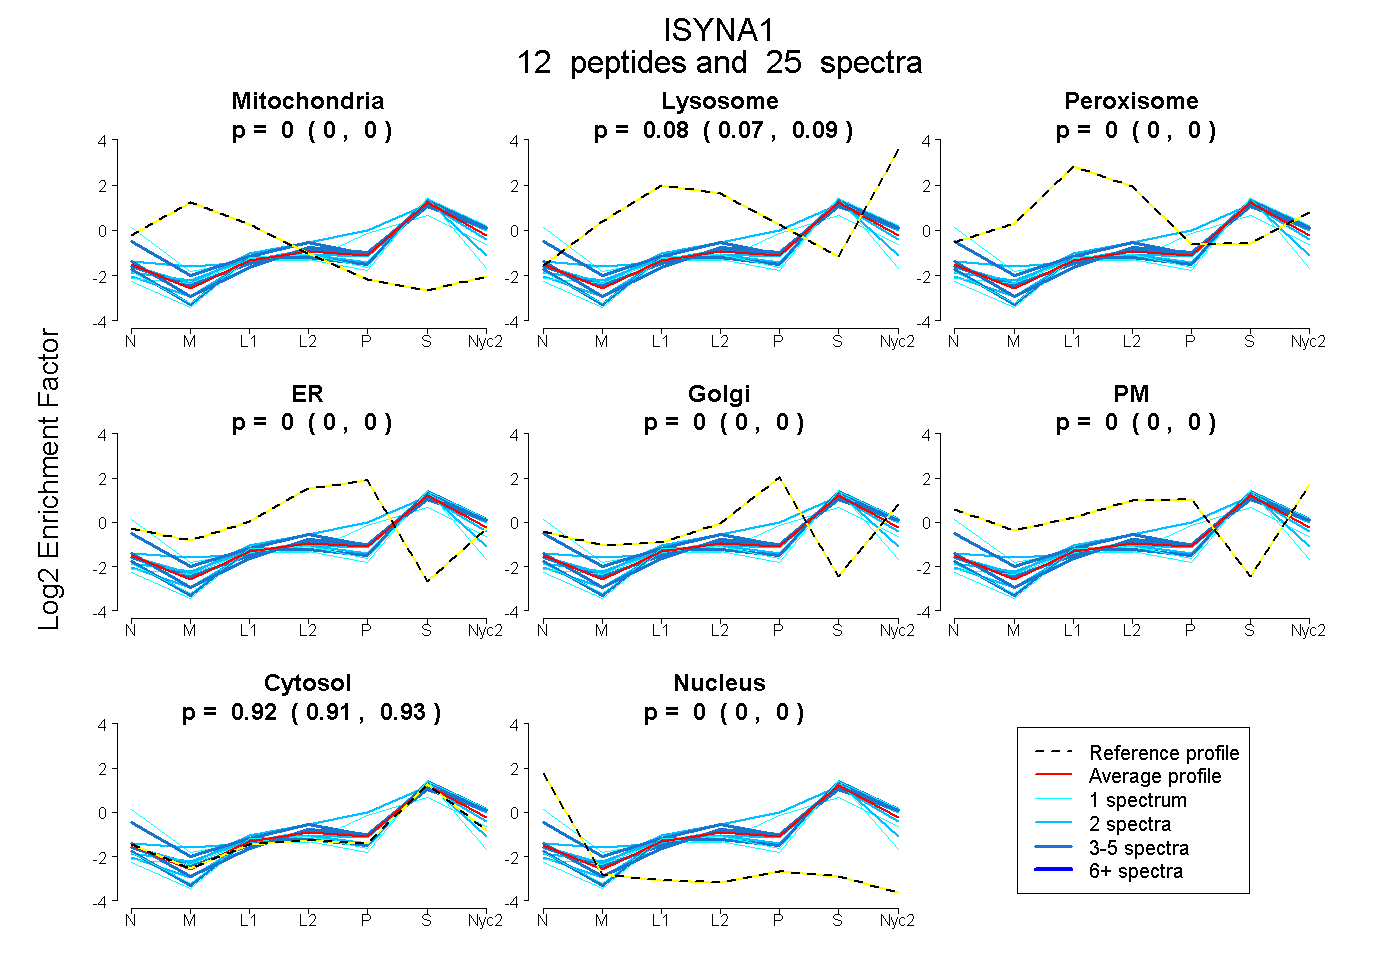
| Expt A |
12 peptides |
25 spectra |
|
0.000 0.000 | 0.000 |
0.080 0.073 | 0.086 |
0.000 0.000 | 0.000 |
0.000 0.000 | 0.000 |
0.000 0.000 | 0.003 |
0.000 0.000 | 0.000 |
0.920 0.913 | 0.925 |
0.000 0.000 | 0.000 |
| 3 spectra, VRPTATR | 0.000 | 0.058 | 0.000 | 0.000 | 0.045 | 0.000 | 0.897 | 0.000 | ||
| 1 spectrum, VLYAPGEEPDHCVVIK | 0.000 | 0.000 | 0.000 | 0.000 | 0.000 | 0.000 | 1.000 | 0.000 | ||
| 3 spectra, NDTAENLLR | 0.000 | 0.026 | 0.023 | 0.000 | 0.000 | 0.168 | 0.783 | 0.000 | ||
| 1 spectrum, MERPFPGIKPEEVK | 0.000 | 0.068 | 0.000 | 0.000 | 0.000 | 0.000 | 0.932 | 0.000 | ||
| 1 spectrum, EGGVLR | 0.000 | 0.000 | 0.000 | 0.000 | 0.138 | 0.123 | 0.652 | 0.087 | ||
| 1 spectrum, VIVLWTANTER | 0.000 | 0.057 | 0.000 | 0.000 | 0.000 | 0.000 | 0.943 | 0.000 | ||
| 2 spectra, HVFVGGDDFK | 0.041 | 0.090 | 0.000 | 0.000 | 0.000 | 0.000 | 0.869 | 0.000 | ||
| 2 spectra, ADNLIPGTR | 0.000 | 0.112 | 0.000 | 0.000 | 0.129 | 0.000 | 0.759 | 0.000 | ||
| 3 spectra, LTWPTR | 0.000 | 0.111 | 0.000 | 0.000 | 0.000 | 0.000 | 0.889 | 0.000 | ||
| 4 spectra, SSVVDDMVQSNR | 0.000 | 0.045 | 0.000 | 0.000 | 0.000 | 0.000 | 0.955 | 0.000 | ||
| 2 spectra, AQQLEQIR | 0.000 | 0.077 | 0.000 | 0.000 | 0.000 | 0.000 | 0.923 | 0.000 | ||
| 2 spectra, SCIENIFR | 0.013 | 0.000 | 0.026 | 0.000 | 0.000 | 0.000 | 0.961 | 0.000 |
| Plot | Mito | Lyso or Perox | ER | Golgi | PM | Cytosol | Nucleus | ||||||
| Expt B |
3 peptides |
7 spectra |
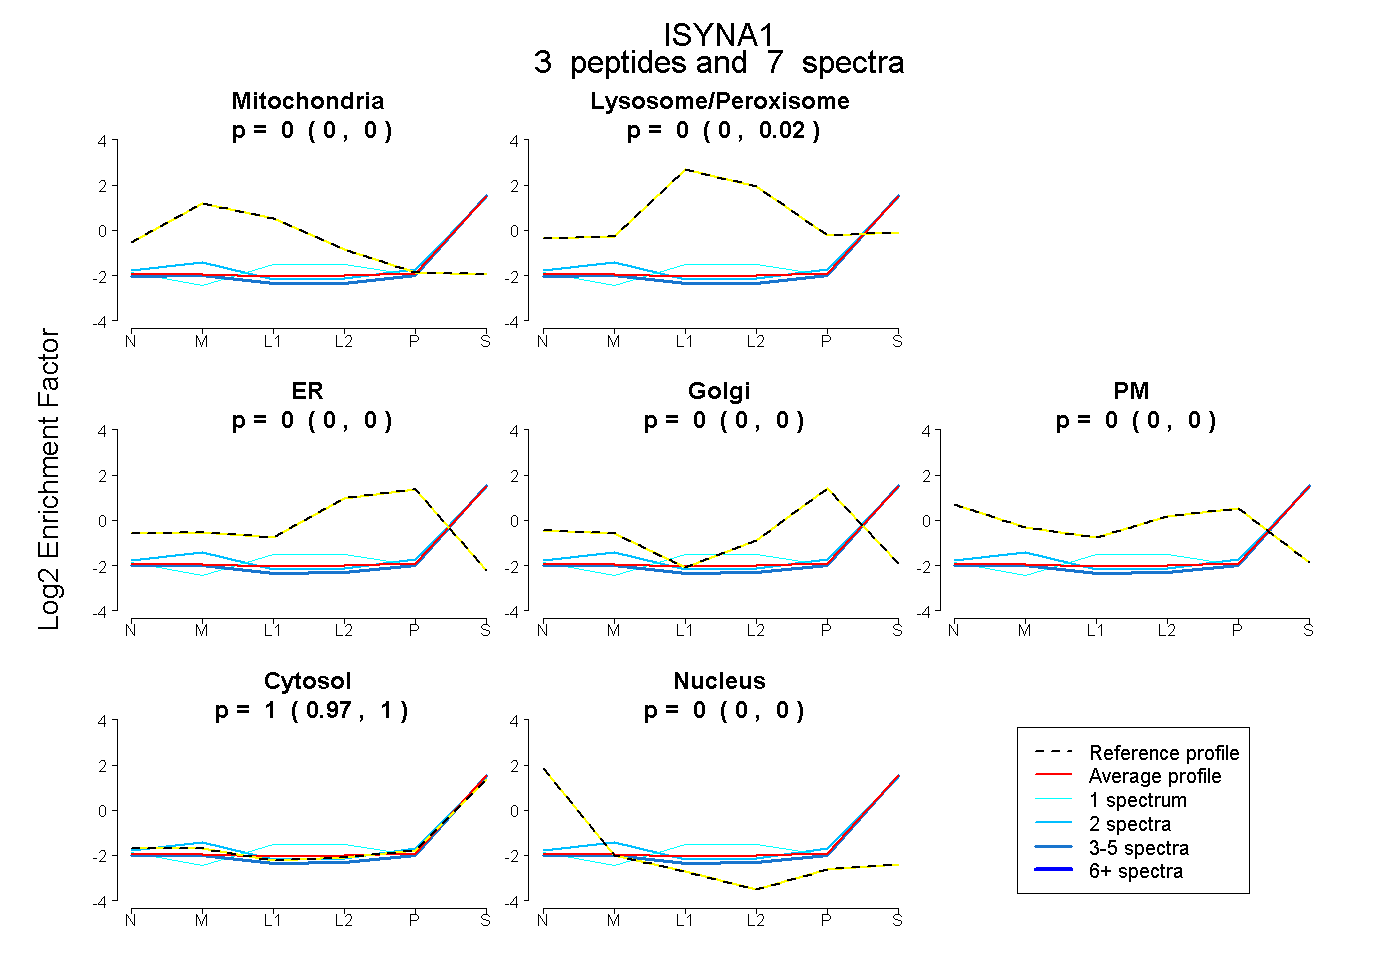 |
0.000 0.000 | 0.000 |
0.002 0.000 | 0.022 |
0.000 0.000 | 0.000 |
0.000 0.000 | 0.000 |
0.000 0.000 | 0.000 |
0.998 0.973 | 1.000 |
0.000 0.000 | 0.000 |
|||
| Plot | Lyso | Other | |||||||||||
| Expt C |
12 peptides |
27 spectra |
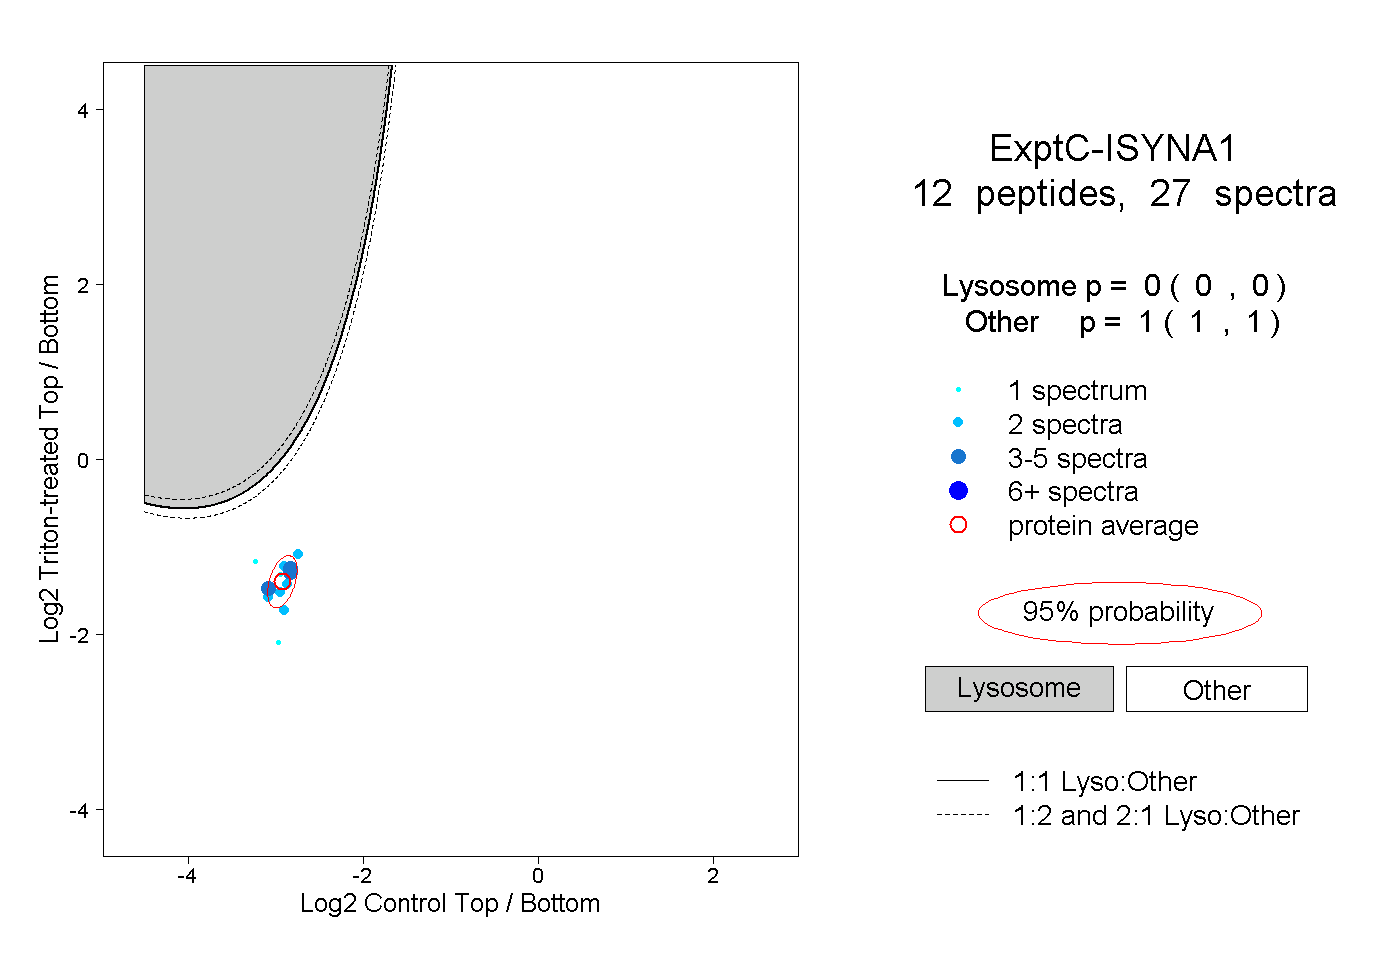 |
0.000 0.000 | 0.000 |
1.000 1.000 | 1.000 |
||||||||
| Plot | Lyso | Other | |||||||||||
| Expt D |
1 peptide |
1 spectrum |
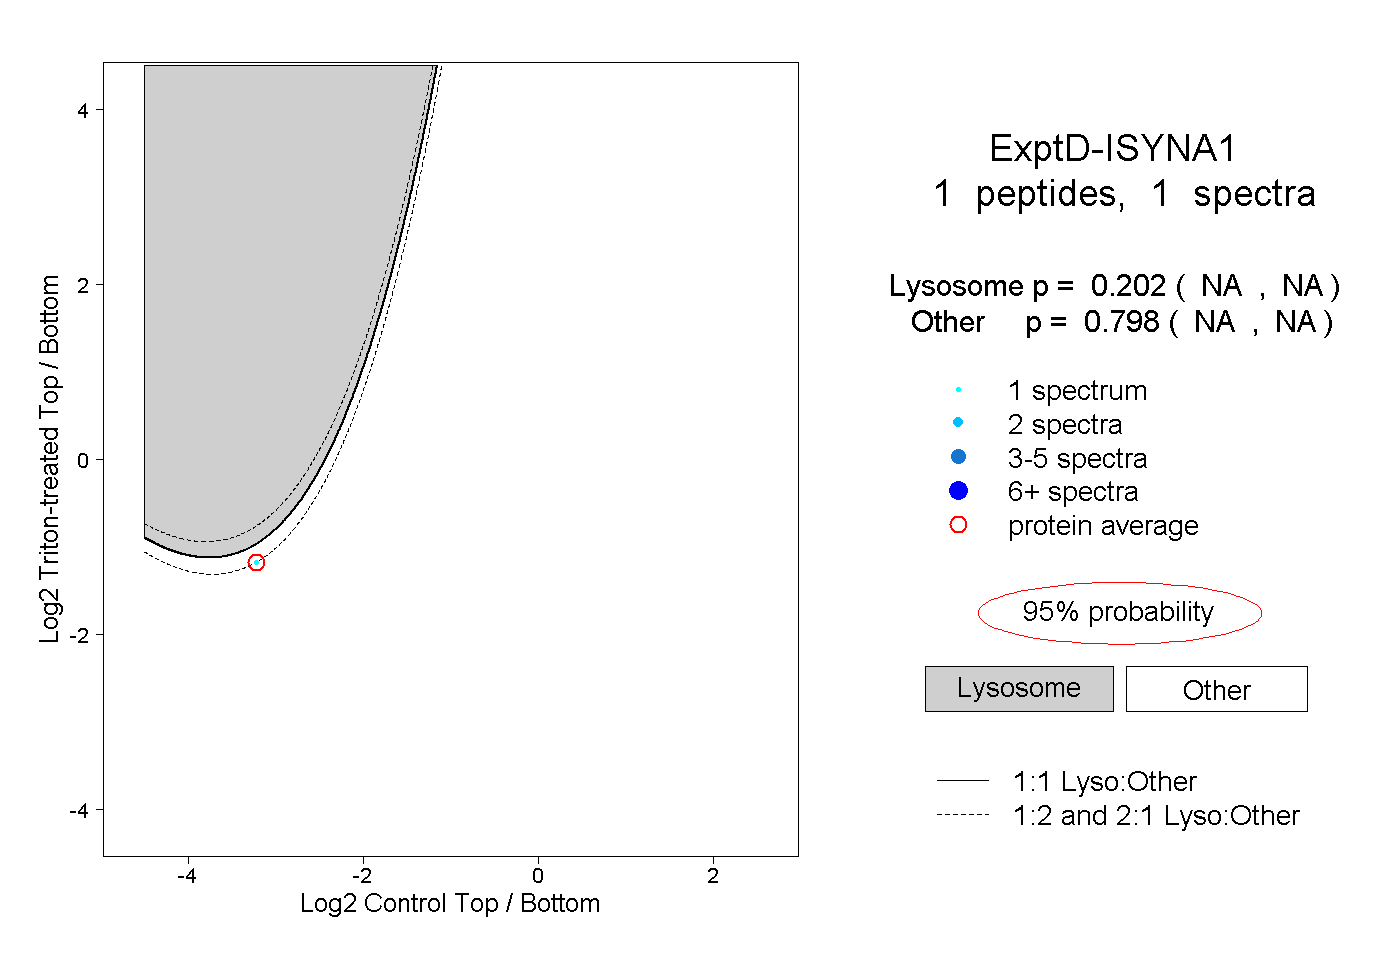 |
0.202 NA | NA |
0.798 NA | NA |