 28
28peptides
spectra
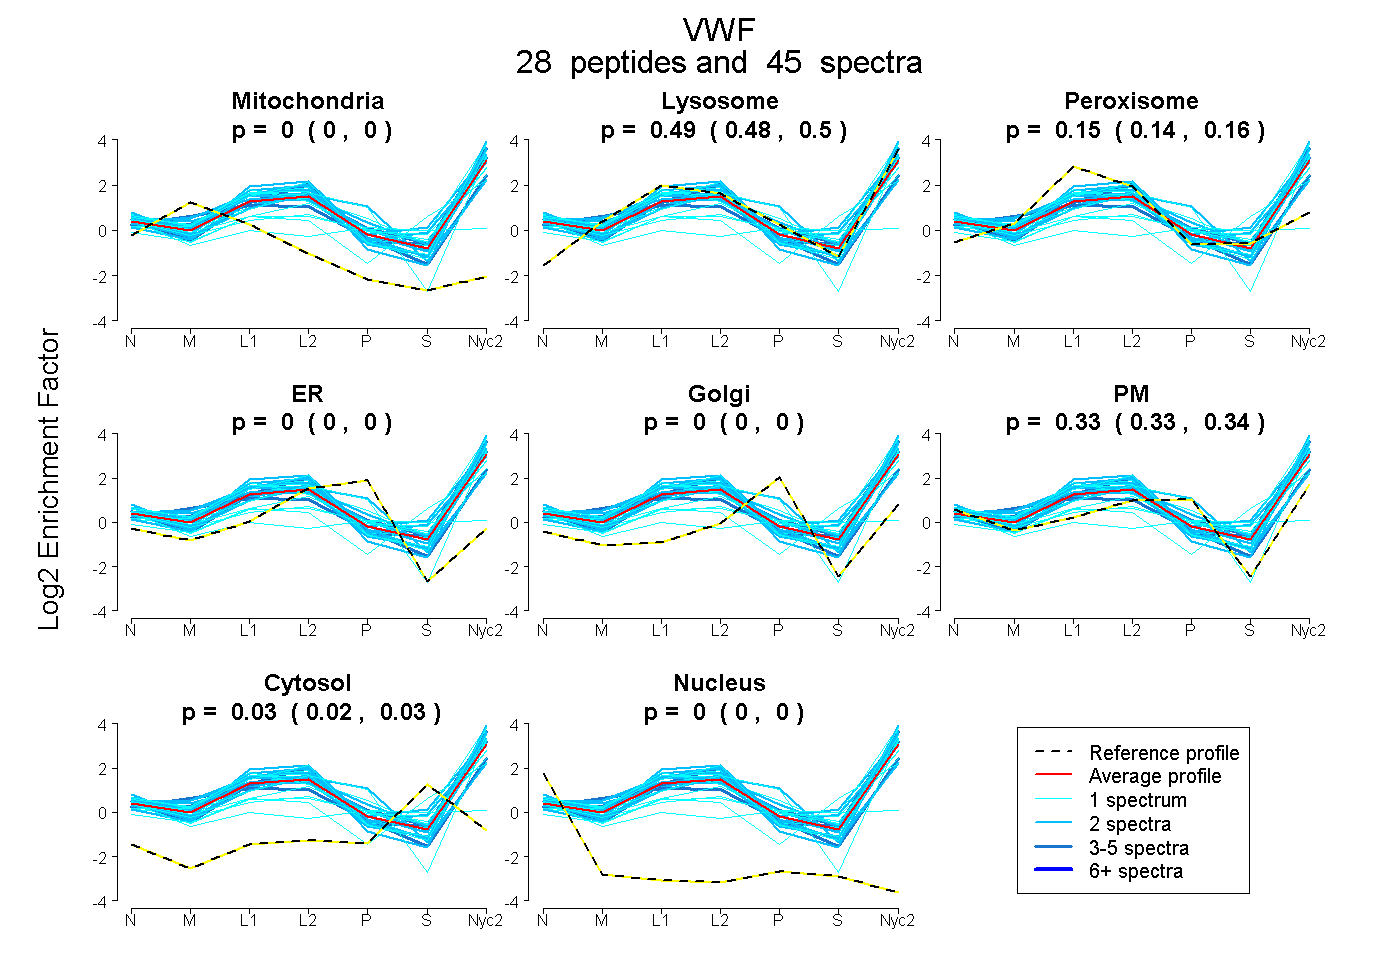
0.000 | 0.000
0.479 | 0.502
0.138 | 0.158
0.000 | 0.000
0.000 | 0.000
0.326 | 0.340
0.021 | 0.029
0.000 | 0.000
5peptides
spectra
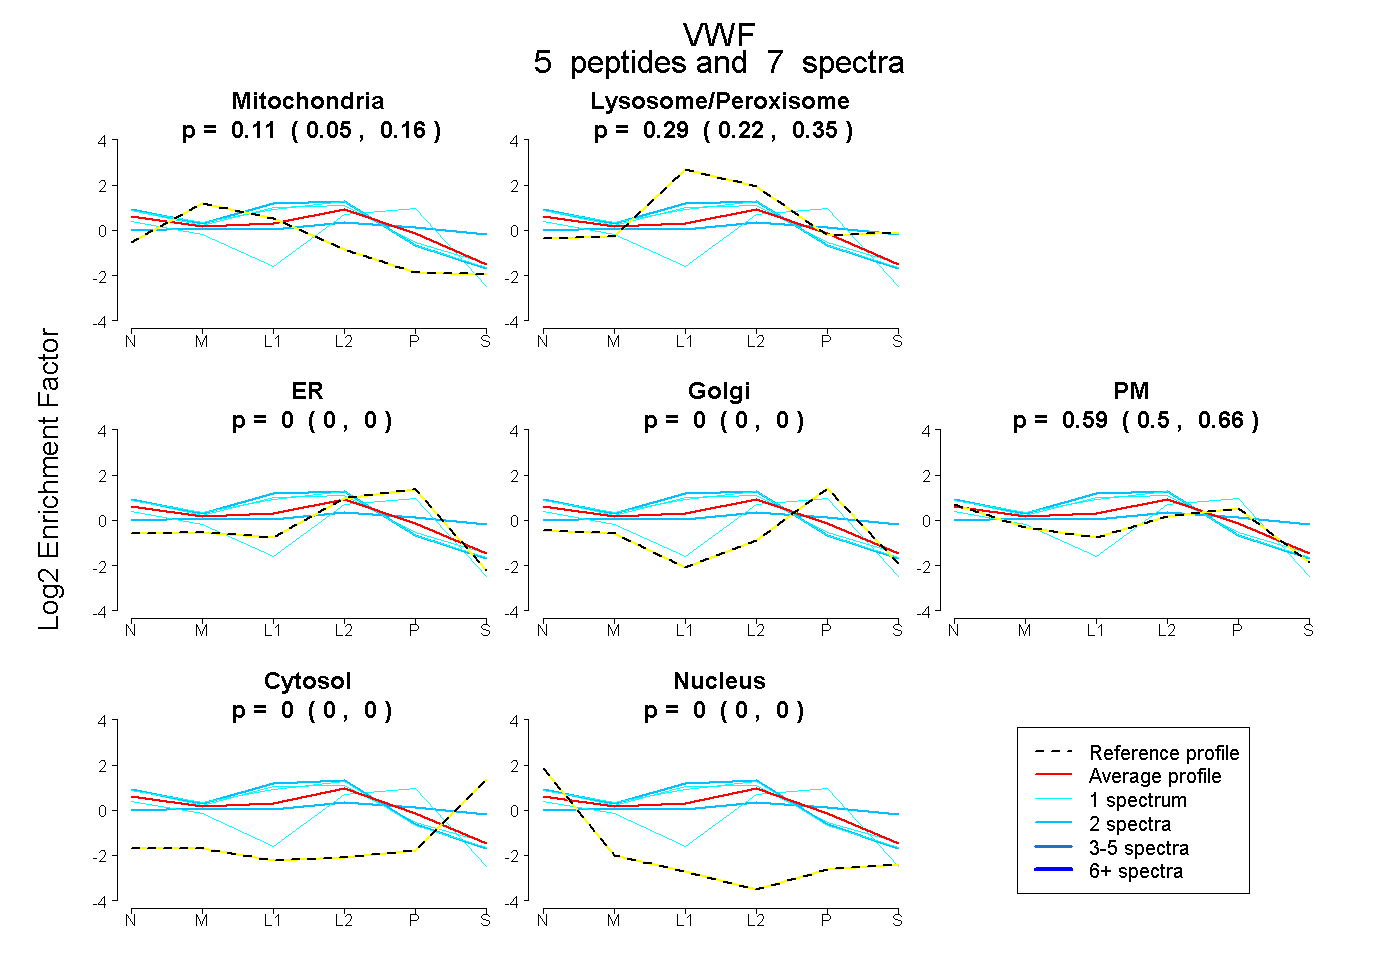
0.054 | 0.160
0.224 | 0.353
0.000 | 0.000
0.000 | 0.000
0.503 | 0.663
0.000 | 0.000
0.000 | 0.000
34peptides
spectra
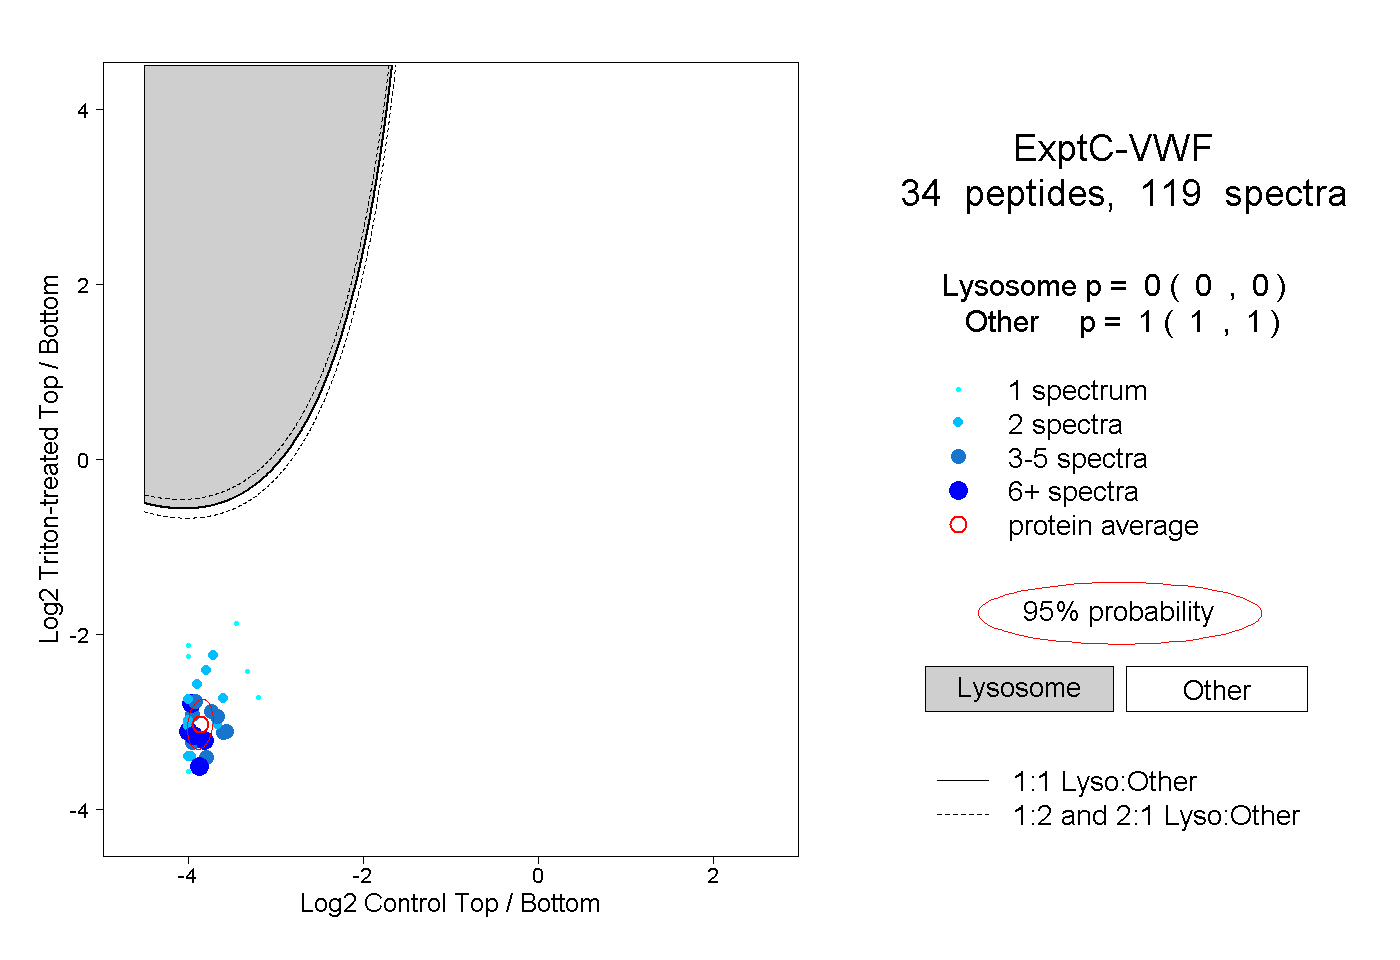
0.000 | 0.000
1.000 | 1.000
9peptides
spectra
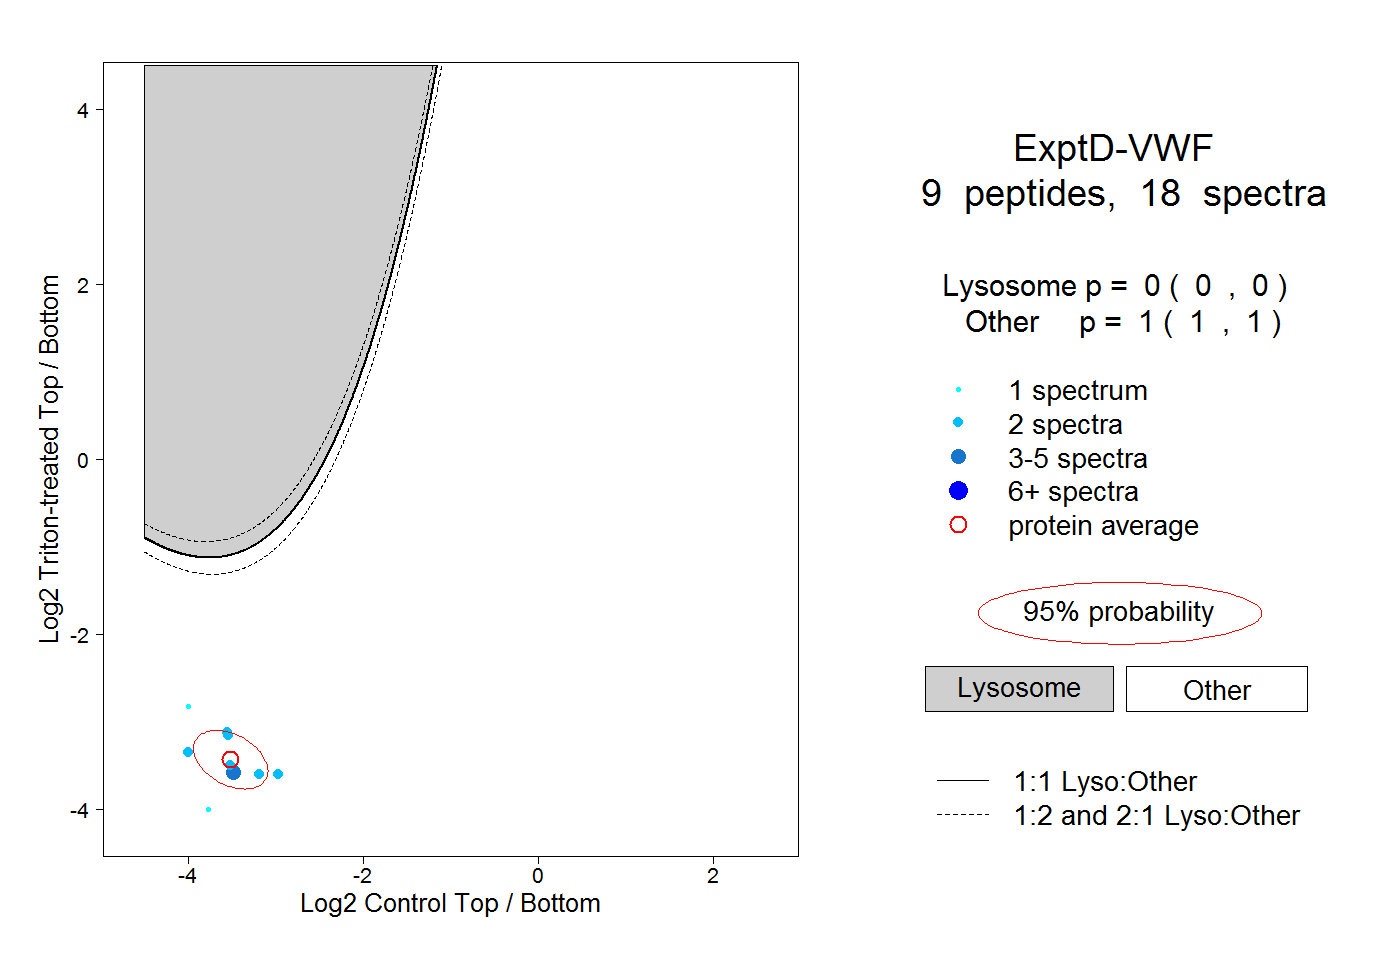
0.000 | 0.000
1.000 | 1.000