 28
28peptides
spectra
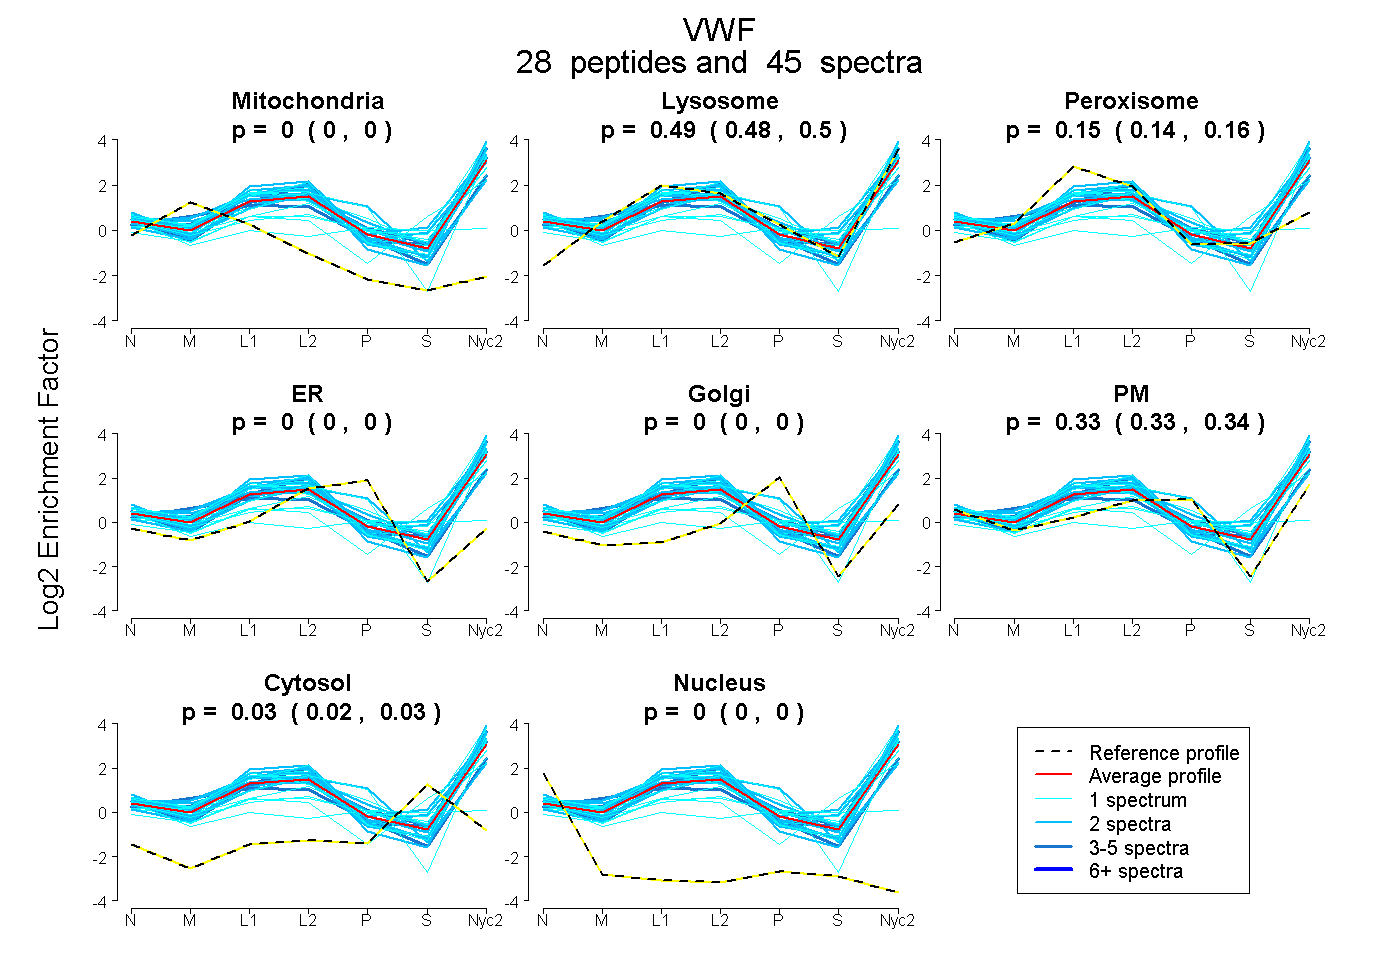
0.000 | 0.000
0.479 | 0.502
0.138 | 0.158
0.000 | 0.000
0.000 | 0.000
0.326 | 0.340
0.021 | 0.029
0.000 | 0.000
| Plot | Mito | Lyso | Perox | ER | Golgi | PM | Cytosol | Nucleus | |||||
| Expt A |
28 peptides |
45 spectra |
|
0.000 0.000 | 0.000 |
0.491 0.479 | 0.502 |
0.149 0.138 | 0.158 |
0.000 0.000 | 0.000 |
0.000 0.000 | 0.000 |
0.333 0.326 | 0.340 |
0.026 0.021 | 0.029 |
0.000 0.000 | 0.000 |
| 1 spectrum, VSPQCADTR | 0.000 | 0.448 | 0.166 | 0.000 | 0.000 | 0.000 | 0.383 | 0.003 | ||
| 2 spectra, AFVVGTMER | 0.000 | 0.664 | 0.050 | 0.000 | 0.000 | 0.286 | 0.000 | 0.000 | ||
| 1 spectrum, EFLEEVIQR | 0.000 | 0.694 | 0.117 | 0.000 | 0.000 | 0.190 | 0.000 | 0.000 | ||
| 1 spectrum, ANLQELER | 0.000 | 0.384 | 0.043 | 0.000 | 0.000 | 0.332 | 0.241 | 0.000 | ||
| 1 spectrum, YTLFQIFGK | 0.000 | 0.334 | 0.000 | 0.000 | 0.000 | 0.666 | 0.000 | 0.000 | ||
| 2 spectra, CLPTACTIQLR | 0.000 | 0.233 | 0.346 | 0.000 | 0.000 | 0.407 | 0.000 | 0.014 | ||
| 2 spectra, QTMVDSSCR | 0.000 | 0.506 | 0.189 | 0.000 | 0.000 | 0.186 | 0.120 | 0.000 | ||
| 2 spectra, LVCPADNPR | 0.000 | 0.595 | 0.149 | 0.000 | 0.000 | 0.256 | 0.000 | 0.000 | ||
| 1 spectrum, TTCEACPVGYR | 0.000 | 0.451 | 0.035 | 0.000 | 0.000 | 0.382 | 0.132 | 0.000 | ||
| 3 spectra, HIVTFDGQNFK | 0.132 | 0.441 | 0.075 | 0.000 | 0.000 | 0.352 | 0.000 | 0.000 | ||
| 3 spectra, APTCGPCEVAR | 0.000 | 0.682 | 0.107 | 0.000 | 0.000 | 0.212 | 0.000 | 0.000 | ||
| 2 spectra, SLSCRPPMVK | 0.000 | 0.567 | 0.170 | 0.000 | 0.000 | 0.234 | 0.000 | 0.029 | ||
| 2 spectra, ISRPIAPIFIQDFETLPR | 0.000 | 0.711 | 0.056 | 0.000 | 0.000 | 0.234 | 0.000 | 0.000 | ||
| 2 spectra, ENSYECEWR | 0.000 | 0.622 | 0.120 | 0.000 | 0.000 | 0.257 | 0.000 | 0.000 | ||
| 1 spectrum, SQSECCGR | 0.000 | 0.542 | 0.149 | 0.000 | 0.000 | 0.309 | 0.000 | 0.000 | ||
| 1 spectrum, LPGDIQVVPIGVGSR | 0.000 | 0.742 | 0.071 | 0.000 | 0.000 | 0.109 | 0.078 | 0.000 | ||
| 1 spectrum, GEYIWEK | 0.000 | 0.567 | 0.068 | 0.000 | 0.000 | 0.337 | 0.029 | 0.000 | ||
| 1 spectrum, VILLLTASQEPQR | 0.010 | 0.000 | 0.184 | 0.000 | 0.000 | 0.383 | 0.377 | 0.046 | ||
| 1 spectrum, VEDAVFVQQR | 0.000 | 0.389 | 0.027 | 0.000 | 0.000 | 0.367 | 0.217 | 0.000 | ||
| 2 spectra, QDETFQDGCDSHLCR | 0.000 | 0.250 | 0.111 | 0.000 | 0.000 | 0.639 | 0.000 | 0.000 | ||
| 1 spectrum, VILIPVGIGPHANLK | 0.000 | 0.675 | 0.084 | 0.000 | 0.000 | 0.241 | 0.000 | 0.000 | ||
| 1 spectrum, AQGLECAK | 0.000 | 0.604 | 0.037 | 0.000 | 0.000 | 0.320 | 0.039 | 0.000 | ||
| 1 spectrum, YDEAQLR | 0.000 | 0.467 | 0.292 | 0.000 | 0.000 | 0.213 | 0.029 | 0.000 | ||
| 3 spectra, AFLLSGVDELEQR | 0.000 | 0.521 | 0.080 | 0.000 | 0.000 | 0.345 | 0.054 | 0.000 | ||
| 2 spectra, HAGLSVELR | 0.000 | 0.669 | 0.098 | 0.000 | 0.000 | 0.114 | 0.119 | 0.000 | ||
| 2 spectra, LSEAEFEVLK | 0.000 | 0.653 | 0.088 | 0.000 | 0.000 | 0.260 | 0.000 | 0.000 | ||
| 2 spectra, SEEEVDIHYCQGK | 0.000 | 0.660 | 0.038 | 0.000 | 0.000 | 0.302 | 0.000 | 0.000 | ||
| 1 spectrum, KPTLCPQSCEER | 0.000 | 0.480 | 0.198 | 0.000 | 0.000 | 0.322 | 0.000 | 0.000 |
| Plot | Mito | Lyso or Perox | ER | Golgi | PM | Cytosol | Nucleus | ||||||
| Expt B |
5 peptides |
7 spectra |
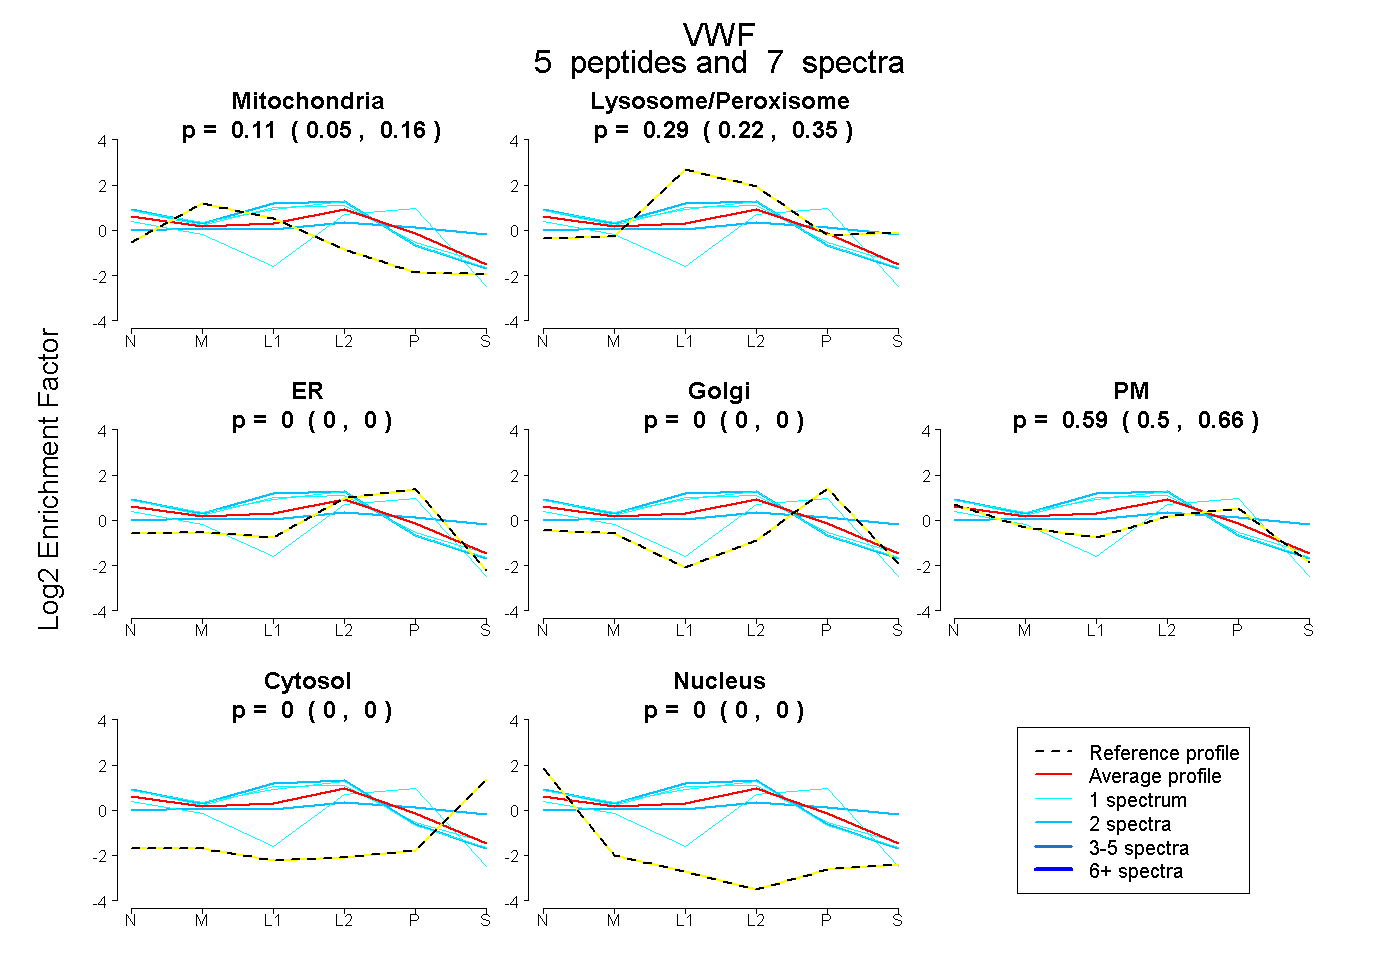 |
0.113 0.054 | 0.160 |
0.293 0.224 | 0.353 |
0.000 0.000 | 0.000 |
0.000 0.000 | 0.000 |
0.594 0.503 | 0.663 |
0.000 0.000 | 0.000 |
0.000 0.000 | 0.000 |
|||
| Plot | Lyso | Other | |||||||||||
| Expt C |
34 peptides |
119 spectra |
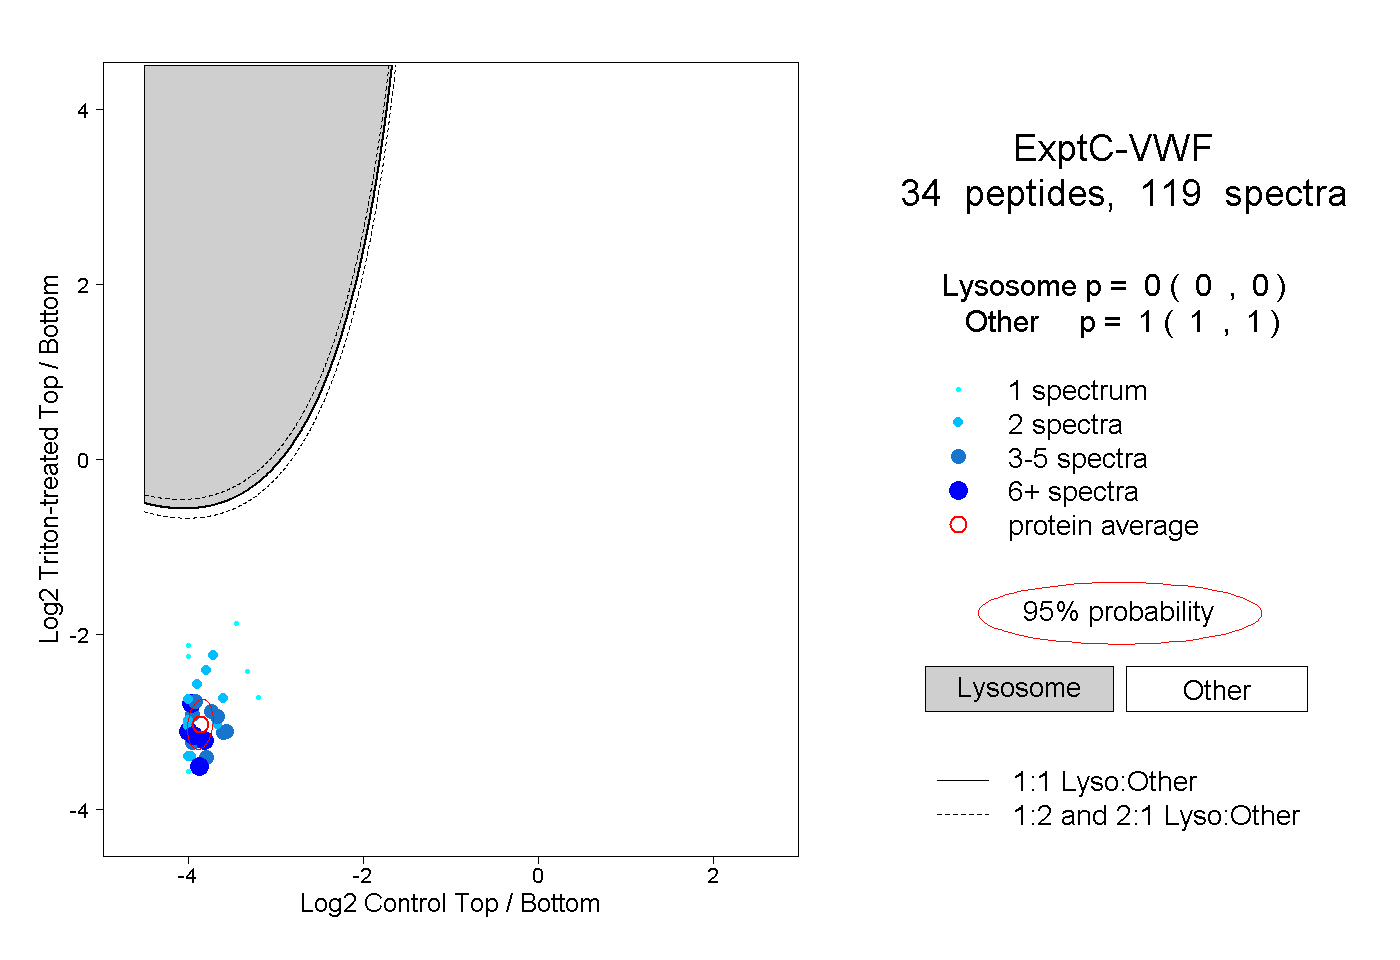 |
0.000 0.000 | 0.000 |
1.000 1.000 | 1.000 |
||||||||
| Plot | Lyso | Other | |||||||||||
| Expt D |
9 peptides |
18 spectra |
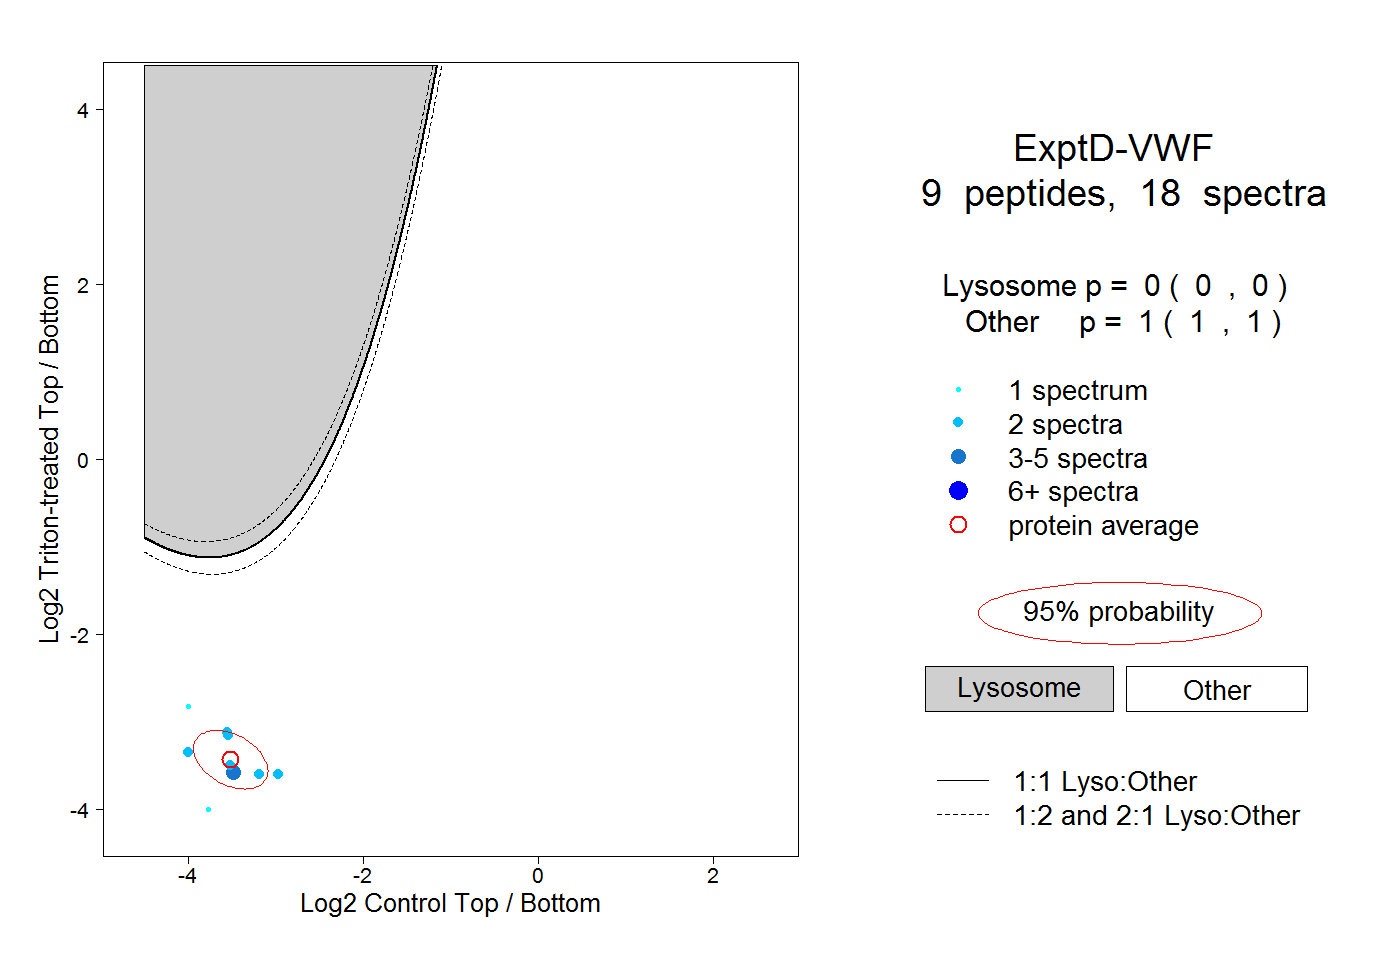 |
0.000 0.000 | 0.000 |
1.000 1.000 | 1.000 |