VWF
[ENSRNOP00000026643]
Main page
| | | Plot |
Mito |
Lyso |
|
Perox |
ER |
Golgi |
PM |
Cytosol |
Nucleus |
|
| Expt A |
 28
28
peptides |
45
spectra |
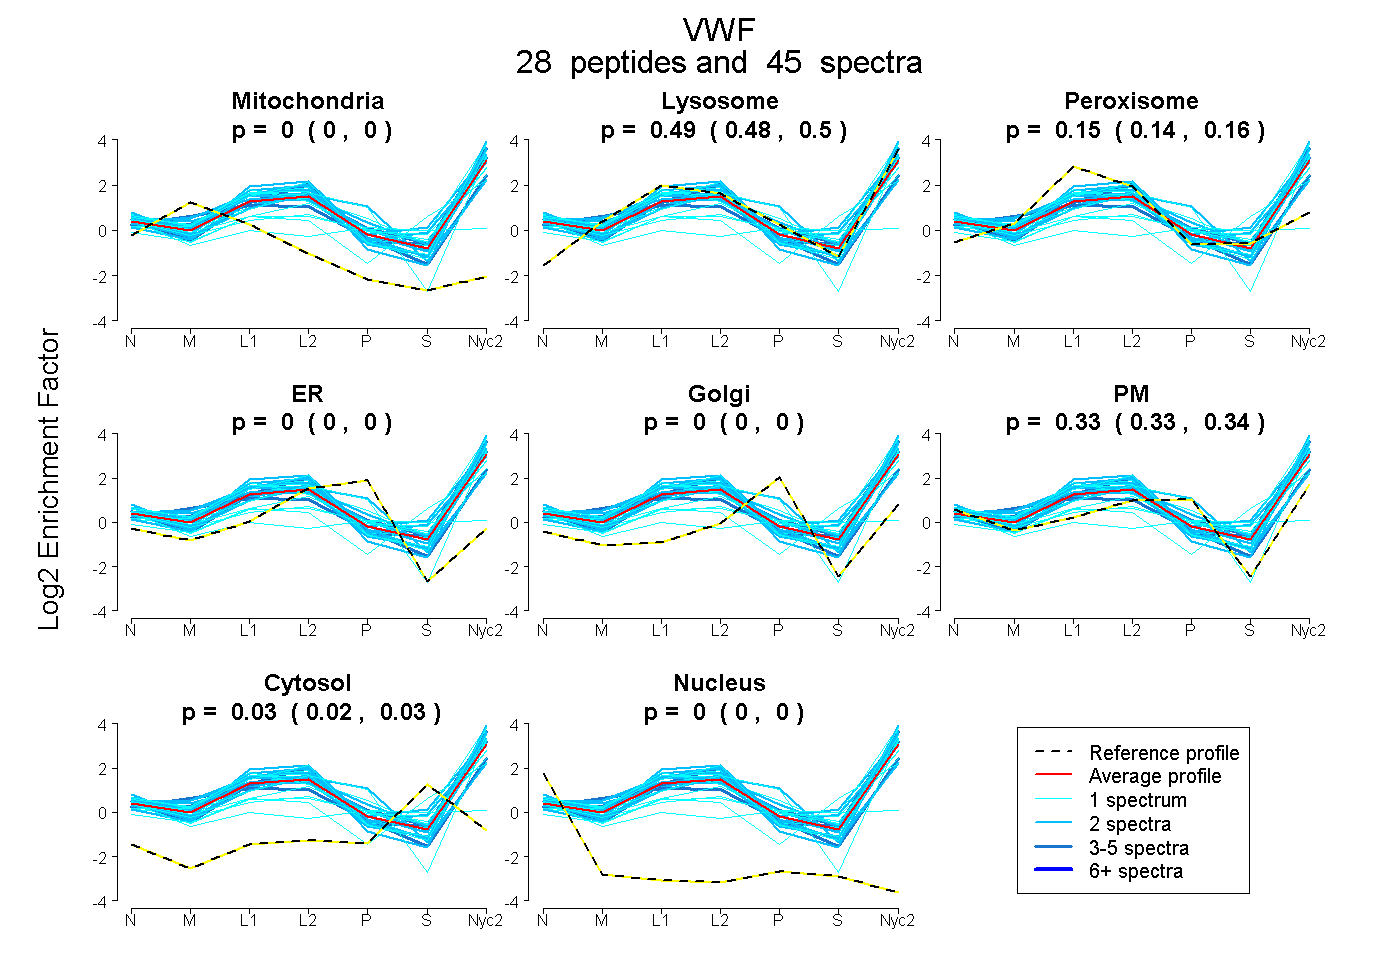 |
0.000
0.000 | 0.000 |
0.491
0.479 | 0.502 |
|
0.149
0.138 | 0.158 |
0.000
0.000 | 0.000 |
0.000
0.000 | 0.000 |
0.333
0.326 | 0.340 |
0.026
0.021 | 0.029 |
0.000
0.000 | 0.000 |
|
| | | Plot |
Mito |
|
Lyso or Perox |
|
ER |
Golgi |
PM |
Cytosol |
Nucleus |
|
| Expt B |
5
peptides |
7
spectra |
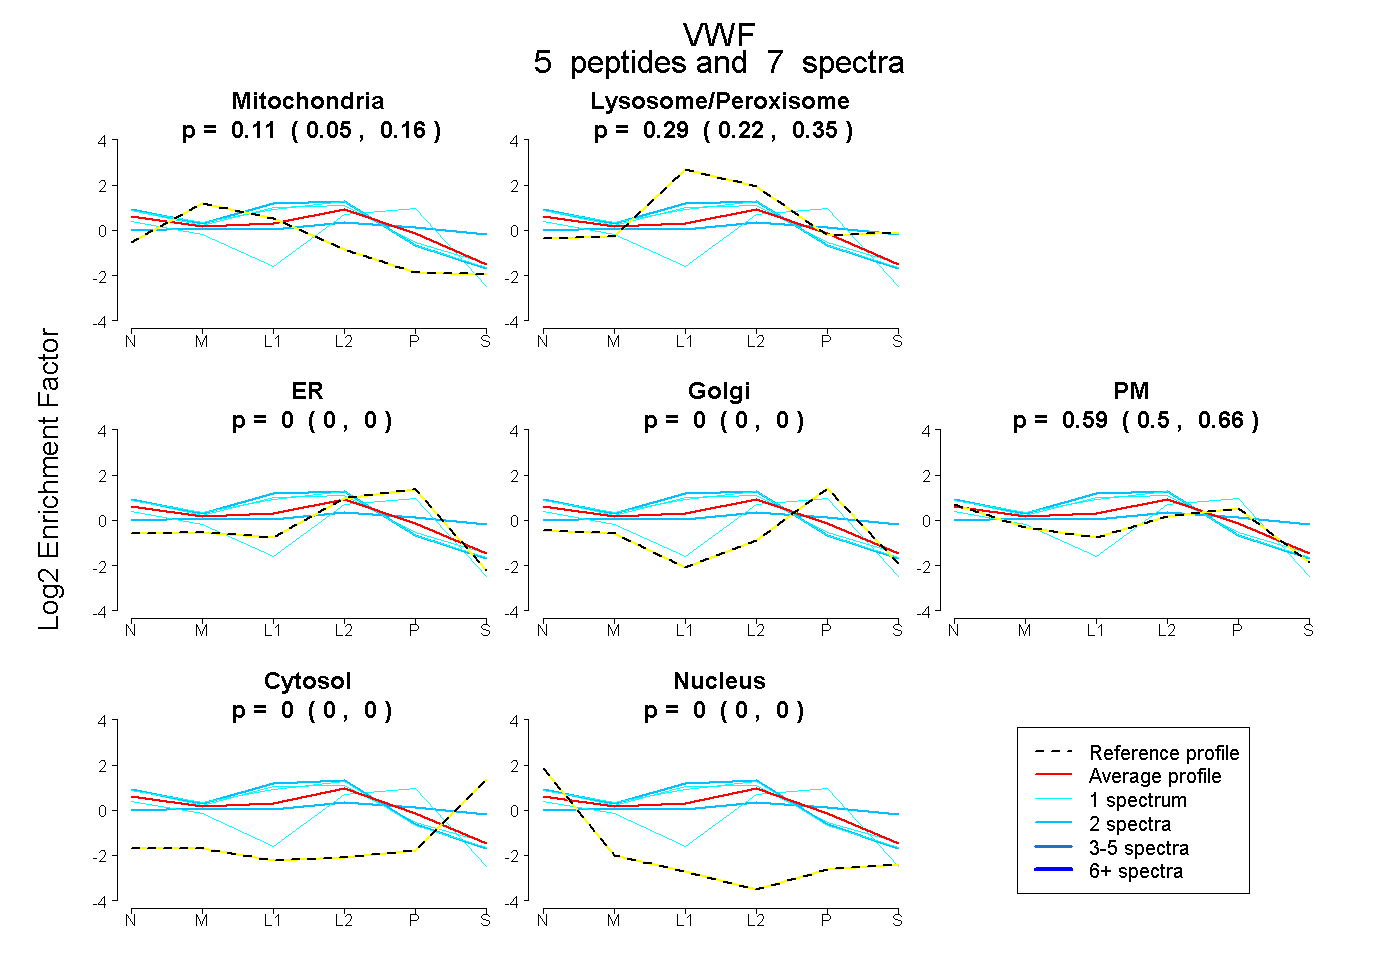 |
0.113
0.054 | 0.160 |
|
0.293
0.224 | 0.353 |
|
0.000
0.000 | 0.000 |
0.000
0.000 | 0.000 |
0.594
0.503 | 0.663 |
0.000
0.000 | 0.000 |
0.000
0.000 | 0.000 |
|
| 1 spectrum, AFVVGTMER |
0.000 |
|
0.000 |
|
0.373 |
0.142 |
0.485 |
0.000 |
0.000 |
|
| 2 spectra, AFLLSGVDELEQR |
0.013 |
|
0.372 |
|
0.000 |
0.076 |
0.369 |
0.170 |
0.000 |
|
| 1 spectrum, ANLQELER |
0.161 |
|
0.424 |
|
0.000 |
0.000 |
0.407 |
0.000 |
0.008 |
|
| 1 spectrum, LSEAEFEVLK |
0.203 |
|
0.394 |
|
0.000 |
0.000 |
0.403 |
0.000 |
0.000 |
|
| 2 spectra, EAPDLVLR |
0.197 |
|
0.436 |
|
0.000 |
0.000 |
0.368 |
0.000 |
0.000 |
|
| | | Plot |
|
Lyso |
|
|
|
|
|
|
|
Other |
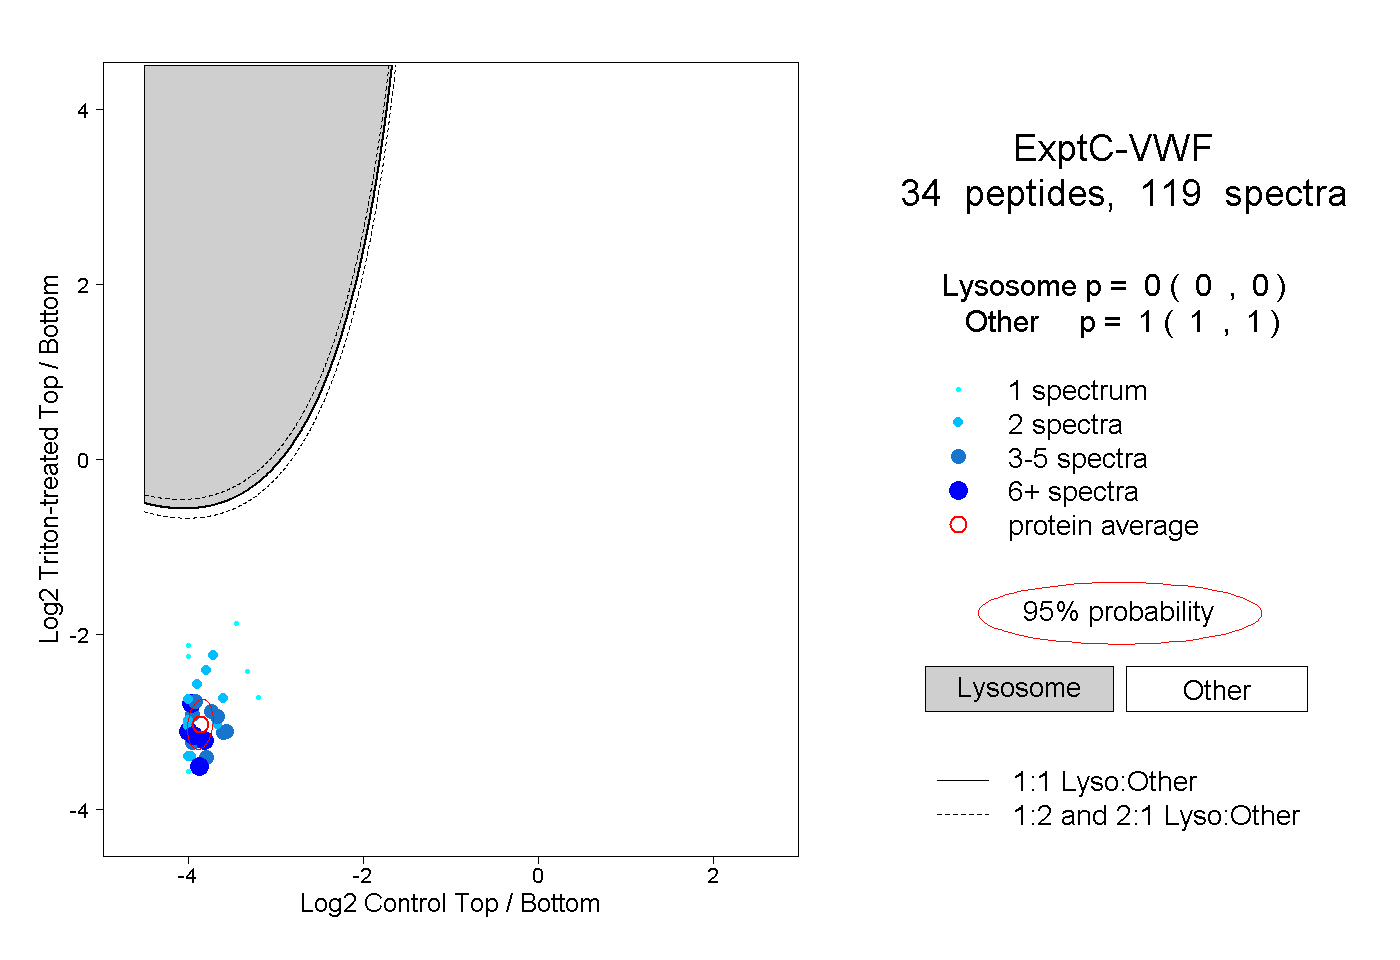
| Expt C |
34
peptides |
119
spectra |
 |
|
0.000
0.000 | 0.000 |
|
|
|
|
|
|
|
1.000
1.000 | 1.000 |
| | | Plot |
|
Lyso |
|
|
|
|
|
|
|
Other |
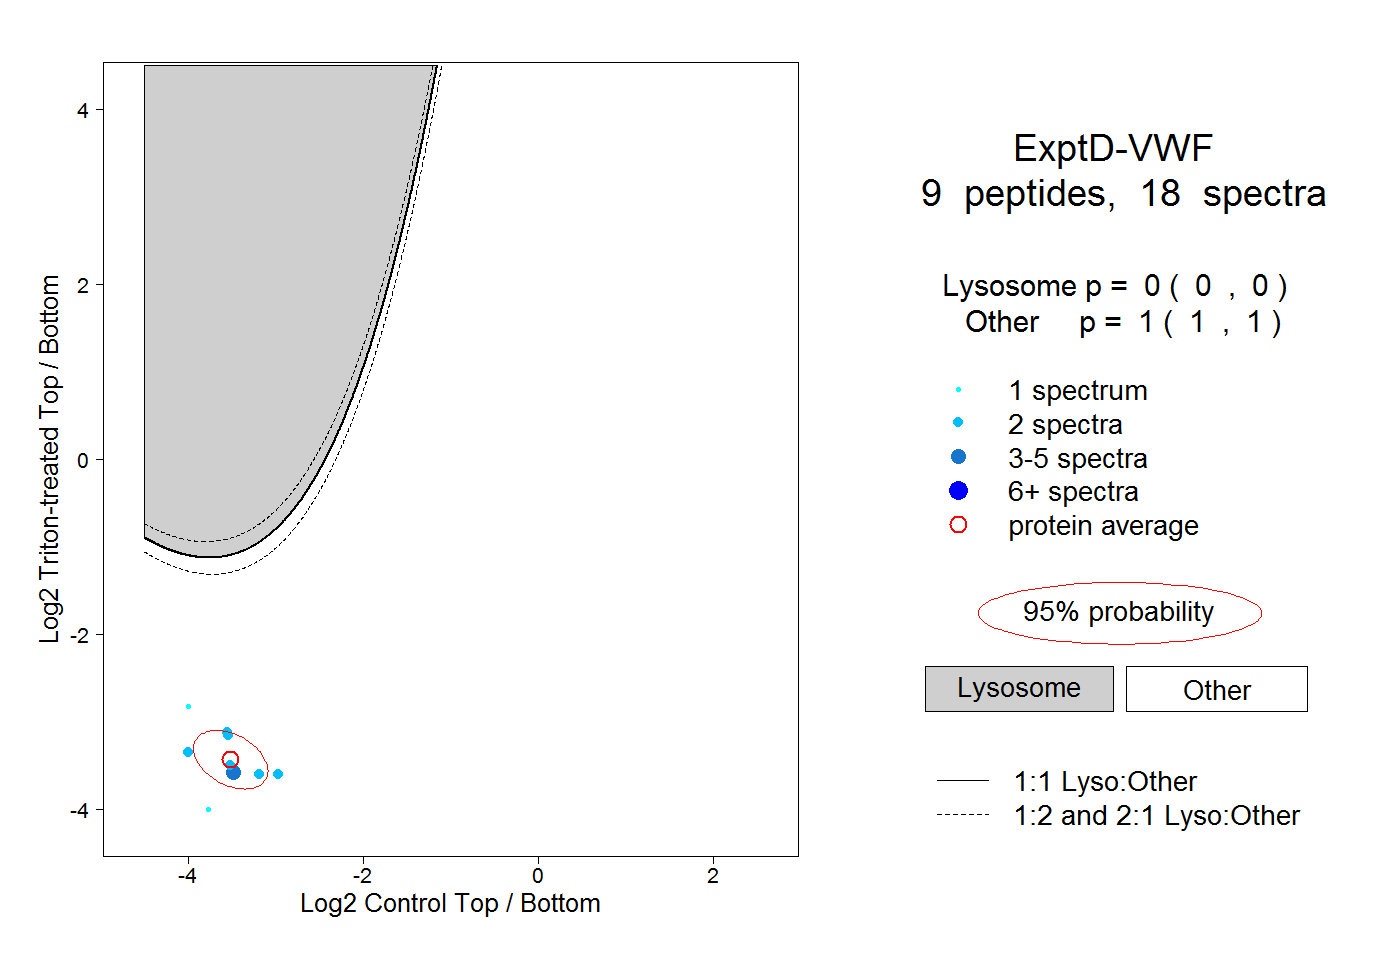
| Expt D |
9
peptides |
18
spectra |
 |
|
0.000
0.000 | 0.000 |
|
|
|
|
|
|
|
1.000
1.000 | 1.000 |