 12
12peptides
spectra
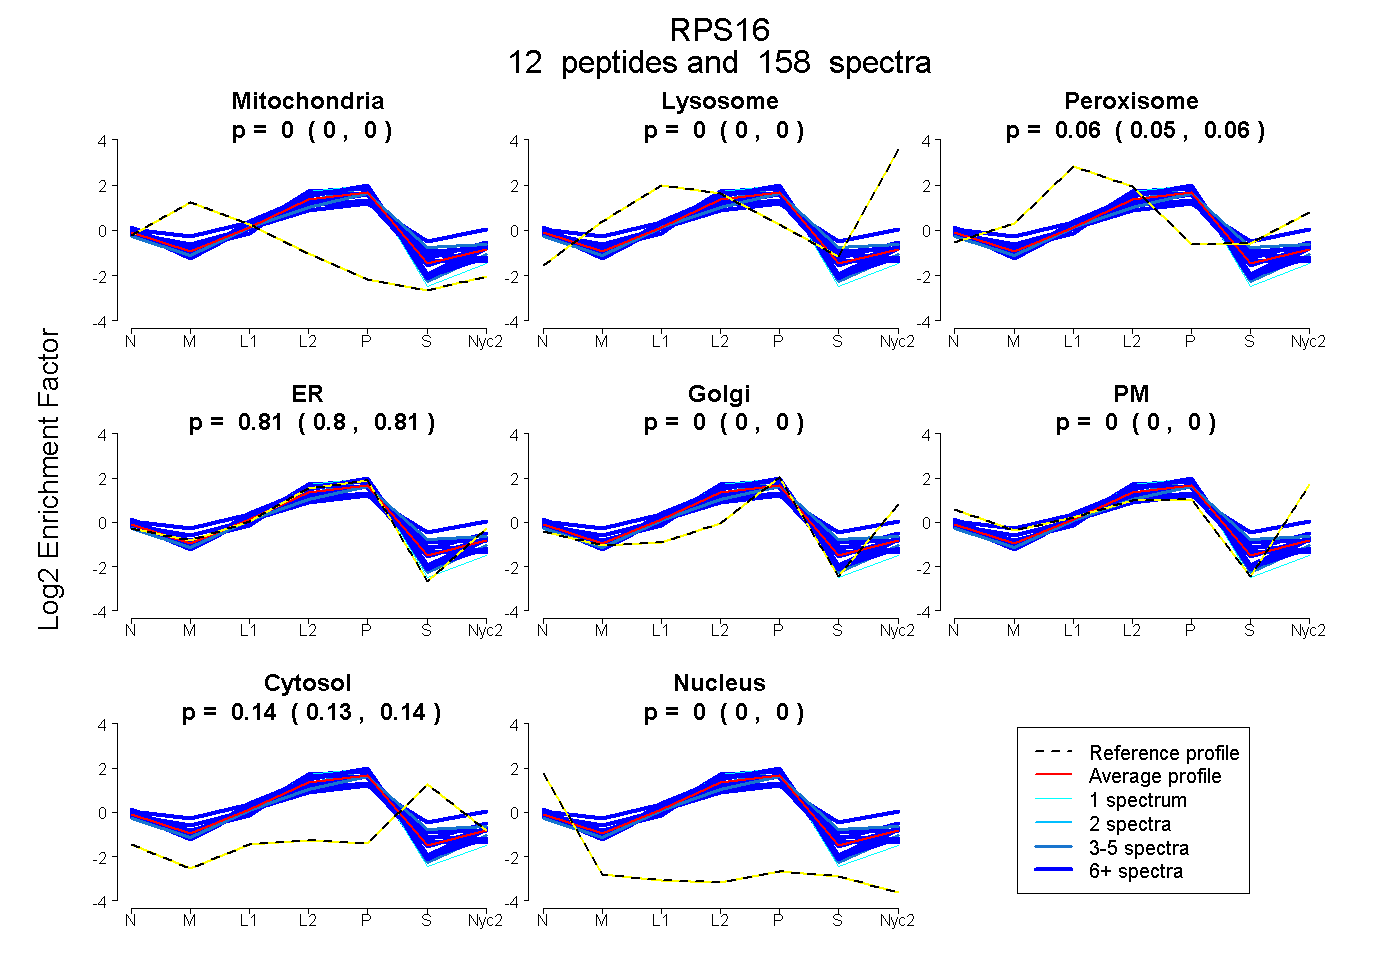
0.000 | 0.000
0.000 | 0.000
0.052 | 0.058
0.803 | 0.812
0.000 | 0.000
0.000 | 0.000
0.134 | 0.139
0.000 | 0.000
10peptides
spectra
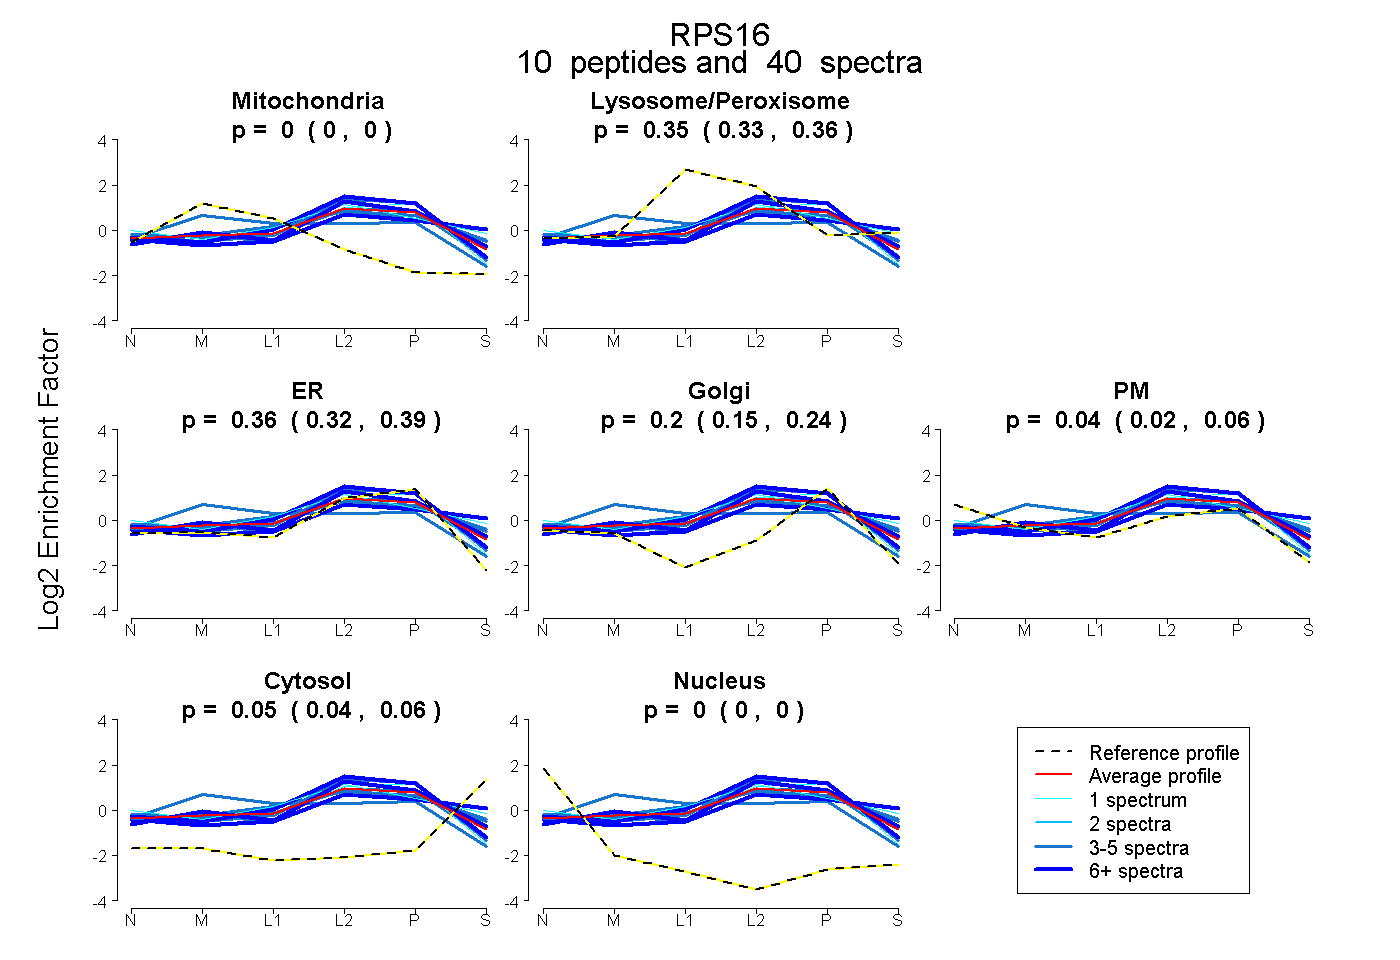
0.000 | 0.000
0.327 | 0.362
0.319 | 0.394
0.151 | 0.238
0.020 | 0.061
0.042 | 0.063
0.000 | 0.000
12peptides
spectra
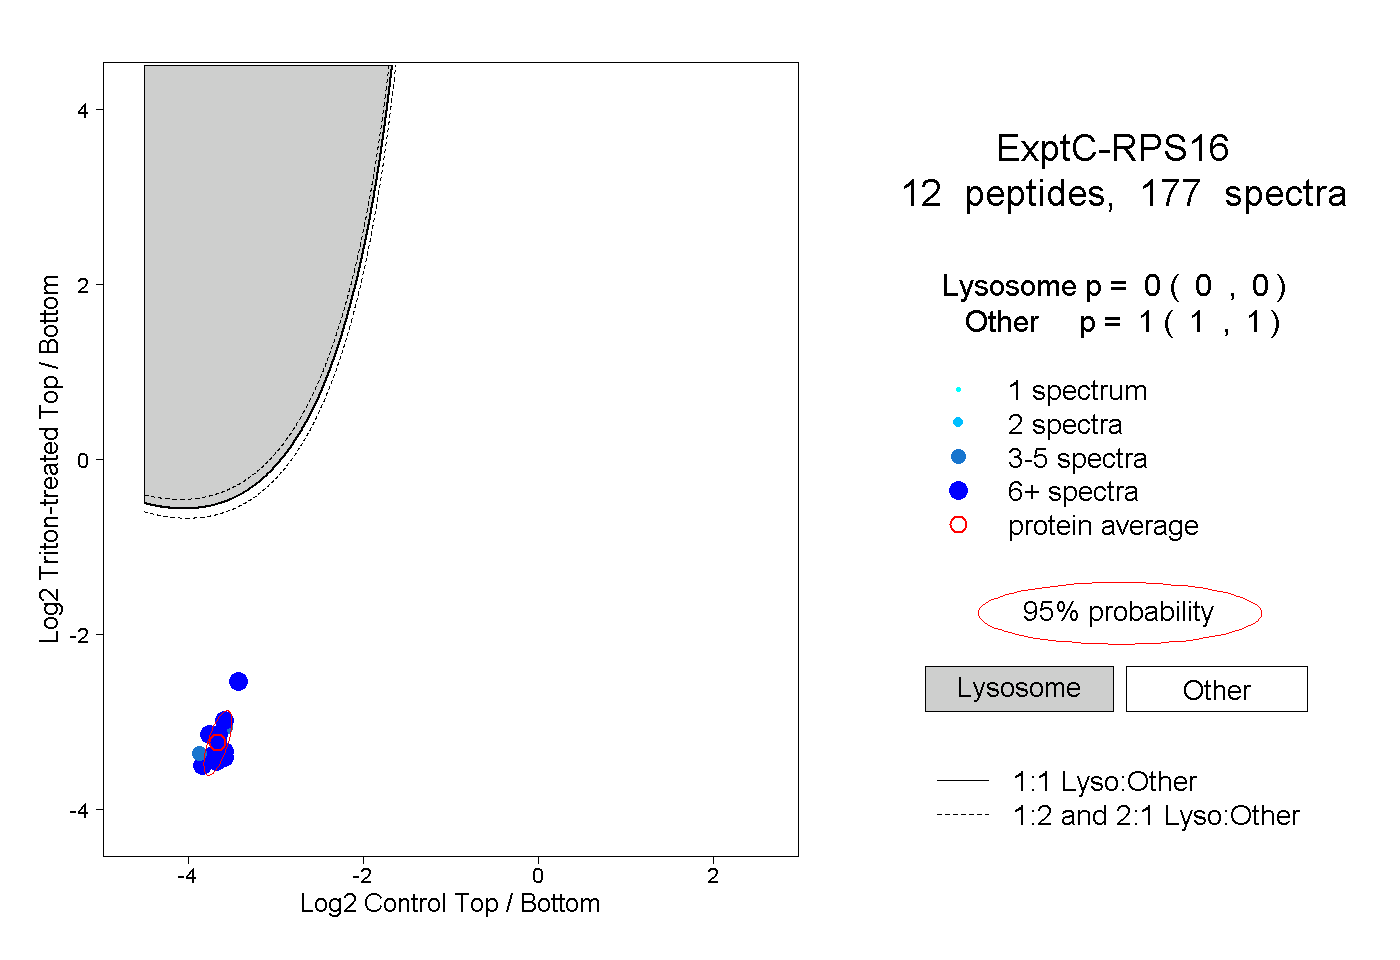
0.000 | 0.000
1.000 | 1.000
6peptides
spectra
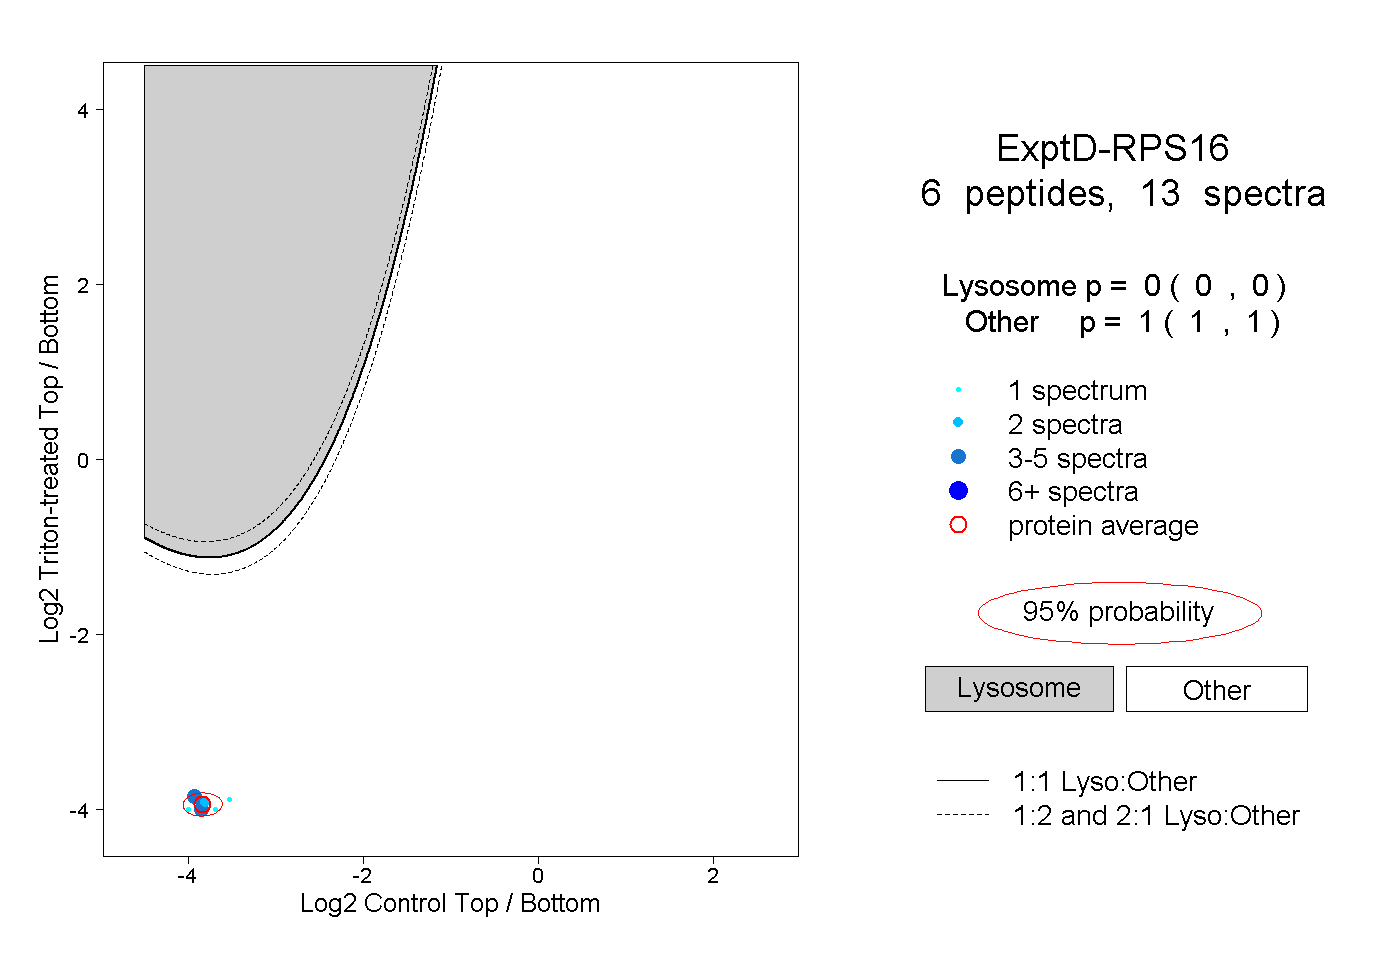
0.000 | 0.000
1.000 | 1.000