RPS16
[ENSRNOP00000026576]
Main page
| | | Plot |
Mito |
Lyso |
|
Perox |
ER |
Golgi |
PM |
Cytosol |
Nucleus |
|
| Expt A |
 12
12
peptides |
158
spectra |
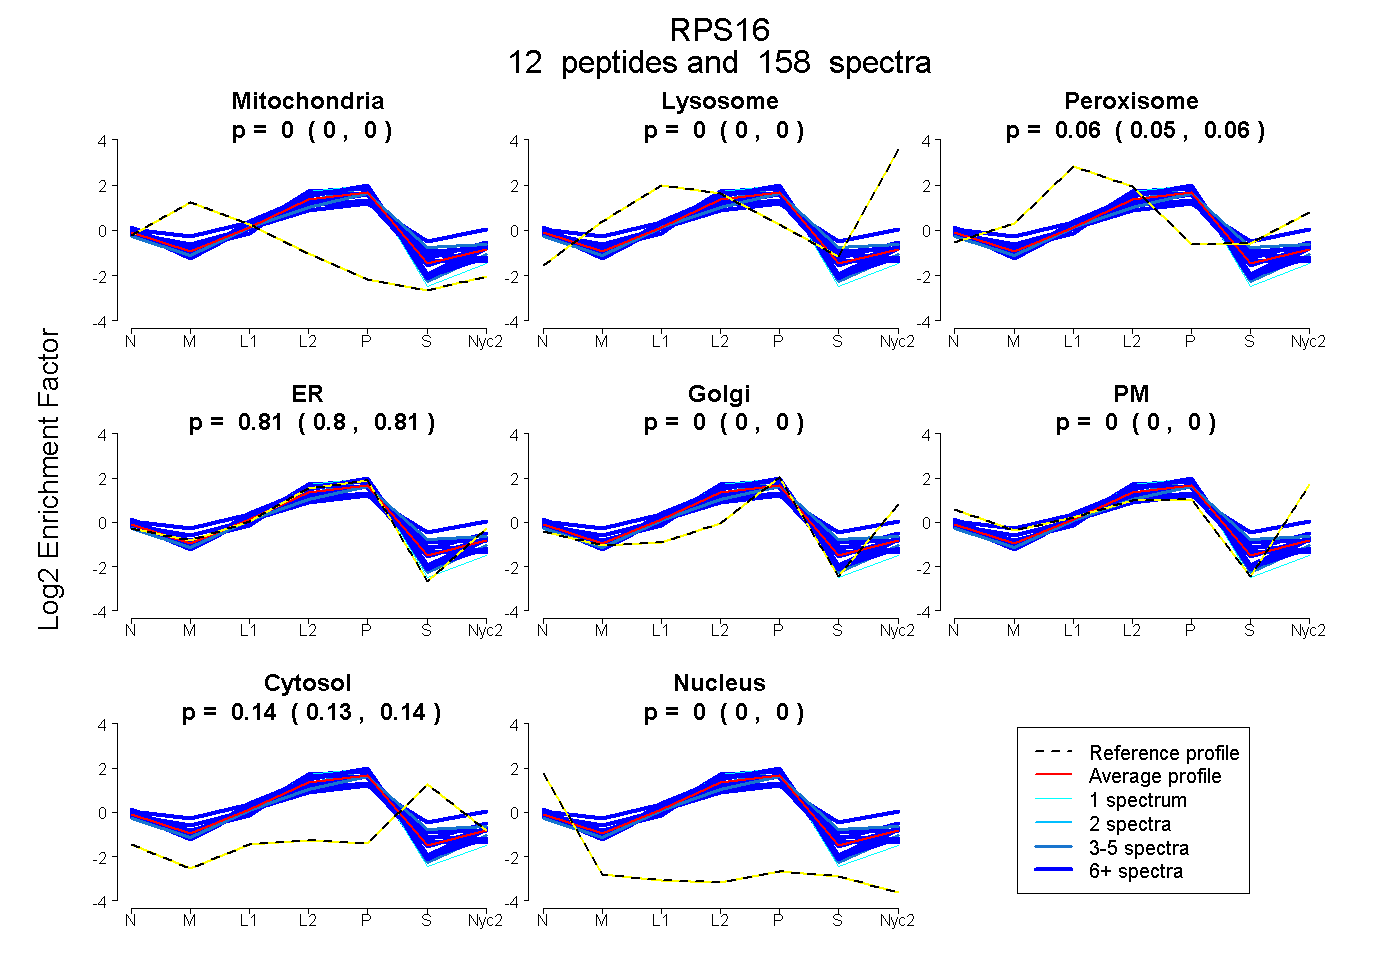 |
0.000
0.000 | 0.000 |
0.000
0.000 | 0.000 |
|
0.055
0.052 | 0.058 |
0.808
0.803 | 0.812 |
0.000
0.000 | 0.000 |
0.000
0.000 | 0.000 |
0.137
0.134 | 0.139 |
0.000
0.000 | 0.000 |
|
| | | Plot |
Mito |
|
Lyso or Perox |
|
ER |
Golgi |
PM |
Cytosol |
Nucleus |
|
| Expt B |
10
peptides |
40
spectra |
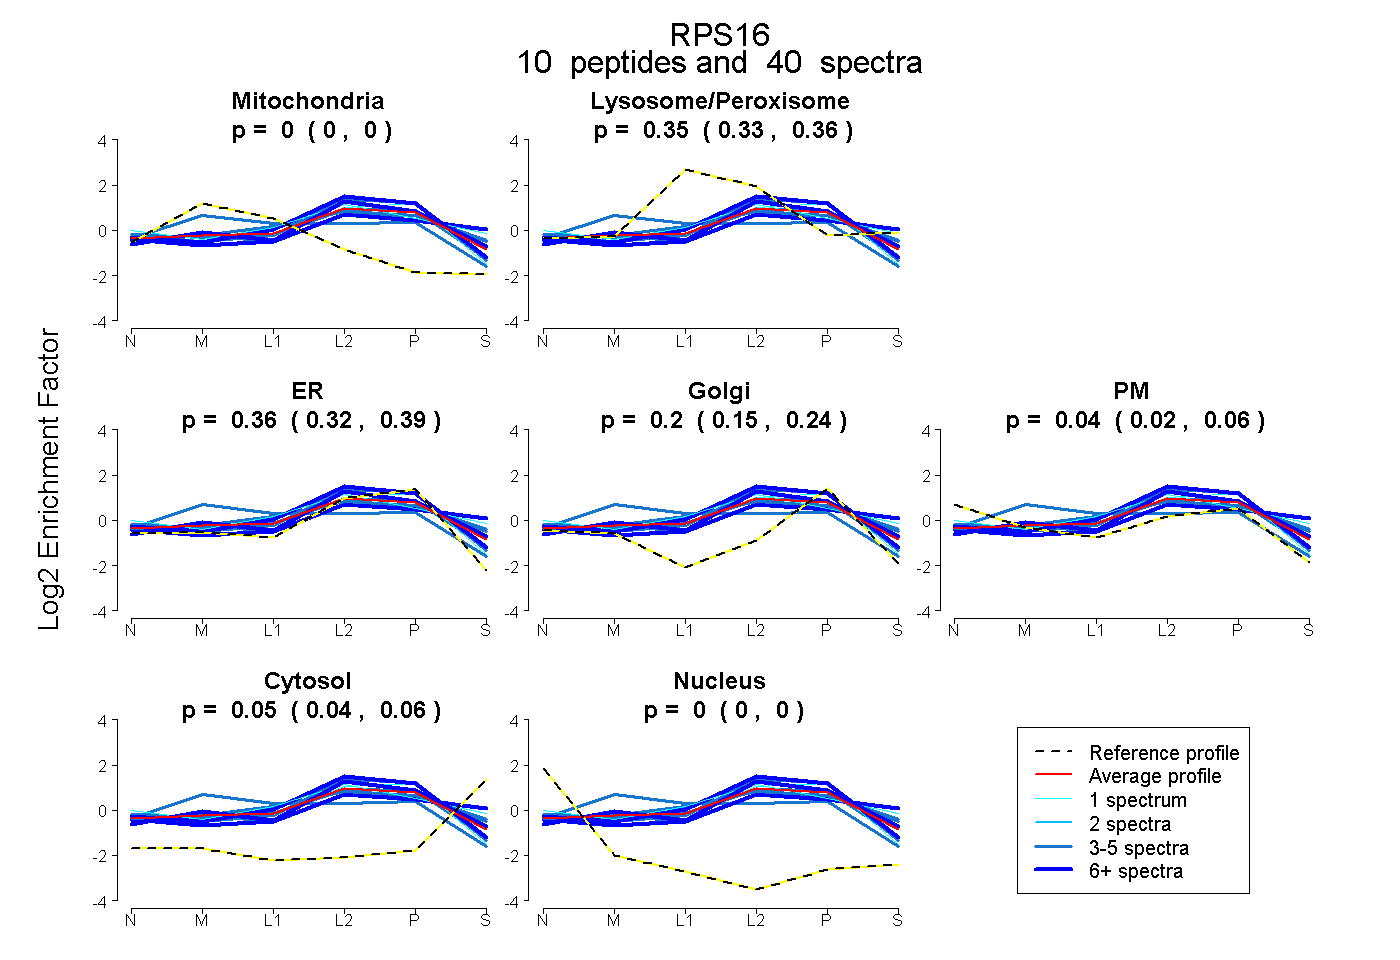 |
0.000
0.000 | 0.000 |
|
0.346
0.327 | 0.362 |
|
0.359
0.319 | 0.394 |
0.200
0.151 | 0.238 |
0.042
0.020 | 0.061 |
0.053
0.042 | 0.063 |
0.000
0.000 | 0.000 |
|
| 3 spectra, ALVAYYQK |
0.000 |
|
0.291 |
|
0.346 |
0.185 |
0.175 |
0.003 |
0.000 |
|
| 5 spectra, GPLQSVQVFGR |
0.000 |
|
0.506 |
|
0.065 |
0.384 |
0.000 |
0.045 |
0.000 |
|
| 1 spectrum, TATAVAHCK |
0.000 |
|
0.432 |
|
0.179 |
0.044 |
0.227 |
0.118 |
0.000 |
|
| 8 spectra, LLEPVLLLGK |
0.000 |
|
0.286 |
|
0.714 |
0.000 |
0.000 |
0.000 |
0.000 |
|
| 6 spectra, GGGHVAQIYAIR |
0.000 |
|
0.327 |
|
0.297 |
0.106 |
0.021 |
0.249 |
0.000 |
|
| 6 spectra, VNGRPLEMIEPR |
0.000 |
|
0.247 |
|
0.640 |
0.000 |
0.000 |
0.113 |
0.000 |
|
| 4 spectra, FGGPGAR |
0.333 |
|
0.184 |
|
0.356 |
0.091 |
0.035 |
0.000 |
0.000 |
|
| 1 spectrum, GNGLIK |
0.000 |
|
0.221 |
|
0.607 |
0.099 |
0.073 |
0.000 |
0.000 |
|
| 3 spectra, DILIQYDR |
0.000 |
|
0.332 |
|
0.268 |
0.264 |
0.000 |
0.136 |
0.000 |
|
| 3 spectra, FAGVDIR |
0.000 |
|
0.220 |
|
0.758 |
0.007 |
0.009 |
0.006 |
0.000 |
|
| | | Plot |
|
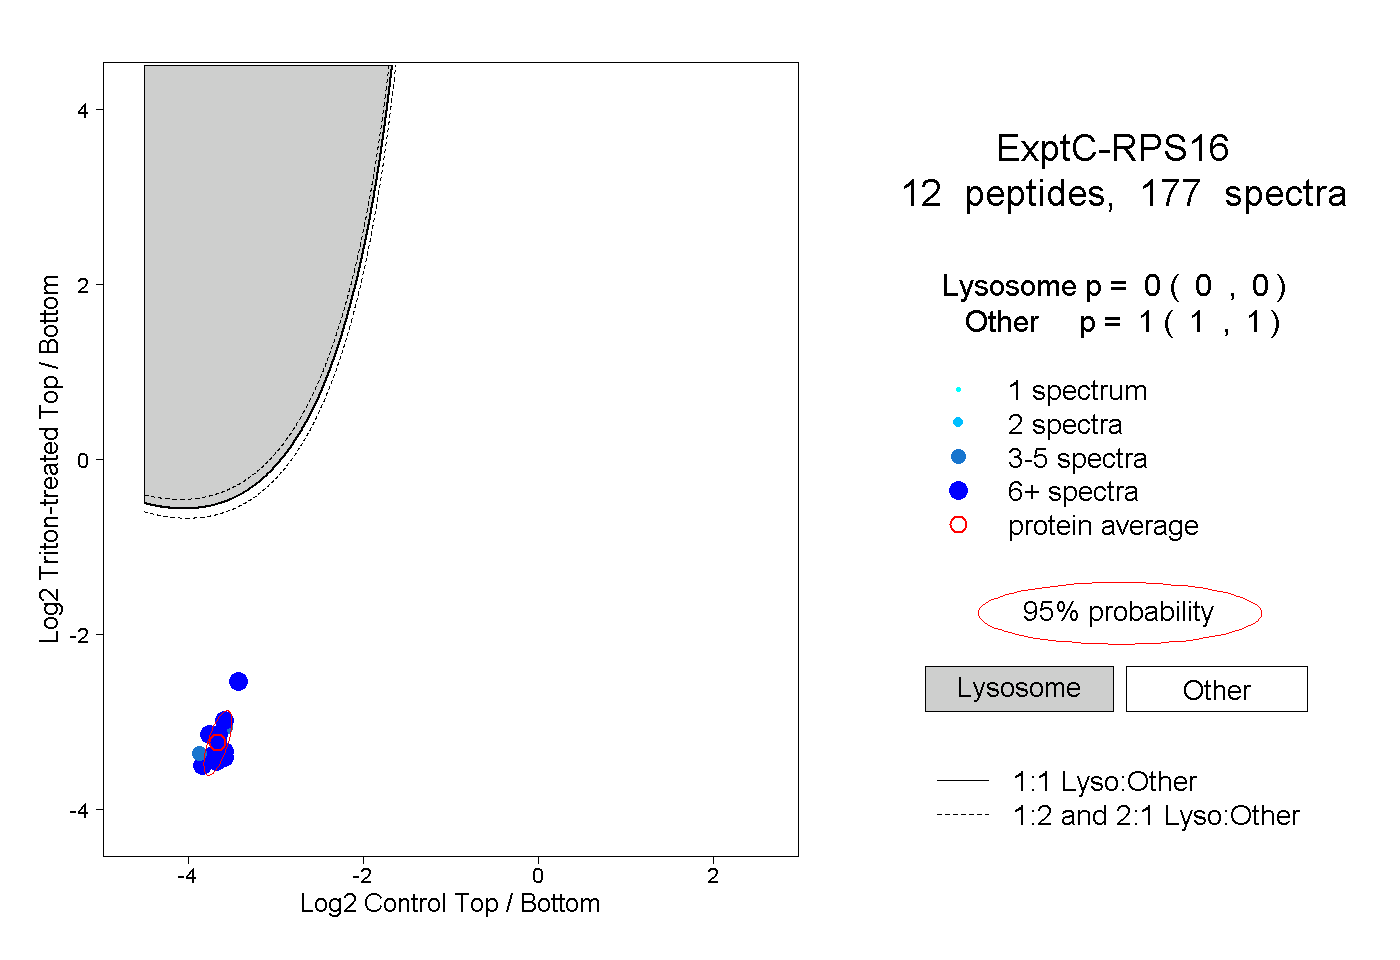
Lyso |
|
|
|
|
|
|
|
Other |
| Expt C |
12
peptides |
177
spectra |
 |
|
0.000
0.000 | 0.000 |
|
|
|
|
|
|
|
1.000
1.000 | 1.000 |
| | | Plot |
|
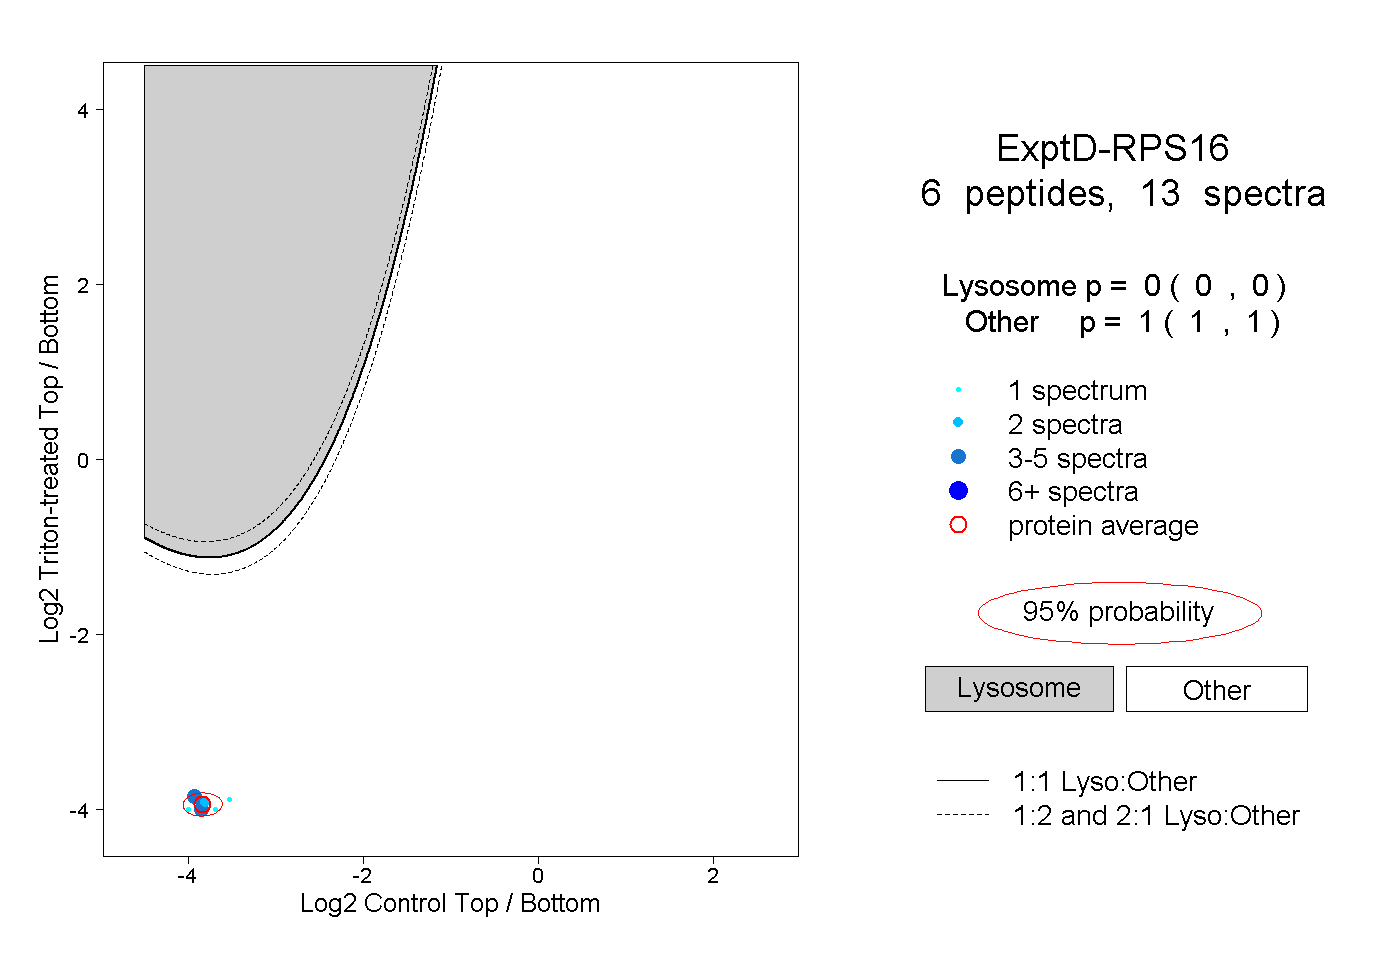
Lyso |
|
|
|
|
|
|
|
Other |
| Expt D |
6
peptides |
13
spectra |
 |
|
0.000
0.000 | 0.000 |
|
|
|
|
|
|
|
1.000
1.000 | 1.000 |