 12
12peptides
spectra
0.000 | 0.000
0.000 | 0.000
0.052 | 0.058
0.803 | 0.812
0.000 | 0.000
0.000 | 0.000
0.134 | 0.139
0.000 | 0.000
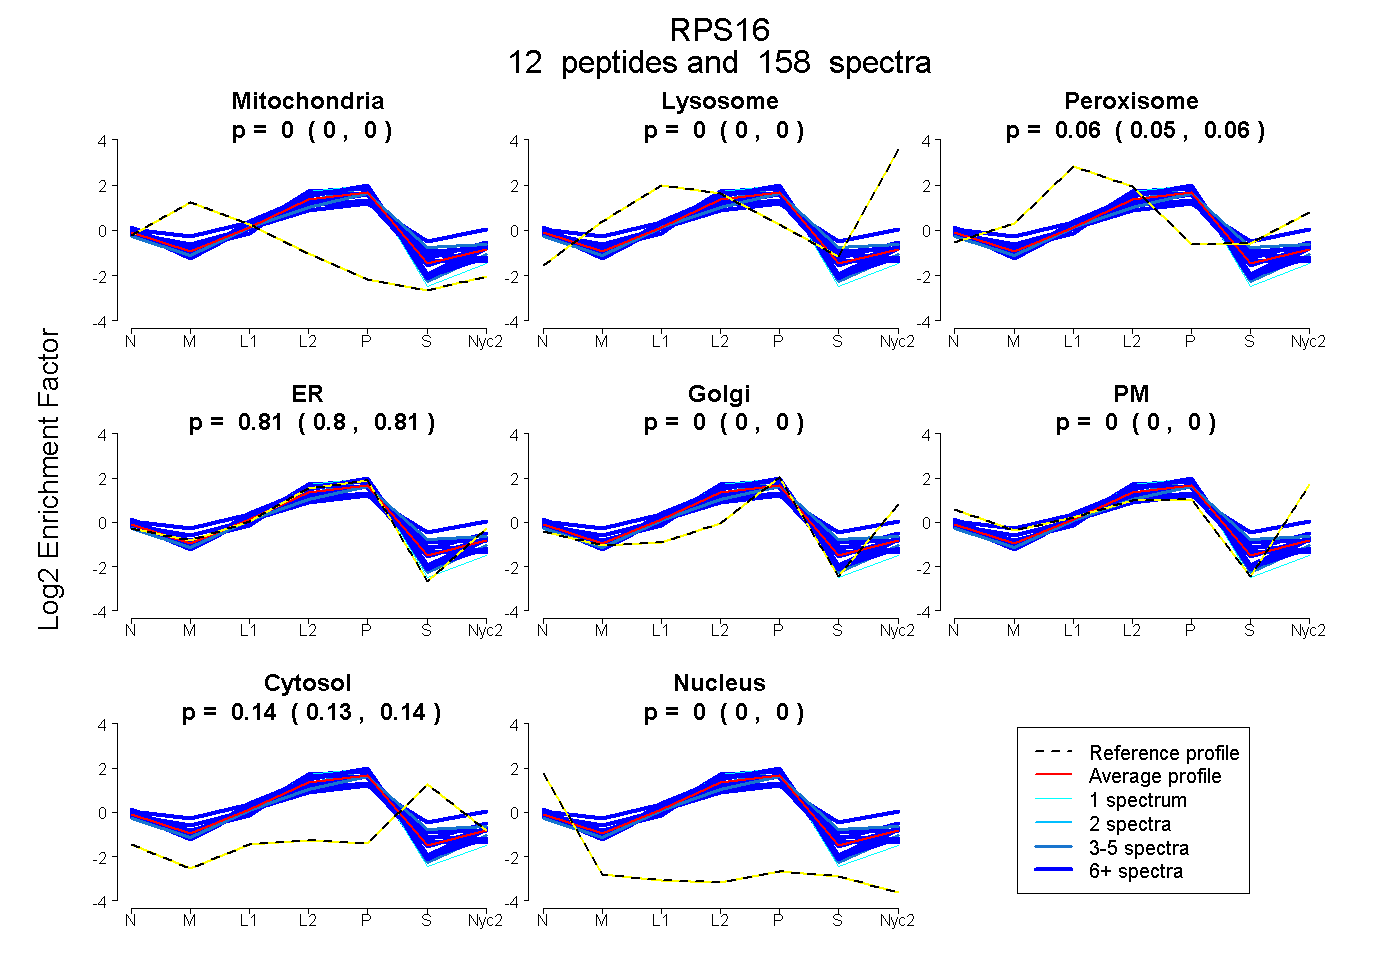
| Plot | Mito | Lyso | Perox | ER | Golgi | PM | Cytosol | Nucleus | |||||
| Expt A |
12 peptides |
158 spectra |
|
0.000 0.000 | 0.000 |
0.000 0.000 | 0.000 |
0.055 0.052 | 0.058 |
0.808 0.803 | 0.812 |
0.000 0.000 | 0.000 |
0.000 0.000 | 0.000 |
0.137 0.134 | 0.139 |
0.000 0.000 | 0.000 |
| 5 spectra, ALVAYYQK | 0.000 | 0.000 | 0.008 | 0.926 | 0.000 | 0.000 | 0.021 | 0.045 | ||
| 29 spectra, GPLQSVQVFGR | 0.000 | 0.000 | 0.037 | 0.898 | 0.000 | 0.000 | 0.066 | 0.000 | ||
| 33 spectra, TATAVAHCK | 0.000 | 0.000 | 0.029 | 0.794 | 0.000 | 0.000 | 0.145 | 0.032 | ||
| 13 spectra, LLEPVLLLGK | 0.000 | 0.000 | 0.035 | 0.758 | 0.000 | 0.000 | 0.207 | 0.000 | ||
| 17 spectra, GGGHVAQIYAIR | 0.000 | 0.000 | 0.248 | 0.355 | 0.187 | 0.000 | 0.210 | 0.000 | ||
| 9 spectra, VNGRPLEMIEPR | 0.000 | 0.000 | 0.083 | 0.778 | 0.000 | 0.000 | 0.138 | 0.000 | ||
| 24 spectra, FGGPGAR | 0.000 | 0.000 | 0.015 | 0.943 | 0.000 | 0.000 | 0.043 | 0.000 | ||
| 1 spectrum, GNGLIK | 0.000 | 0.000 | 0.000 | 0.953 | 0.000 | 0.000 | 0.000 | 0.047 | ||
| 6 spectra, TLLVADPR | 0.090 | 0.000 | 0.140 | 0.692 | 0.000 | 0.000 | 0.078 | 0.000 | ||
| 5 spectra, YVDEASK | 0.000 | 0.000 | 0.080 | 0.682 | 0.000 | 0.000 | 0.238 | 0.000 | ||
| 8 spectra, DILIQYDR | 0.000 | 0.000 | 0.079 | 0.712 | 0.000 | 0.000 | 0.209 | 0.000 | ||
| 8 spectra, FAGVDIR | 0.000 | 0.000 | 0.000 | 0.932 | 0.000 | 0.000 | 0.050 | 0.018 |
| Plot | Mito | Lyso or Perox | ER | Golgi | PM | Cytosol | Nucleus | ||||||
| Expt B |
10 peptides |
40 spectra |
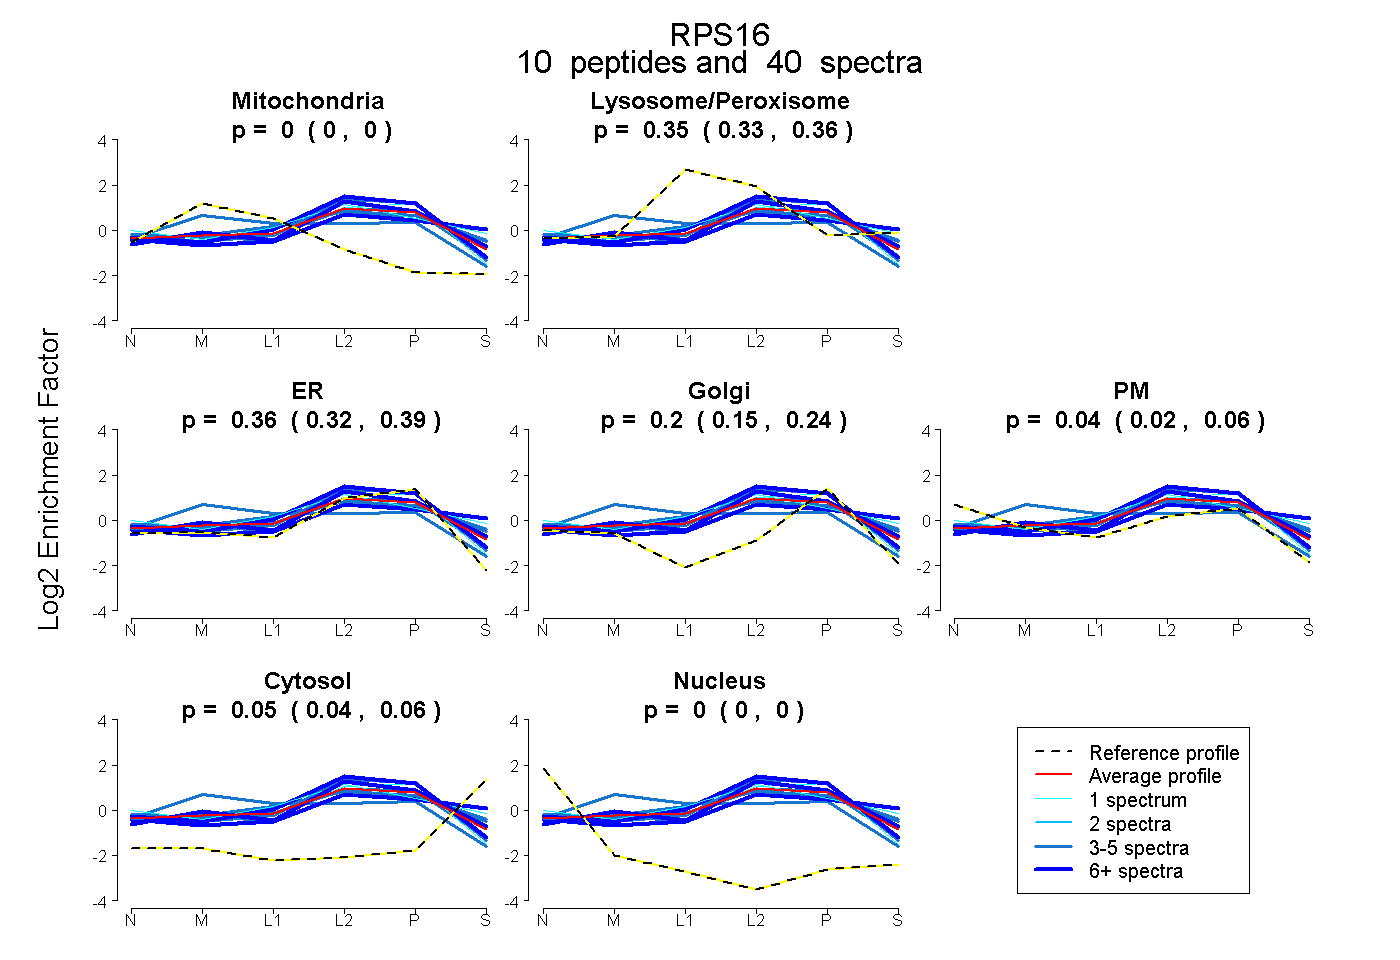 |
0.000 0.000 | 0.000 |
0.346 0.327 | 0.362 |
0.359 0.319 | 0.394 |
0.200 0.151 | 0.238 |
0.042 0.020 | 0.061 |
0.053 0.042 | 0.063 |
0.000 0.000 | 0.000 |
|||
| Plot | Lyso | Other | |||||||||||
| Expt C |
12 peptides |
177 spectra |
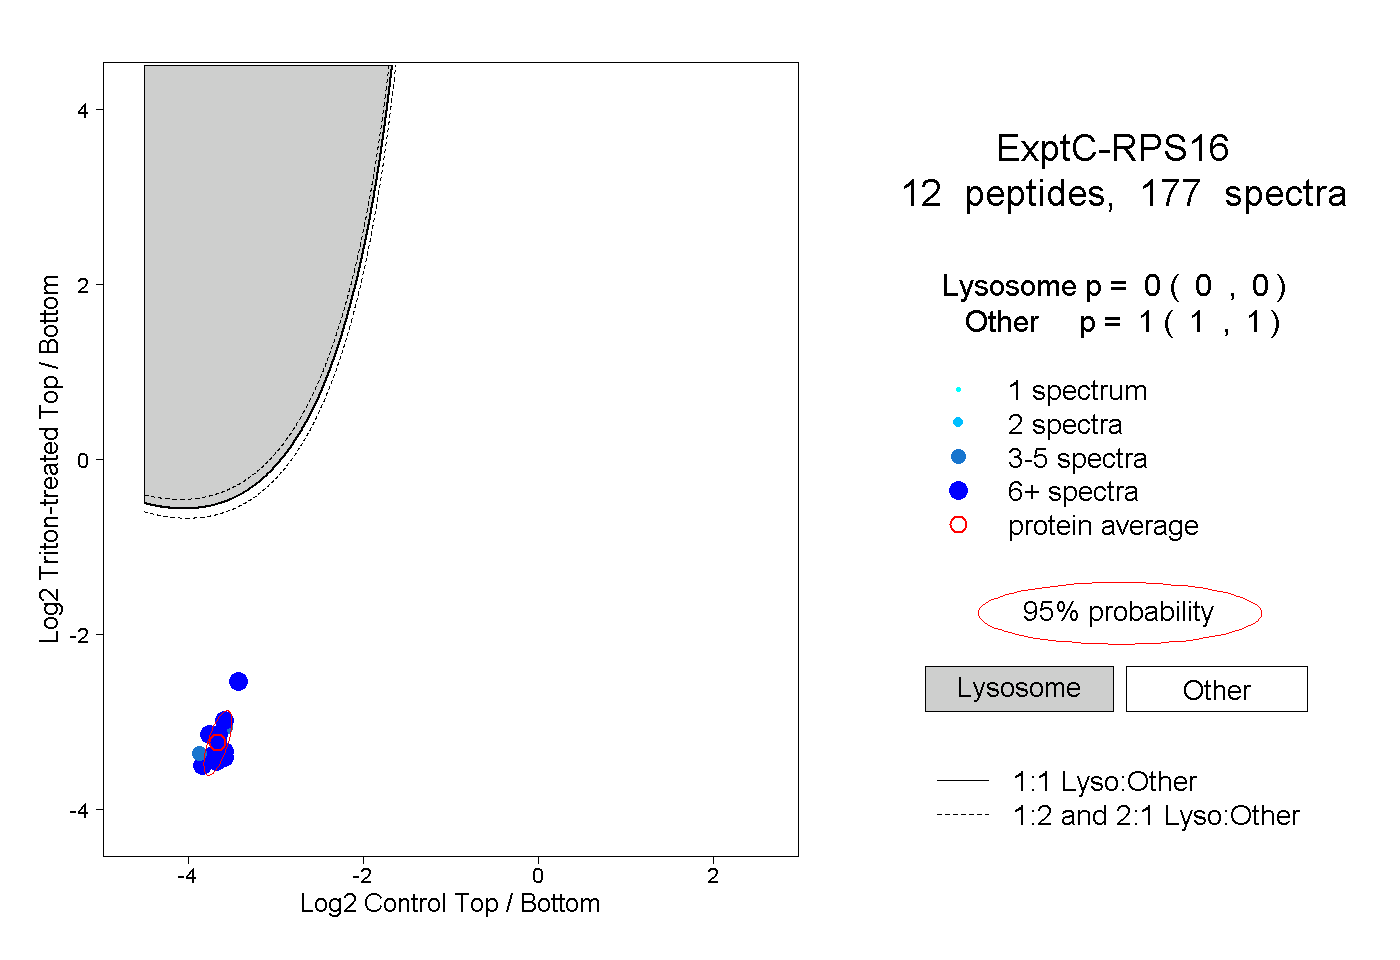 |
0.000 0.000 | 0.000 |
1.000 1.000 | 1.000 |
||||||||
| Plot | Lyso | Other | |||||||||||
| Expt D |
6 peptides |
13 spectra |
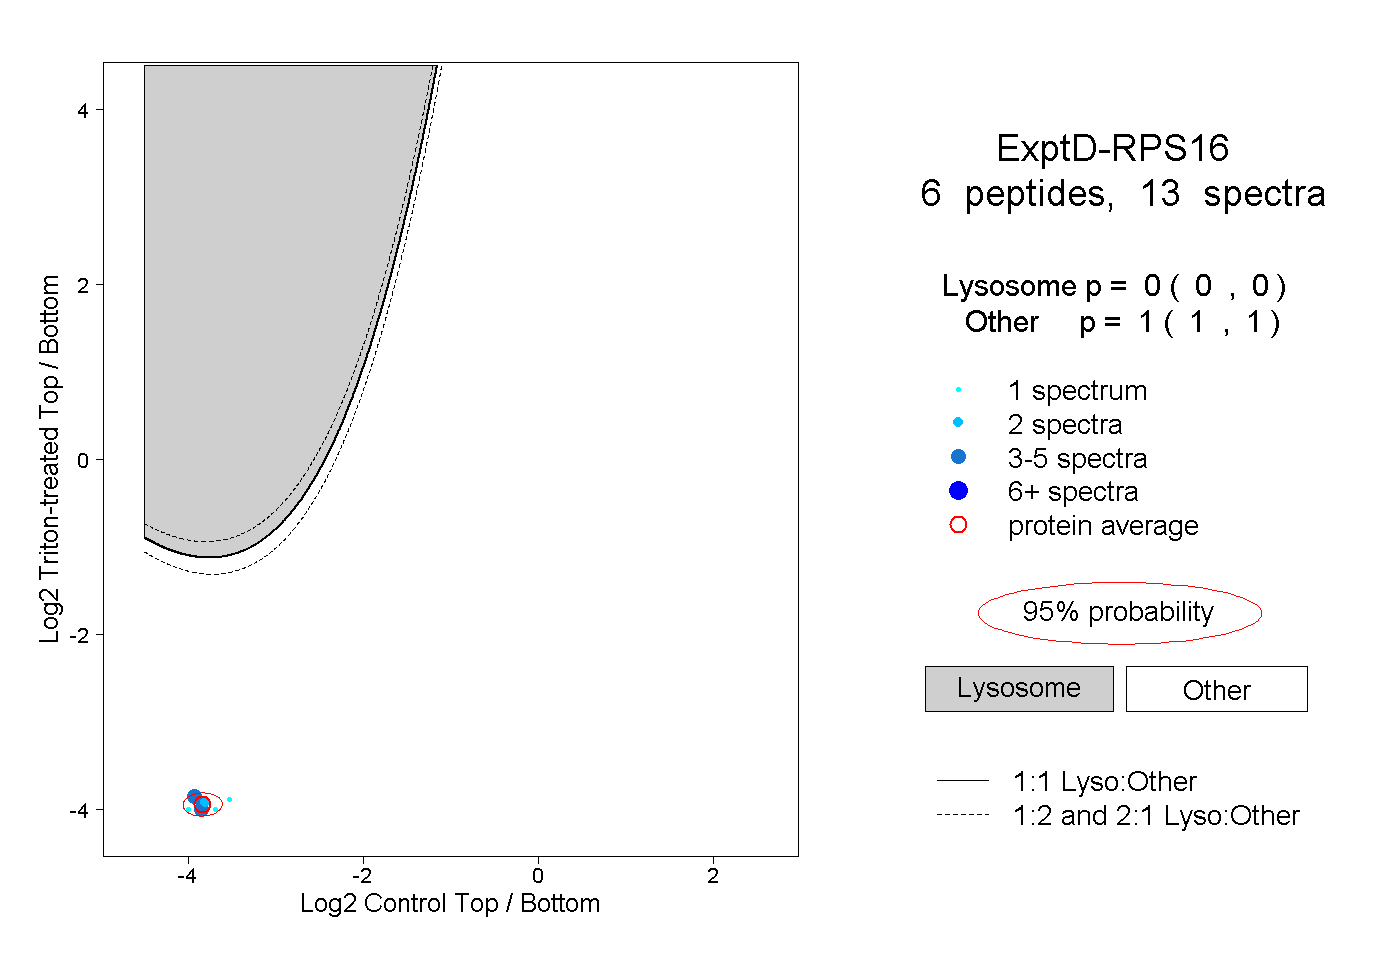 |
0.000 0.000 | 0.000 |
1.000 1.000 | 1.000 |