 26
26peptides
spectra
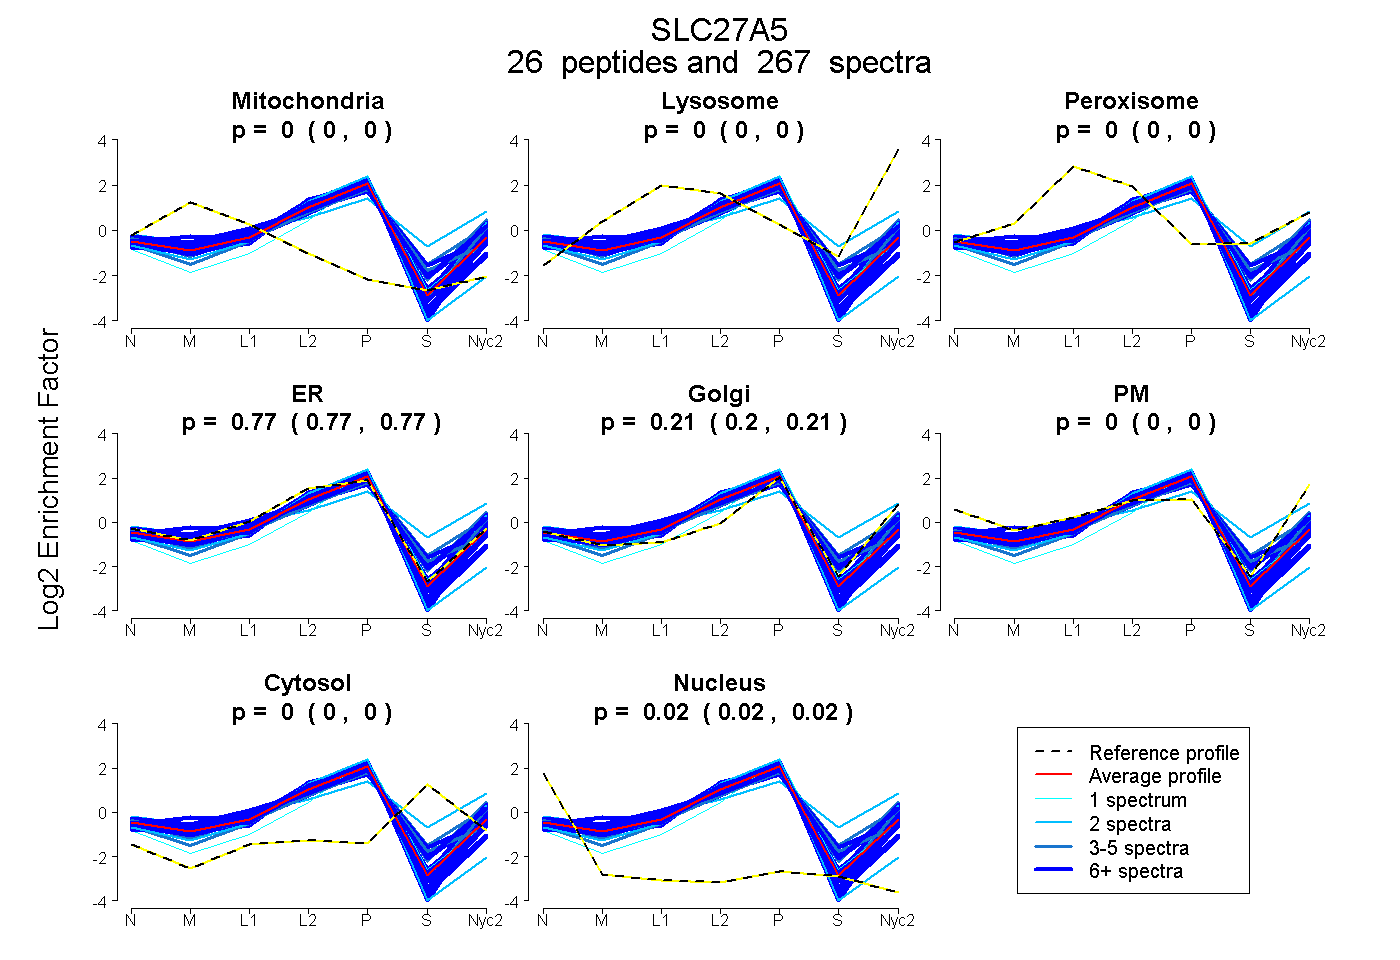
0.000 | 0.000
0.000 | 0.000
0.000 | 0.000
0.767 | 0.774
0.204 | 0.213
0.000 | 0.000
0.000 | 0.000
0.019 | 0.022
24peptides
spectra
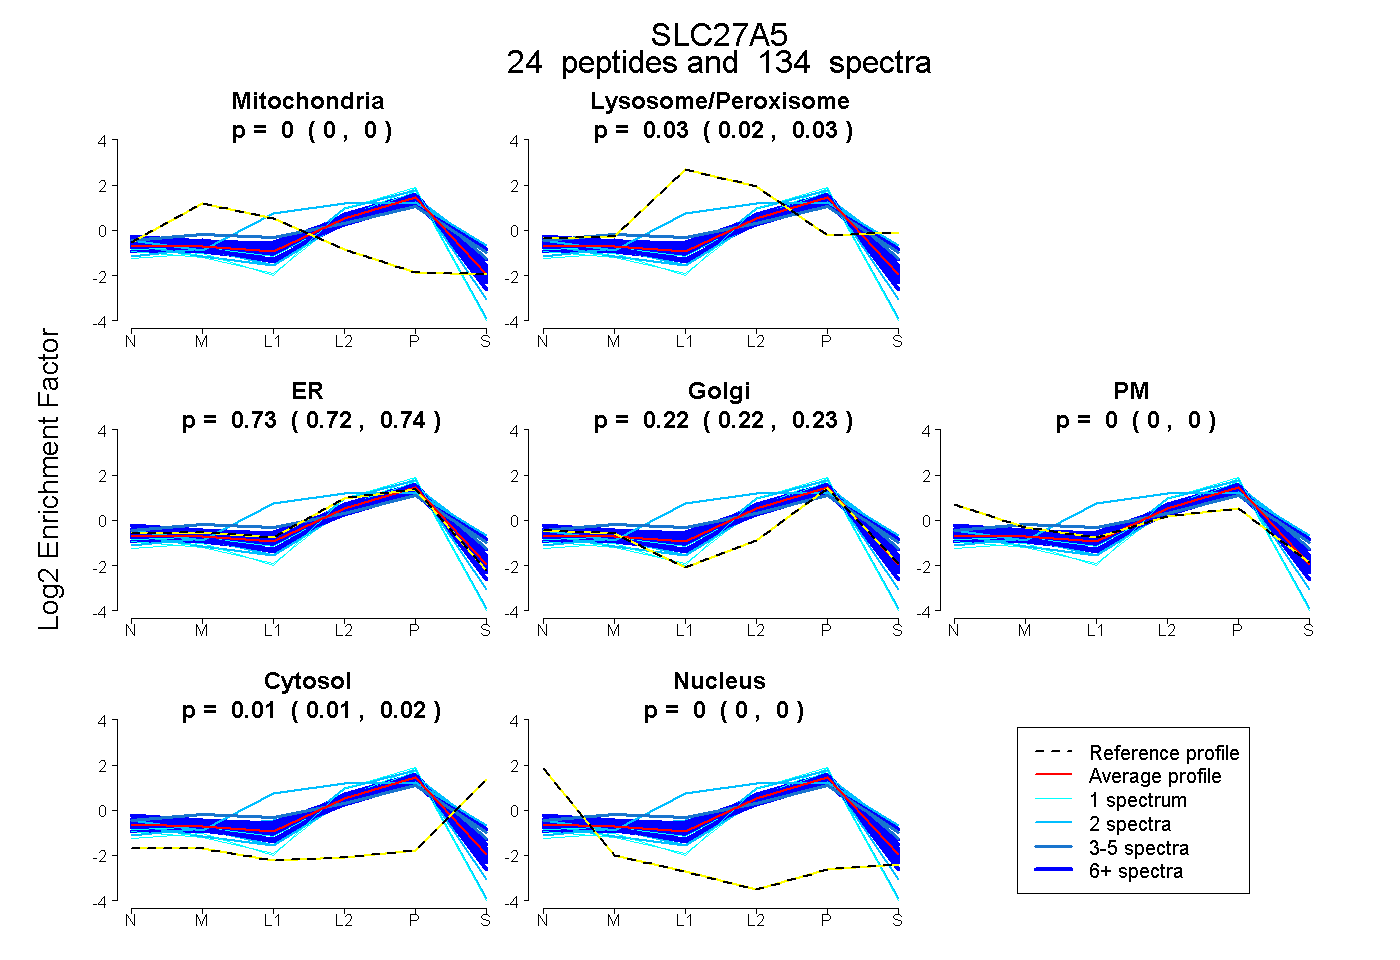
0.000 | 0.000
0.021 | 0.031
0.725 | 0.744
0.217 | 0.230
0.000 | 0.000
0.011 | 0.016
0.000 | 0.000
24peptides
spectra
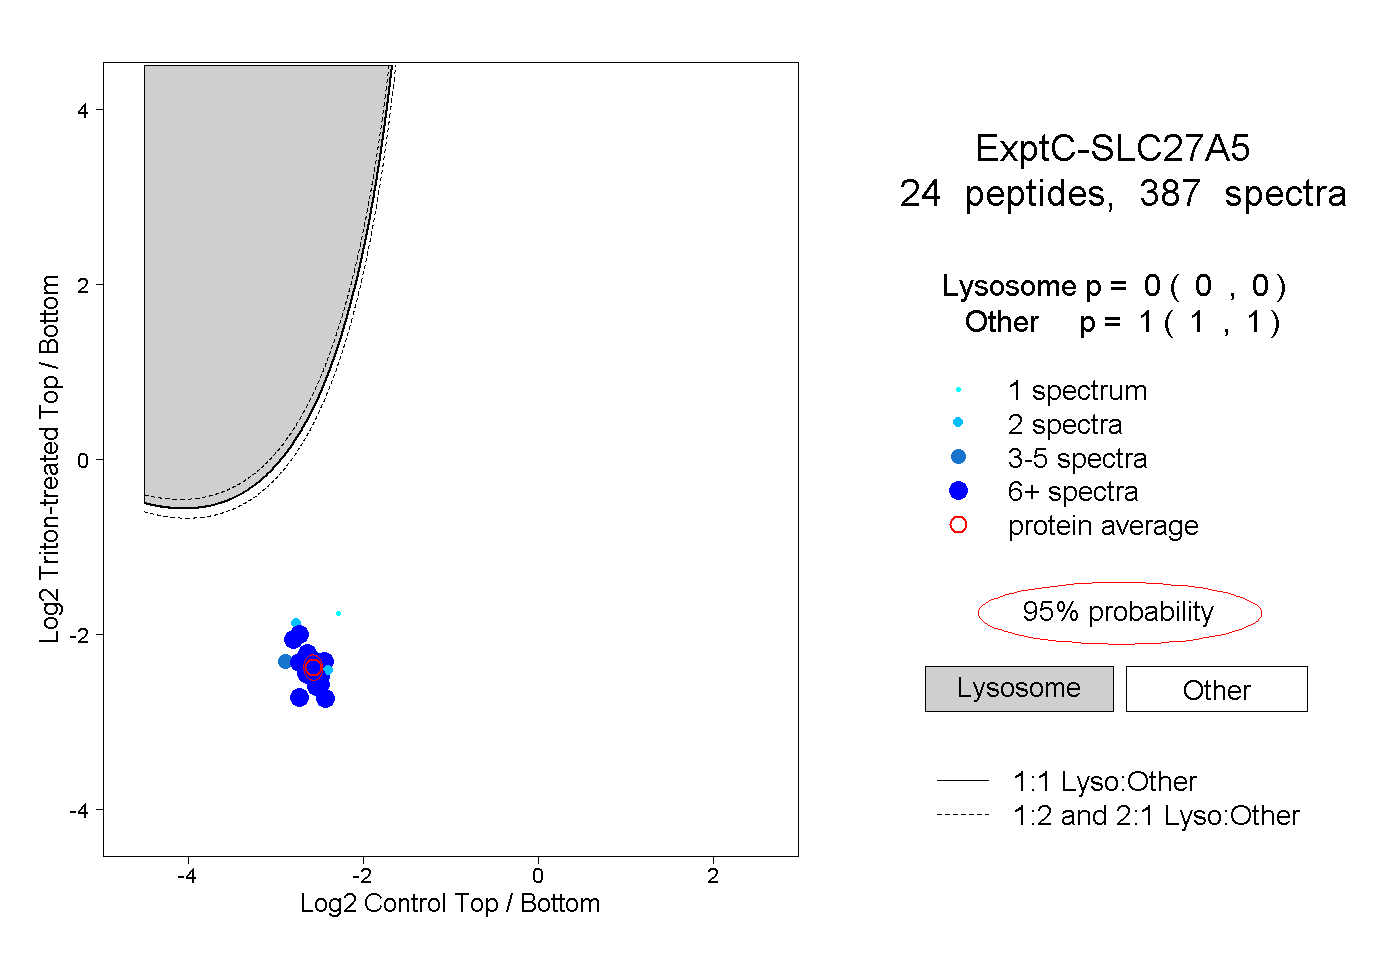
0.000 | 0.000
1.000 | 1.000
14peptides
spectra
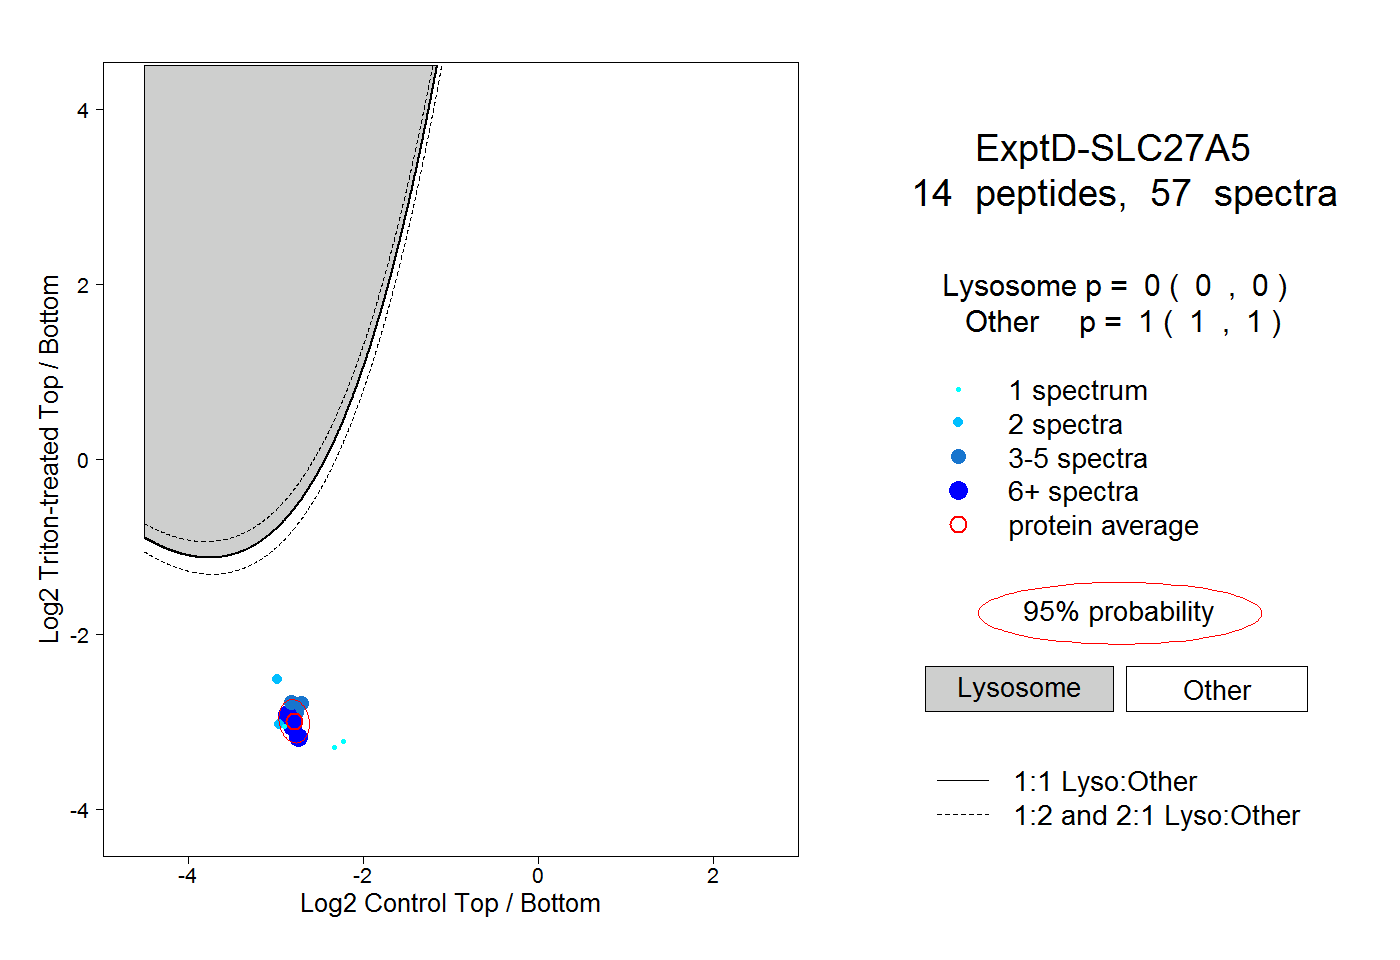
0.000 | 0.000
1.000 | 1.000