 17
17peptides
spectra
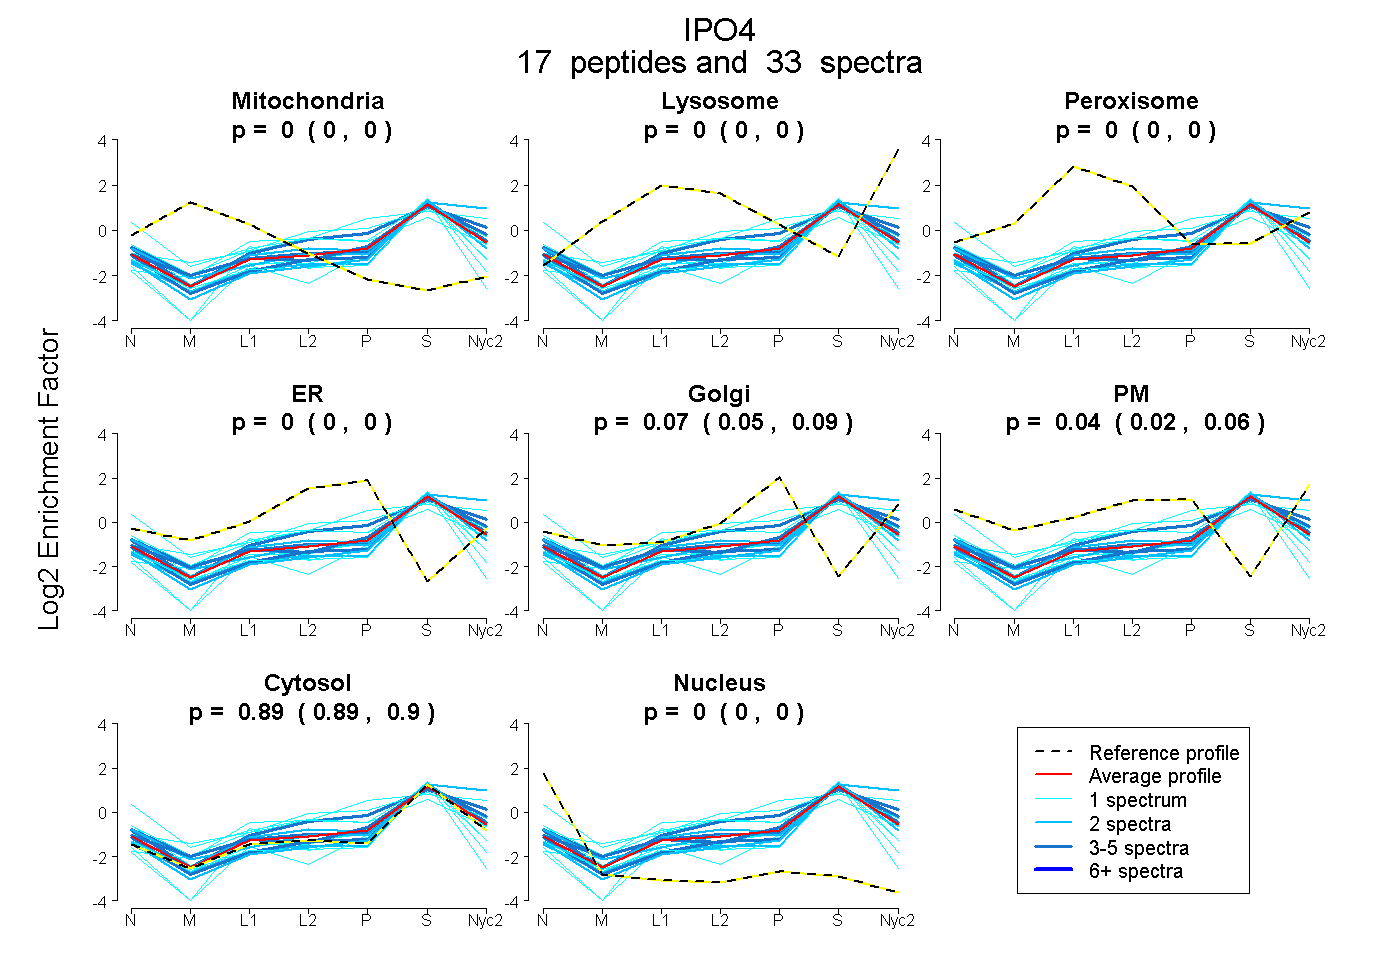
0.000 | 0.000
0.000 | 0.000
0.000 | 0.000
0.000 | 0.000
0.048 | 0.086
0.018 | 0.055
0.886 | 0.898
0.000 | 0.000
4peptides
spectra
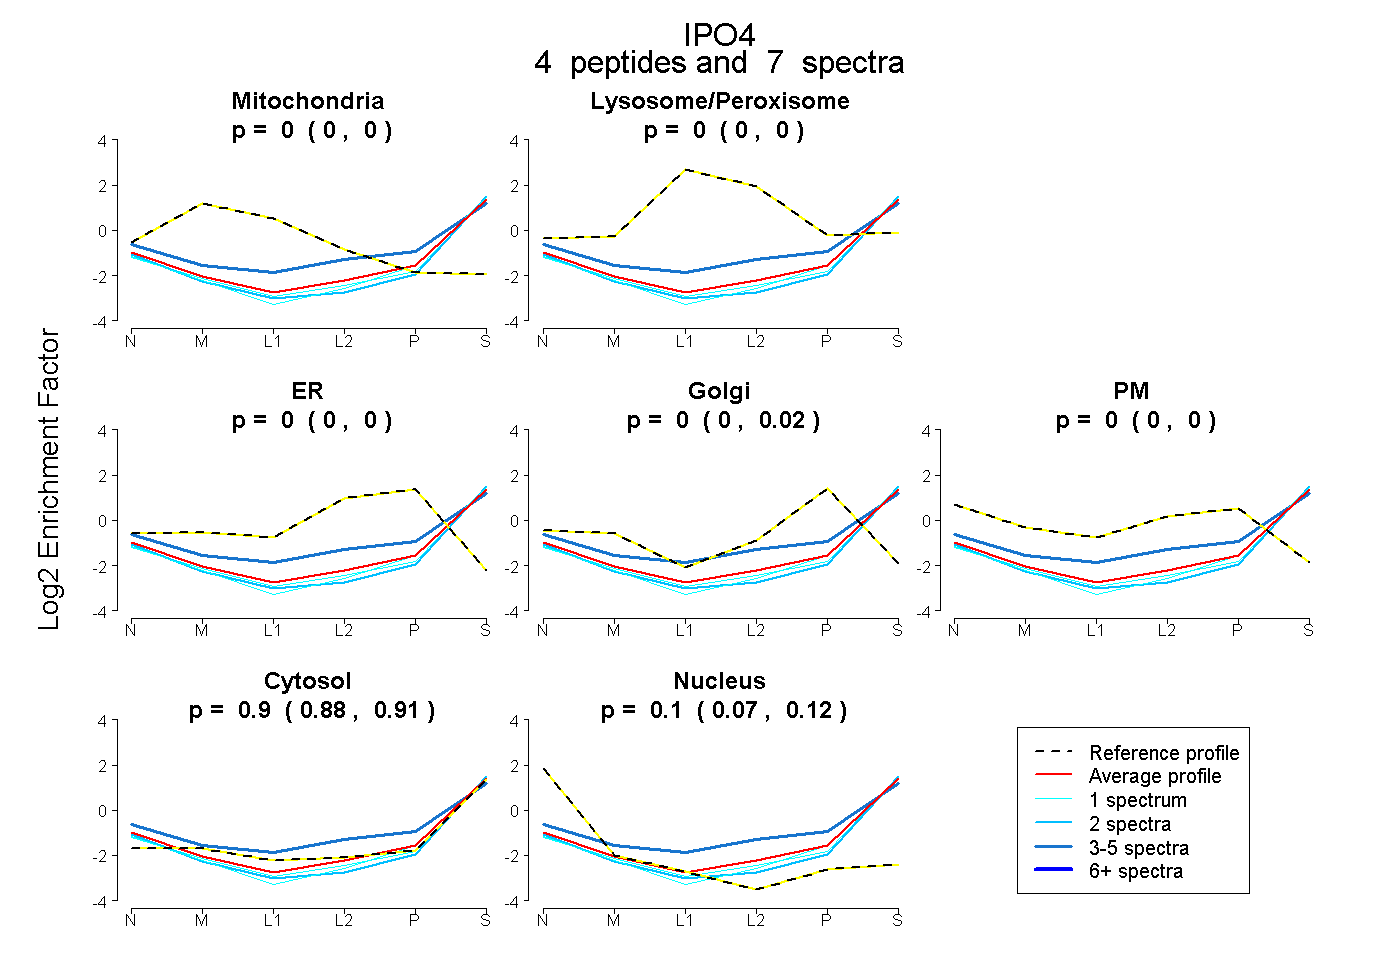
0.000 | 0.000
0.000 | 0.000
0.000 | 0.000
0.000 | 0.021
0.000 | 0.000
0.877 | 0.915
0.072 | 0.119
10peptides
spectra
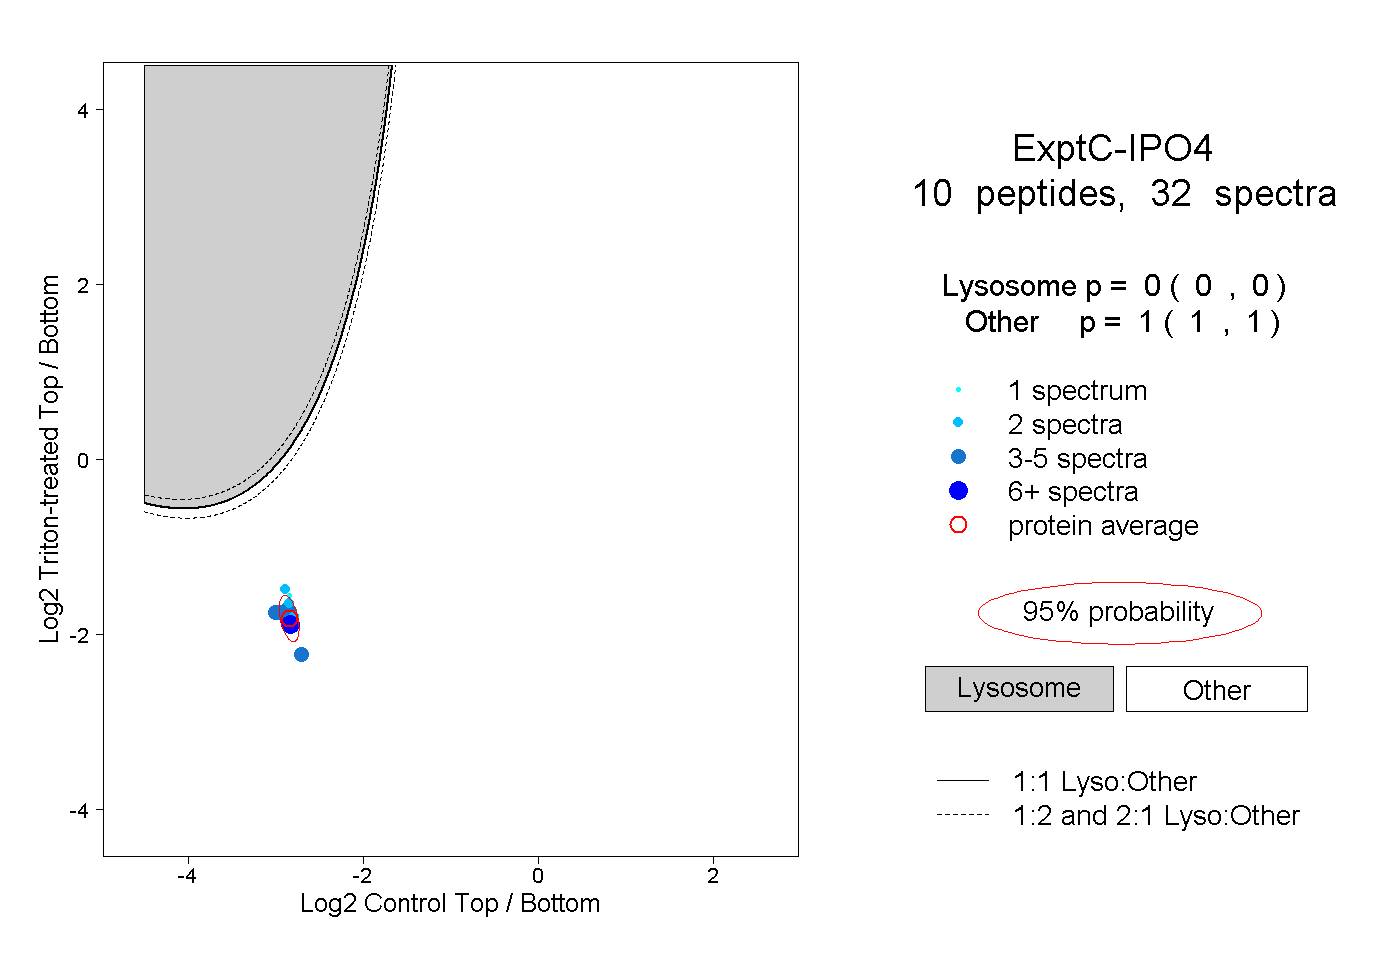
0.000 | 0.000
1.000 | 1.000