IPO4
[ENSRNOP00000026552]
Main page
| | | Plot |
Mito |
Lyso |
|
Perox |
ER |
Golgi |
PM |
Cytosol |
Nucleus |
|
| Expt A |
 17
17
peptides |
33
spectra |
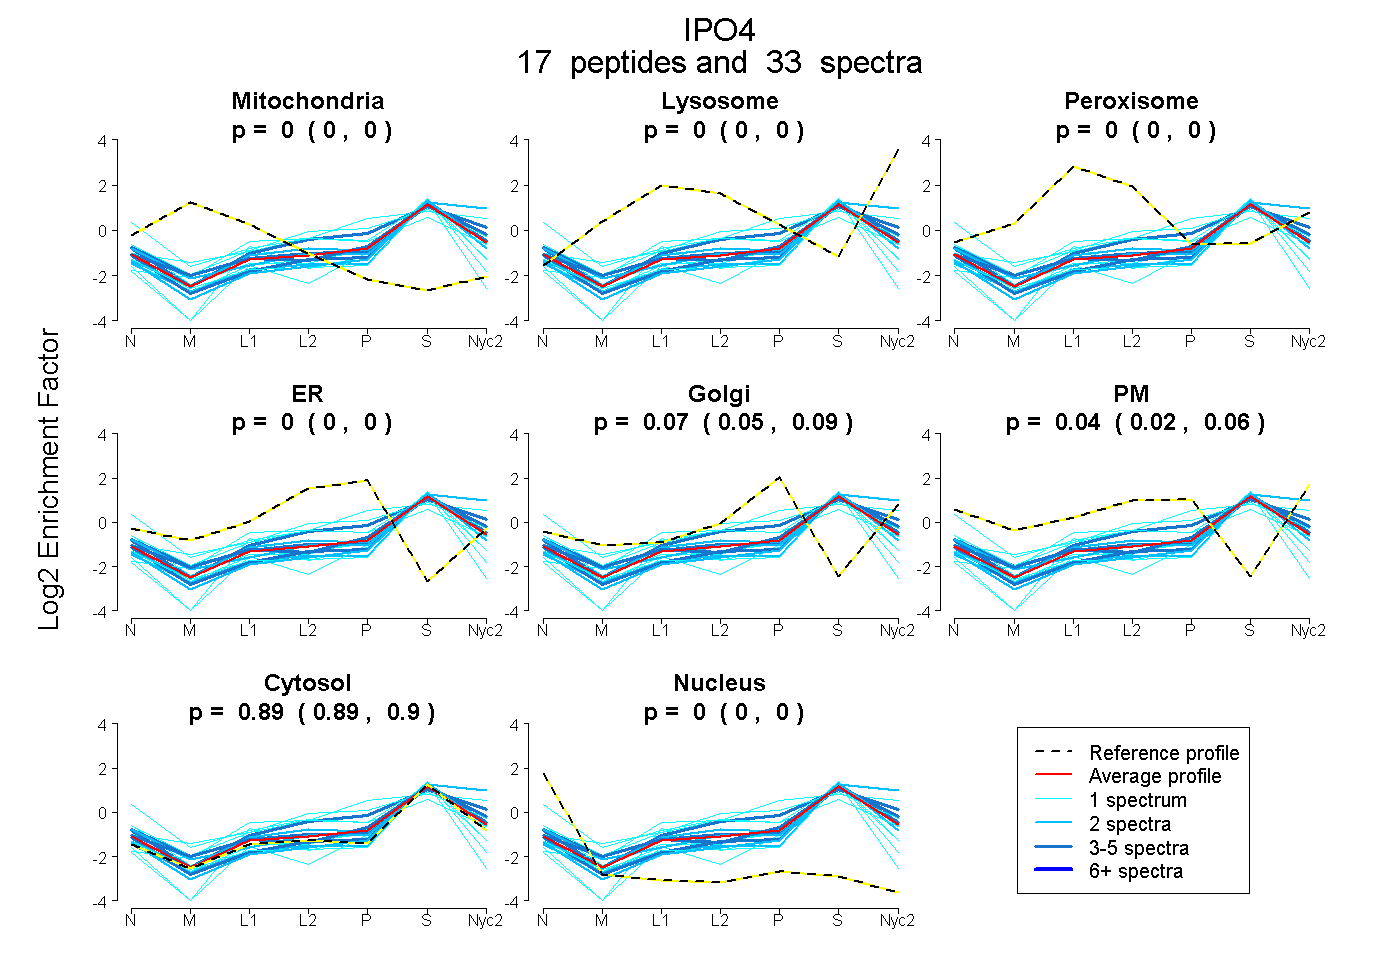 |
0.000
0.000 | 0.000 |
0.000
0.000 | 0.000 |
|
0.000
0.000 | 0.000 |
0.000
0.000 | 0.000 |
0.069
0.048 | 0.086 |
0.039
0.018 | 0.055 |
0.893
0.886 | 0.898 |
0.000
0.000 | 0.000 |
|
| | | Plot |
Mito |
|
Lyso or Perox |
|
ER |
Golgi |
PM |
Cytosol |
Nucleus |
|
| Expt B |
4
peptides |
7
spectra |
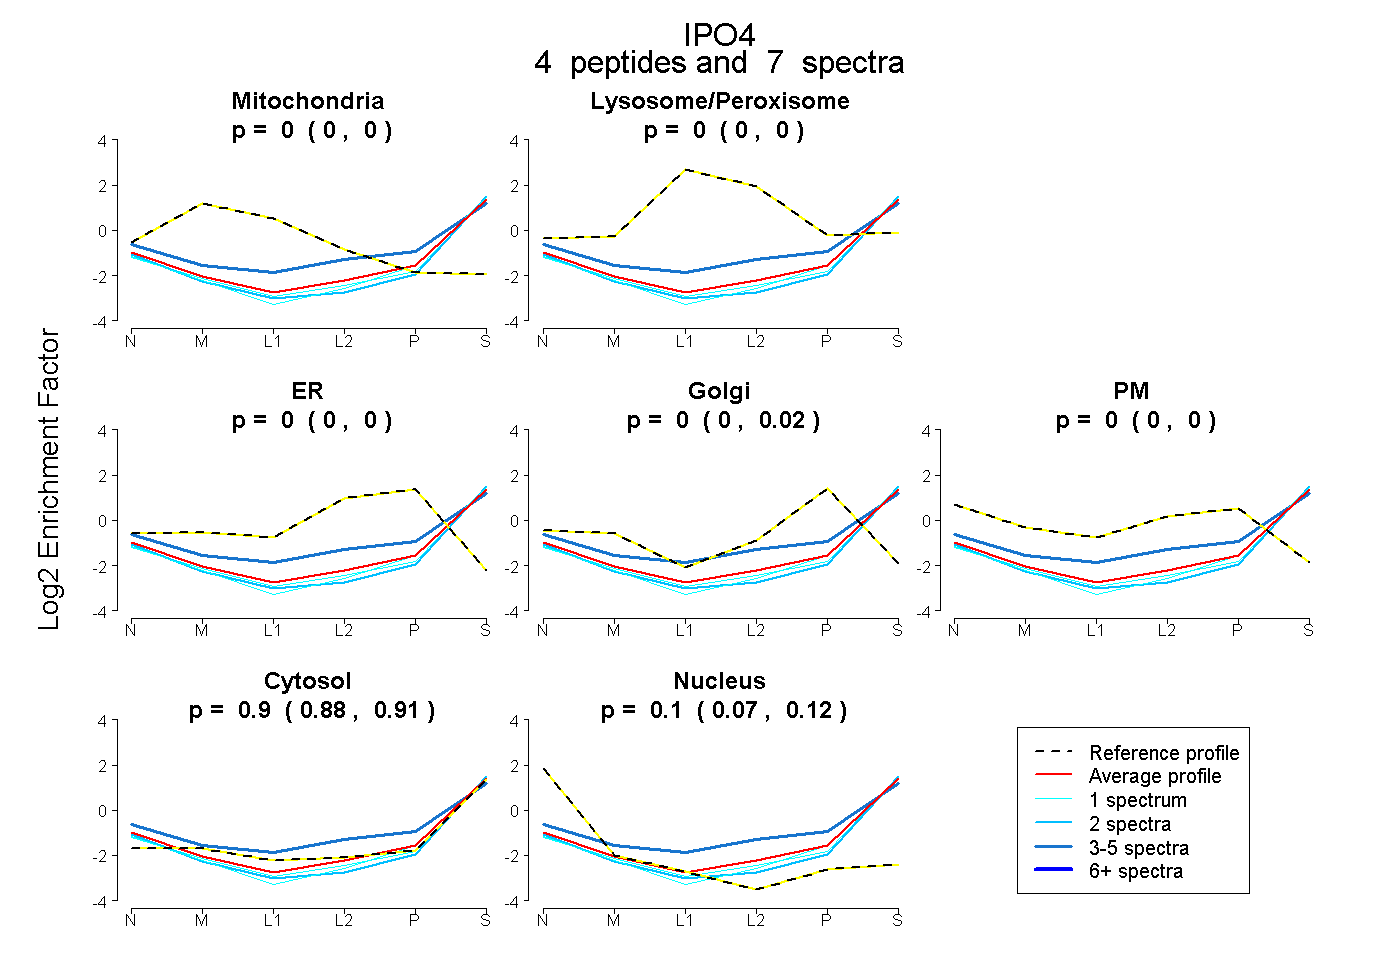 |
0.000
0.000 | 0.000 |
|
0.000
0.000 | 0.000 |
|
0.000
0.000 | 0.000 |
0.000
0.000 | 0.021 |
0.000
0.000 | 0.000 |
0.900
0.877 | 0.915 |
0.100
0.072 | 0.119 |
|
| 2 spectra, LFPVLLNNAR |
0.000 |
|
0.000 |
|
0.000 |
0.000 |
0.000 |
0.882 |
0.118 |
|
| 3 spectra, GLDDPSQVVR |
0.000 |
|
0.045 |
|
0.000 |
0.000 |
0.202 |
0.753 |
0.000 |
|
| 1 spectrum, VVTALR |
0.000 |
|
0.000 |
|
0.000 |
0.000 |
0.000 |
0.907 |
0.093 |
|
| 1 spectrum, EADPEVR |
0.000 |
|
0.000 |
|
0.000 |
0.000 |
0.000 |
0.919 |
0.081 |
|
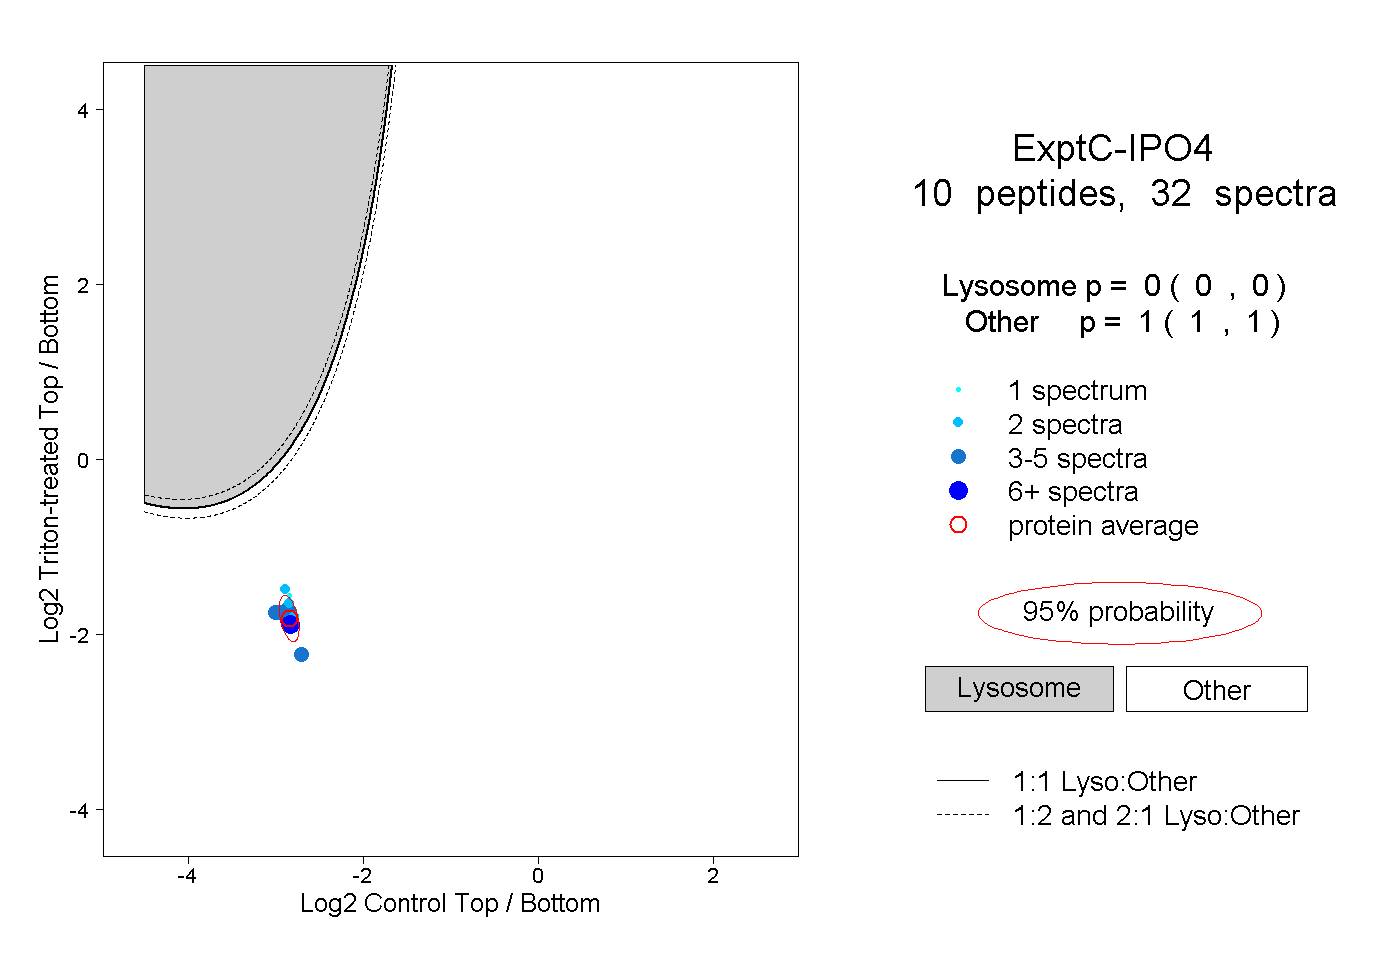
| | | Plot |
|
Lyso |
|
|
|
|
|
|
|
Other |
| Expt C |
10
peptides |
32
spectra |
 |
|
0.000
0.000 | 0.000 |
|
|
|
|
|
|
|
1.000
1.000 | 1.000 |